

Extraction and generalisation of category-level information during visual statistical learning in autistic people
- PMID: 37267333
- PMCID: PMC10237412
- DOI: 10.1371/journal.pone.0286018
Extraction and generalisation of category-level information during visual statistical learning in autistic people
Abstract
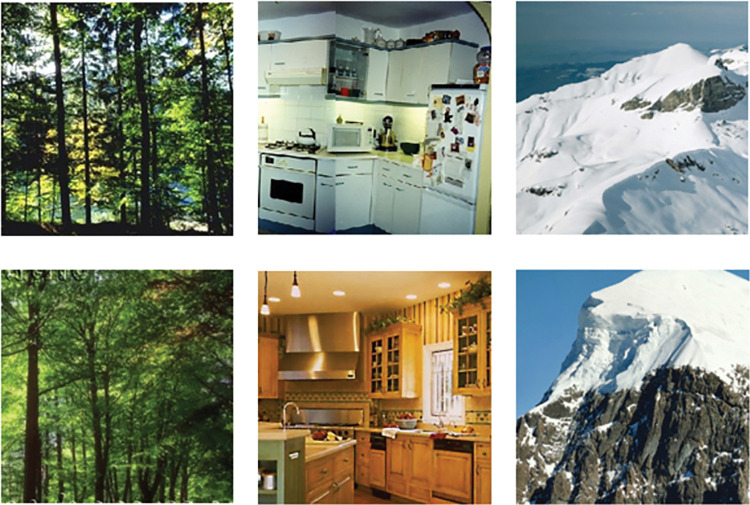
Background: We examined whether information extracted during a visual statistical learning task could be generalised from specific exemplars to semantically similar ones. We then looked at whether performance in autistic people differed to non-autistic people during a visual statistical learning task and specifically examined whether differences in performance between groups occurred when sequential information was presented at a semantic level. We did this by assessing recall performance using a two-alternative forced choice paradigm after presenting participants with a sequence of naturalistic scene images.
Methods: 125 adult participants (61 participants with an autism diagnosis and 64 non-autistic controls) were presented with a fast serial presentation sequence of images and given a cover task to avoid attention being explicitly drawn to patterns in the underlying sequences. This was followed by a two-alternative forced choice task to assess participants' implicit recall. Participants were presented with 1 of 3 unique versions of the task, in which the presentation and assessment of statistical regularities was done at either a low feature-based level or a high semantic-based level.
Results: Participants were able to generalise statistical information from specific exemplars to semantically similar ones. There was an overall significant reduction in visual statistical learning in the autistic group but we were unable to determine whether group differences occurred specifically in conditions where the learning of semantic information was required.
Conclusions: These results provide evidence that participants are able to extract statistical information that is presented at the level of specific exemplars and generalise it to semantically similar contexts. We also showed a modest but statistically significant reduction in recall performance in the autistic participants relative to the non-autistic participants.
Copyright: © 2023 Parsons, Baron-Cohen. This is an open access article distributed under the terms of the Creative Commons Attribution License, which permits unrestricted use, distribution, and reproduction in any medium, provided the original author and source are credited.
Conflict of interest statement
The authors have declared that no competing interests exist.
Figures


References
-
- DSM-5 American Psychiatric Association. Diagnostic and statistical manual of mental disorders. Arlington: American Psychiatric Publishing. (2013).
Publication types
MeSH terms
Grants and funding
LinkOut - more resources
Full Text Sources
