

Patterns of overlapping habitat use of juvenile white shark and human recreational water users along southern California beaches
- PMID: 37267342
- PMCID: PMC10237640
- DOI: 10.1371/journal.pone.0286575
Patterns of overlapping habitat use of juvenile white shark and human recreational water users along southern California beaches
Abstract
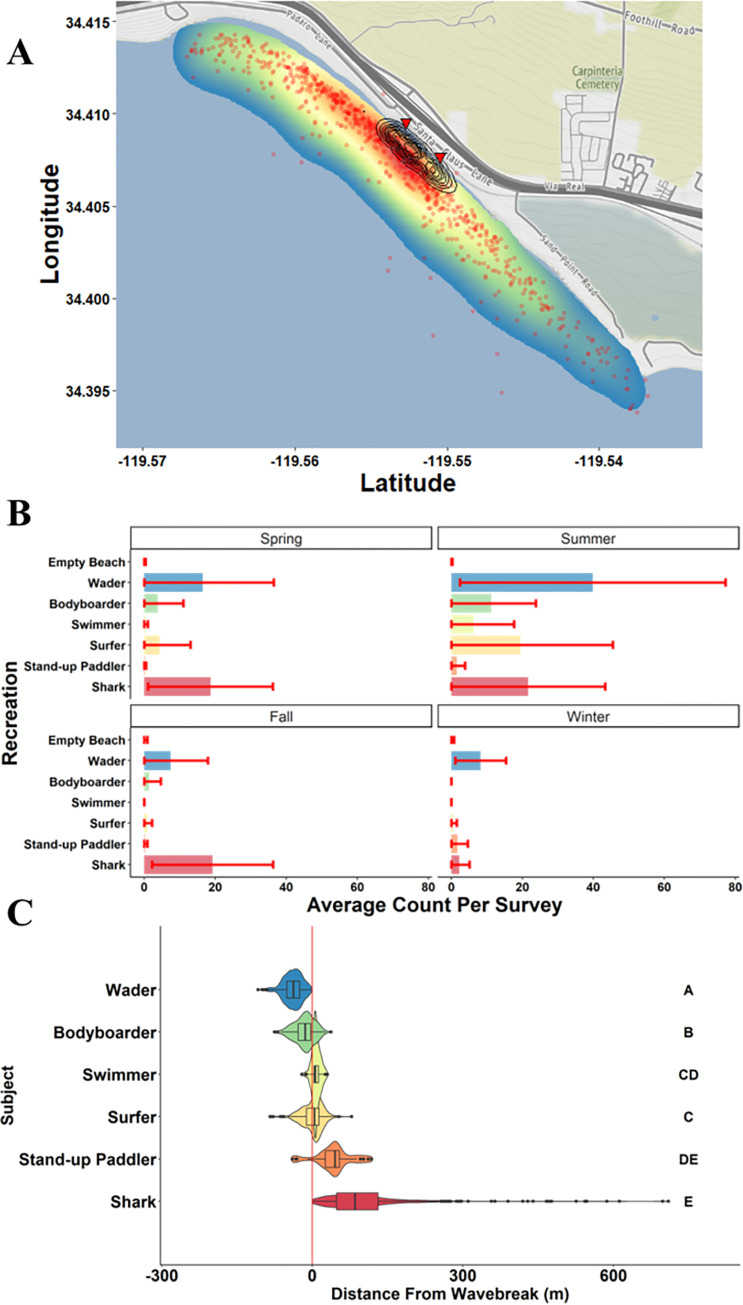
Juvenile white sharks (JWS) of the Northeastern Pacific population are present in nearshore southern California waters and form mixed size class (~1.5-3 m) aggregations for weeks to months, often within 500 m of shore. These nearshore beach habitats are heavily used for human recreation (e.g., surfing, swimming, body boarding, wading, and standup paddleboarding) and the amount of spatio-temporal overlap between JWS and humans is currently unknown. Increases in human population and the Northeastern Pacific population of white sharks have raised concern over human beach safety. To determine spatio-temporal JWS-human overlap at various spatial scales (e.g., across the entire southern California coastline, across different distances from shore, and within specific beach locations), 26 beach locations across southern California were surveyed monthly resulting in 1644 aerial drone surveys between January 2019 to March 2021. Thirteen environmental variables were assessed to predict when spatio-temporal overlap between JWS and water users was highest. Coast-wide distribution of JWS was clumped, limiting human-shark co-occurrence to specific locations, with 1096 of 1204 JWS observations occurring at Carpinteria and Del Mar Beach locations. Nearshore distribution indicated JWS are often close enough to the wave break to interact with some water users (median = 101 m, range = 2-702 m), although JWS had the most spatial overlap with stand-up paddlers. Daily human-shark co-occurrence was 97% at beaches where JWS aggregations had formed, and human activity showed high spatial overlap at shark aggregation sites. Although there is higher seasonal human-shark spatio-temporal overlap where aggregations form in southern California, the number of unprovoked shark bites across southern California is extremely low. This study provides evidence that high human-shark spatio-temporal overlap does not lead to an increased bite frequency in southern California, and there are a number of possible explanations as to why JWS are not biting water users despite daily encounters.
Copyright: © 2023 Rex et al. This is an open access article distributed under the terms of the Creative Commons Attribution License, which permits unrestricted use, distribution, and reproduction in any medium, provided the original author and source are credited.
Conflict of interest statement
The authors have declared that no competing interests exist.
Figures


Similar articles
-
Shark Spotters: Successfully reducing spatial overlap between white sharks (Carcharodon carcharias) and recreational water users in False Bay, South Africa.PLoS One. 2017 Sep 25;12(9):e0185335. doi: 10.1371/journal.pone.0185335. eCollection 2017. PLoS One. 2017. PMID: 28945806 Free PMC article.
-
Quantifying habitat selection and variability in habitat suitability for juvenile white sharks.PLoS One. 2019 May 8;14(5):e0214642. doi: 10.1371/journal.pone.0214642. eCollection 2019. PLoS One. 2019. PMID: 31067227 Free PMC article.
-
Bull Shark (Carcharhinus leucas) Occurrence along Beaches of South-Eastern Australia: Understanding Where, When and Why.Biology (Basel). 2023 Aug 31;12(9):1189. doi: 10.3390/biology12091189. Biology (Basel). 2023. PMID: 37759589 Free PMC article.
-
Diet Composition and Trophic Ecology of Northeast Pacific Ocean Sharks.Adv Mar Biol. 2017;77:111-148. doi: 10.1016/bs.amb.2017.06.001. Epub 2017 Aug 18. Adv Mar Biol. 2017. PMID: 28882212 Review.
-
Biodiversity and conservation of sharks in Pacific Mexico.Adv Mar Biol. 2019;83:11-60. doi: 10.1016/bs.amb.2019.08.001. Epub 2019 Sep 3. Adv Mar Biol. 2019. PMID: 31606068 Review.
References
-
- Reid DD, Robbins WD, Peddemors VM. Decadal trends in shark catches and effort from the New South Wales, Australia, Shark Meshing Program 1950–2010. In: Marine and Freshwater Research, pp. 676–693.
-
- Davidson LNK, Krawchuk MA, Dulvy NK. Why have global shark and ray landings declined: Improved management or overfishing? Fish Fish 2016; 17: 438–458.
-
- Brown CJ, Roff G. Life-history traits inform population trends when assessing the conservation status of a declining tiger shark population. Biol Conserv 2019; 239: 108230.
Publication types
MeSH terms
Substances
LinkOut - more resources
Full Text Sources
Medical
