. 2023 Jun 8;8(84):eadd9232.
doi: 10.1126/sciimmunol.add9232. Epub 2023 Jun 2.

Group A Streptococcus induces CD1a-autoreactive T cells and promotes psoriatic inflammation

Affiliations

Group A Streptococcus induces CD1a-autoreactive T cells and promotes psoriatic inflammation

Yi-Ling Chen et al. Sci Immunol. .

Abstract

Group A Streptococcus (GAS) infection is associated with multiple clinical sequelae, including different subtypes of psoriasis. Such post-streptococcal disorders have been long known but are largely unexplained. CD1a is expressed at constitutively high levels by Langerhans cells and presents lipid antigens to T cells, but the potential relevance to GAS infection has not been studied. Here, we investigated whether GAS-responsive CD1a-restricted T cells contribute to the pathogenesis of psoriasis. Healthy individuals had high frequencies of circulating and cutaneous GAS-responsive CD4+ and CD8+ T cells with rapid effector functions, including the production of interleukin-22 (IL-22). Human skin and blood single-cell CITE-seq analyses of IL-22-producing T cells showed a type 17 signature with proliferative potential, whereas IFN-γ-producing T cells displayed cytotoxic T lymphocyte characteristics. Furthermore, individuals with psoriasis had significantly higher frequencies of circulating GAS-reactive T cells, enriched for markers of activation, cytolytic potential, and tissue association. In addition to responding to GAS, subsets of expanded GAS-reactive T cell clones/lines were found to be autoreactive, which included the recognition of the self-lipid antigen lysophosphatidylcholine. CD8+ T cell clones/lines produced cytolytic mediators and lysed infected CD1a-expressing cells. Furthermore, we established cutaneous models of GAS infection in a humanized CD1a transgenic mouse model and identified enhanced and prolonged local and systemic inflammation, with resolution through a psoriasis-like phenotype. Together, these findings link GAS infection to the CD1a pathway and show that GAS infection promotes the proliferation and activation of CD1a-autoreactive T cells, with relevance to post-streptococcal disease, including the pathogenesis and treatment of psoriasis.


Conflict of interest statement

Competing interests

G.O., C.S.H., and Y.-L.C. hold patent filings related to CD1a. G.O., J.N., and Y.-L.C. have relevant research collaborations with Janssen. G.O. has received relevant research support from UCB, Janssen administered through the University of Oxford. All other authors declare that they have no competing interests.

Figures

Figure 1
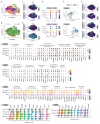
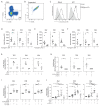
Figure 1. High frequencies of circulating GAS-responsive CD1a-reactive T cells found in healthy individuals.
(A) Production of IL-22 from polyclonal blood T cells after 4-hour co-culture with control or GAS-infected K562 cells (MOI=100) detected by Secretion assay. One representative result is shown. Percentages of (B) CD4+, CD8+ and (C) TCRαβ+ population in IL-22-secreting GAS-responsive T cells analyzed by flow cytometry. (D) Percentages of CD45RA+ and CD45RO+ in IL-22-secreting GAS-responsive CD4+ and CD8+ T cells analyzed by flow cytometry. Expression of (E) CD25, CD69, CD137, CD154 and (F) CLA on IL-22-secreting GAS-responsive T cells analyzed by flow cytometry. Each symbol represents an individual donor (mean ± SEM) (n=7-11). *P < 0.05, **P < 0.01 and ****P < 0.0001; repeated-measures (RM) one-way ANOVA with Tukey's post hoc test (A, B) or two-tailed paired t test (D, E, F). Data are representative of more than three independent experiments.
Figure 2
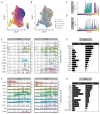
Figure 2. High frequencies of cutaneous GAS-responsive CD1a-reactive T cells found in healthy individuals.
(A) Production of IL-22 from polyclonal blood T cells detected by Secretion assay after 4-hour co-culture with control and GAS-infected K562 cells (MOI=100) in the presence of anti-CD1a or control IgG (10 µg/ml) (n=3). (B) Production of IL-22 from polyclonal blood T cells detected by Secretion assay after 4-hour co-culture with heat-inactivated GAS-infected K562 cells (n=6). (C) Secretion of IL-22 from autologous blood T cells assessed by ELISpot after 16-hour co-culture with control or GAS-infected mo-DCs or LC-like cells (MOI=20) in the presence of anti-CD1a or control IgG (10 µg/ml). Anti-HLA-A,B,C (10 µg/ml) and HLA-DR (10 µg/ml) were added to block peptide-specific T cell response. One representative result is shown of three independent experiments (n=6). (D) Production of IL-22 from polyclonal blood T cells detected by Secretion assay after 4-hour co-culture with control, GAS-, S. epidermidis-, S. mitis-, and S. pneumoniae-infected K562 cells (MOI=50) (n=7). (E) Production of IFNγ, GM-CSF, and IL-17A from polyclonal T cells detected by Secretion assay after 4-hour co-culture with control or GAS-infected K562 cells (MOI=50) (n=5-8). (F) Production of IL-22 from polyclonal skin T cells after 4-hour co-culture with control or GAS-infected K562 cells (MOI=50) detected by Secretion assay. One representative result is shown (n=5). Each symbol represents an individual donor (mean ± SEM). *P < 0.05, **P < 0.01, ***P < 0.001 and ****P < 0.0001; two-way ANOVA with Tukey's post hoc test (A, B, C, D), and repeated-measures (RM) one-way ANOVA with Tukey's post hoc test (E, F). Data are representative of three or more independent experiments.
Figure 3
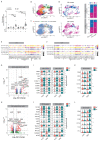
Figure 3. scRNA-seq reveals diverse functionalities of the IL-22- and IFNγ-secreting CD1a-reactive GAS-responsive T cells.
Single-cell multi-omic analysis of skin CD3+ cells after 6-hour co-culture with GAS-infected K562-CD1a cells (MOI=50) (A) UMAP plot showing unbiased clustering of the skin CD3+ cells. (B) UMAP plot with cell clusters identified based on the co-culture conditions (GAS-infected K562-CD1a (n=4) vs. unstimulated control (n=2)). Nebulosa plots showing mRNA and protein expression density of IFNγ (C) and IL-22 (D) from skin CD3+ cells. (E) Dot plots showing the gene expression signatures of IL-22- or IFNγmRNA and protein (ADT) level of the ADT-IL-22+, RNA-IL-22+, ADT-IFNγ+, RNA-IFNγ+ and IL22-IFNγ- (Neg) skin T cells. (F) UMAP plot showing the clustering relation of the CD4+ and CD8+ ADT-IL-22+, RNA-IL-22+, ADT-IFNγ+, RNA-IFNγ+ skin T cells. (G) Nebulosa plots showing gene expression density of IL-17F, IL-13, IL-10, and IL-4 from skin CD3+ cells. Dot plots showing the gene expression signatures of IL-22-producing skin CD4+ T cells (H), IFNγ-producing skin CD4+ T cells (I), and IFNγ-producing skin CD8+ T cells (J). Violin plots showing the surface marker expressions (ADT) signatures of IL-22- and IFNγ-producing skin CD4+ T cells (K), and IFNγ-producing skin CD8+ T cells (L).
Figure 4
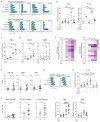
Figure 4. Pseudotime trajectory analysis depicts an effector gradient of skin T cells in response to CD1a-presentation.
(A) Trajectory visualization of skin CD3+ cells after 6-hour co-culture with GAS-infected K562-CD1a cells (MOI=50). Cells were ordered and colored according to their pseudotime on UMAP plot. (B) UMAP plot capturing pseudotime progression of skin CD3+ cells by cytokine production. Violin plots showing IL-22 (C) and IFNγ (D) mRNA expression level changed over pseudotime trajectory. Violin plots demonstrating selective differentially expressed gene (E) and surface protein (F) expression patterns of the indicated markers in skin CD4+ and CD8+ T cells changed over pseudotime trajectory in response to CD1a-GAS presentation (genes with fold change ≥ 0.5, adjusted p < 0.05). Representative motif enrichment of CDR3α from CD4+ (G) and CD8+ (H) cells located at early and late pseudotime. The percentage of clonotypes containing each motif is indicated.
Figure 5
Figure 5. Psoriatic blood T cells show hyperreactivity in response to CD1a-related presentation.
(A) Production of IL-22 from healthy (n=15) or psoriatic (n=15) polyclonal blood T cells detected by Secretion assay after 4-hour co-culture with control or GAS-infected K562 cells (MOI=50). Each symbol represents an individual (mean ± SEM). *P < 0.05, **P < 0.01 and ****P < 0.0001; two-way ANOVA with Tukey's post hoc test. Data are representative of more than three independent experiments. Single-cell multi-omic analysis of blood CD3+ cells isolated from five healthy and three individuals with psoriasis after 6-hour co-culture with unpulsed K562-CD1a (CD1a-auto) or GAS-infected K562-CD1a cells (CD1a-GAS). (B) UMAP plots showing unbiased clustering of the blood CD3+ cells. (C) UMAP plots showing the clustering of blood CD3+ cells according to the treatments (CD1a-auto, CD1a-GAS and unstimulated) (D) UMAP plots showing the clustering of IFNγ and IL-22-secreting cells (left panel) and their relative proportion within each co-culture condition (right panel). Dot plots showing the gene expression signatures of IL-22- and IFNγ-producing blood CD4+ (E) and CD8+ (F) T cells of healthy donors from CD1a-auto and CD1a-GAS treatments (selective genes with fold change ≥ 0.5, adjusted p < 0.05). Volcano plots showing differentially expressed genes in IL-22- (G) and IFNγ- (H) producing psoriatic CD4+ T cells, comparing to their healthy counterparts. The red symbols in volcano plots represent significantly upregulated or downregulated genes (fold change ≥ 0.5, adjusted p < 0.05). Only genes with ±0.25 log2 fold changes were shown on the Volcano plots. Violin plots demonstrate selective differentially expressed genes (I-J) and surface proteins (K-L) between psoriatic and healthy IL-22- and IFNγ-producing blood CD4+ T cells with indicated co-culture conditions (Genes or proteins with fold change ≥ 0.5, adjusted p < 0.05).
Figure 6
Figure 6. GAS drives the clonal expansion and activation of CD1a-reactive T cells with ability to lyse CD1a-expressing infected target cells.
(A-B) Production of IL-22 from expanded blood or skin CD1a-reactive T cell clones/lines detected by Secretion assay after 4-hour co-culture with control and GAS-infected K562 cells (MOI=50). Anti-CD1a or isotype-matched control antibody (10 µg/ml) were added to block CD1a-specific activation. Four representative results are shown (n=5-9). (C) Production of TNFα from expanded blood CD1a-reactive T cell clones/lines detected by Secretion assay after 4-hour co-culture with control and GAS-infected K562 cells (MOI=50) (n=7). (D) Secretion of granzyme A (GZMA) and granzyme B (GZMB) from expanded blood CD1a-reactive T cell clones/lines analyzed by bead-based immunoassays after 24-hour co-culture with control and GAS-infected K562 cells (MOI=50) (n=8-9). (E) Flow cytometry analysis of the killing capacity of the blood CD8+ CD1a-reactive T cell clones/lines. The percentage of apoptotic cells (Annexin V+, left panel) and percentage of killing (right panel) result graph were calculated as the fold change of each condition to the K562-EV (n=14). (F) Secretion of GM-CSF, granulysin (GNLY) and perforin (PFR) from expanded blood CD1a-reactive T cell clones/lines analyzed by bead-based immunoassays after 24-hour co-culture with control and GAS-infected K562 cells (MOI=50) (n=16-20). (G-H) Production of IL-22 from expanded blood CD1a-reactive T cell clones/lines detected by Secretion assay after 4-hour co-culture with control or LPC-pulsed K562 cells (150 µM). Anti-CD1a or isotype-matched control antibody (10 µg/ml) were added to block CD1a-specific activation. Two representative results are shown (n=9). (I) CD1a tetramer staining of CD3+ T cells in a cohort of 13 healthy controls and 17 PS patients. Percentages of indicated tetramers+ cells among all T cells analyzed by flow cytometry. Each symbol represents an individual donor (mean ± SEM). (J) Production of IFNγ from expanded blood CD1a-reactive T cell clones/lines detected by Secretion assay after 4-hour co-culture with control and GAS-infected K562 cells (MOI=50) (n=14, left panel; n=11, right panel). Each symbol represents a T cell clone/line (B, C, D, F, H, J) (mean ± SEM). *P < 0.05, **P < 0.01, ***P < 0.001 and ****P < 0.0001; two-way ANOVA with Tukey's post hoc test (B, H), repeated-measures (RM) one-way ANOVA with Tukey's post hoc test (C, D, E, J) or two-tailed paired t test (F, I). Data are representative of more than three independent experiments.
Figure 7
Figure 7. TCRs derived from GAS-responsive CD1a-autoreactive T cell clones render CD1a-lipid specificity.
(A) Representative image showing the successful replacement of the endogenous TCR with transgenic TCR expressing mouse constant region. (B) Representative image showing the purity of the expanded transgenic TCR expressing T cells. PBMCs from multiple donors were engineered and sorted per target TCR. (C) Representative images of TCR-transgenic T cells stained with mock-treated or LPC-treated CD1a tetramers. (D-F) Mean fluorescence intensity (MFI) of indicated CD1a tetramer on each TCR-transgenic T cells (n=4-8). (G) Production of intracellular Cytokine (IFNγ- or GM-CSF)-from expanded TCR-transgenic T cells analyzed by flow cytometry after 4-hour co-culture with K562 cells. Anti-CD1a or isotype-matched control antibody (10 µg/ml) were added to block CD1a-specific activation. The overall data were graphed as the fold change of each condition to the CD1a blockade condition (n=4). (H) Cytokines (IFNγ- or GM-CSF) release from TCR-transgenic T cells co-cultured with bead-bound CD1a treated with 0.25% CHAPS (mock) measured by intracellular staining and analyzed by flow cytometry after 4-hour co-culture. The overall data were graphed as the fold change to the CD1a blockade condition (n=7). (I) Cytokines (IFNγ- or GM-CSF) release from TCR-transgenic T cells co-cultured with bead-bound CD1a treated with indicated lipids measured by intracellular staining and analyzed by flow cytometry after 4-hour co-culture. The overall data were graphed as the fold change to the mock condition (n=8-10). (J) Production of intracellular Cytokine (IFNγ- or GM-CSF)-from expanded TCR-transgenic T cells analyzed by flow cytometry after 4-hour co-culture with control or GAS-infected K562 cells (n=10-13). Anti-CD1a or isotype-matched control antibody (10 µg/ml) were added to block CD1a-specific activation. Each symbol represents a T cell clone/line (mean ± SEM). *P < 0.05, **P < 0.01, ***P < 0.001 and ****P < 0.0001; two-tailed unpaired t test (D, E, F), two-tailed paired t test (H), repeated-measures (RM) one-way ANOVA with Tukey's post hoc test (G, I), or mixed-effects one-way ANOVA with Tukey's post hoc test (J). Data are representative of more than three independent experiments.
Figure 8
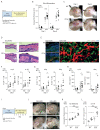
Figure 8. GAS exacerbates skin inflammation through CD1a in vivo.
(A) Schematic of GAS-induced skin inflammation. (B) Measurement of ear swelling induced by GAS-infection of wild-type (WT) and CD1a transgenic mice (CD1a) at day 1 and day 8 (n=12-14). (C) Representative images of inflammation on day 1 and 8 of the GAS-infection of WT and CD1a transgenic mice. (D) Microscopy of hematoxylin and eosin-stained cross sections of ears from mice infected with GAS for 8 days. (E) CD1a and GAS within ear skin of WT and CD1a transgenic mice 8 days after GAS infection were visualised by immunofluorescence (DAPI (blue), anti-CD1a (red) and anti-GAS (green)). (F-G) Intracellular staining analysis of T cell cytokines in draining lymph nodes from mice infected 1 day after GAS infection (n=6-7). (H) Concentrations of IL-23 and IFNγ in ear skin extracts of GAS-infected WT and CD1a transgenic mice were analyzed by bead-based immunoassays after 1-day and 8-day GAS inoculation (n=6-14). (I) Schematic of IMQ-induced skin inflammation post GAS infection. (J) Representative images of psoriasiform inflammation on day 7 of the IMQ treated WT and CD1a transgenic mice with or without prior GAS infection. (K) Day 7 measurement of ear swelling induced by IMQ treatment of wild-type (WT) and CD1a transgenic mice (CD1a) with or without prior exposure of GAS (n=6-7). (L) IL-17A-producing T cell counts per ear by intracellular staining of the IMQ treated WT and CD1a transgenic mice with or without prior GAS infection (n=6-7). Each symbol represents an individual mouse (mean ± SEM). *P < 0.05, **P < 0.01 and ****P < 0.0001; two-way ANOVA with Tukey's post hoc test (B, F, G, K, L), or two-way ANOVA with Šídák's post hoc test (H). Data are representative of more than three independent experiments.

Similar articles

Cited by

References

    1. Griffiths CEM, Armstrong AW, Gudjonsson JE, Barker J. Psoriasis. Lancet. 2021;397:1301–1315. - PubMed
    1. Whyte HJ, Baughman RD. Acute Guttate Psoriasis and Streptococcal Infection. Arch Dermatol. 1964;89:350–356. - PubMed
    1. Leung DY, Travers JB, Giorno R, Norris DA, Skinner R, Aelion J, Kazemi LV, Kim MH, Trumble AE, Kotb M, et al. Evidence for a streptococcal superantigen-driven process in acute guttate psoriasis. J Clin Invest. 1995;96:2106–2112. - PMC - PubMed
    1. Gudjonsson JE, Thorarinsson AM, Sigurgeirsson B, Kristinsson KG, Valdimarsson H. Streptococcal throat infections and exacerbation of chronic plaque psoriasis: a prospective study. Br J Dermatol. 2003;149:530–534. - PubMed
    1. Thorleifsdottir RH, Eysteinsdottir JH, Olafsson JH, Sigurdsson MI, Johnston A, Valdimarsson H, Sigurgeirsson B. Throat Infections are Associated with Exacerbation in a Substantial Proportion of Patients with Chronic Plaque Psoriasis. Acta Derm Venereol. 2016;96:788–791. - PMC - PubMed

Publication types