. 2023 Jun 1;83(11):1903-1920.e12.
doi: 10.1016/j.molcel.2023.05.008.

Irisin acts through its integrin receptor in a two-step process involving extracellular Hsp90α

Affiliations

Irisin acts through its integrin receptor in a two-step process involving extracellular Hsp90α

Mu A et al. Mol Cell. .

Abstract

Exercise benefits the human body in many ways. Irisin is secreted by muscle, increased with exercise, and conveys physiological benefits, including improved cognition and resistance to neurodegeneration. Irisin acts via αV integrins; however, a mechanistic understanding of how small polypeptides like irisin can signal through integrins is poorly understood. Using mass spectrometry and cryo-EM, we demonstrate that the extracellular heat shock protein 90α (eHsp90α) is secreted by muscle with exercise and activates integrin αVβ5. This allows for high-affinity irisin binding and signaling through an Hsp90α/αV/β5 complex. By including hydrogen/deuterium exchange data, we generate and experimentally validate a 2.98 Å RMSD irisin/αVβ5 complex docking model. Irisin binds very tightly to an alternative interface on αVβ5 distinct from that used by known ligands. These data elucidate a non-canonical mechanism by which a small polypeptide hormone like irisin can function through an integrin receptor.

Keywords: HDX-MS; RGD motif; exercise; extracellular Hsp90; fibronectin III domain; integrin; integrin activation; irisin; ligand binding; protein-protein docking.


Conflict of interest statement

Declaration of interests B.M.S. holds several issued patents on irisin. B.M.S. is an academic co-founder of Aevum Therapeutics, which is attempting to develop irisin as a therapeutic. M.A. is a consultant to Aevum Therapeutics.

Figures

Figure 1:
Figure 1:. eHsp90α is required for irisin binding to integrin αVβ5.
(A) Schematic of the construct for recombinant human αVβ5 ectodomain protein production from mammalian cells. The domain boundaries are as follows: αV, 32–991; β5, 24–717. (B) and (D) Biolayerinferometry (BLI) measurement of binding of irisin to αVβ5. Purified irisin-His at the indicated concentration was infused over a sensor chip with immobilized clasped αVβ5 in the presence of 1 mM MgCl2 and 1 mM CaCl2. (C) Silver-stained SDS-polyacrylamide gel electrophoresis (SDS-PAGE) of affinity-purified αVβ5 fractions 7–20 collected following ion exchange. (E) A protein-elution profile of the indicated protein complexes from Superdex 200 increase 30/100 GL (optical density (OD)280). (F) Coomassie-stained SDS-PAGE and western blot with the indicated antibodies of the deglycosylated recombinant human Hsp90α and peak fractions from (E). (G) Fluorescence anisotropy measurement of binding of αVβ5 and the αVβ5/Hsp90α complex to 50 nM A488-irisin-His in the presence of 1 mM MgCl2 and 1 mM CaCl2. (H) Fluorescence anisotropy competition assay for the αVβ5/Hsp90α complex binding by irisin: 50 nM A488-irisin-His and 125 nM αVβ5 were mixed with varying concentrations of unlabeled irisin or irisin-His, and anisotropy was recorded. Probe alone: 50 nM A488-irisin-His.
Figure 2:
Figure 2:. eHsp90αlevel is increased with exercise in muscle extracellular fluid and in plasma.
(A) Schematic of acute exercise and IF isolation procedure and processing. (B) Anti-Hsp90αwestern blot showing Hsp90α protein levels in IF samples taken from the mouse without acute exercise (basal), or from the mice rested for the indicated amounts of time after acute exercise. 10 μg of total IF protein was loaded for each sample as shown by Ponceau staining. (C) Anti-Hsp90α western blot showing Hsp90α protein levels in gastrocnemius muscle samples taken from the mouse without acute exercise (basal), or from the mice rested for the indicated amounts of time after acute exercise. 10 μg of total muscle protein was loaded for each sample as shown by Ponceau staining. (D) Anti-Hsp90αwestern blot showing Hsp90α protein levels in plasma samples taken from the same group of mice from (C). 10 μg of total plasma protein was loaded for each sample as shown by Ponceau staining. (E) Anti-Hsp90α and anti-HspA14 (control) western blot showing Hsp90α and HspA14 protein levels in plasma samples taken from five mice pre-exercise and post-exercise (1 hr). 10 μg of total plasma protein was loaded for each sample as shown by Ponceau staining. (F) Quantitative mass spectrometry showing the fold of changes of the indicated chaperone proteins identified in the IF samples from the exercised mice (1 hr post acute exercise) compared to the sedentary group (significant if FDR q-value < 0.05).q-values of the significantly upregulated genes are indicated in the bar graph.
Figure 3:
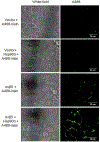
Figure 3:. eHsp90α is required for optimal cellular actions of irisin.
(A) Fluorescence confocal images showing A488-irisin binding in HEK293T cells. HEK293T cells were either transiently transfected with control vector or full-length αV and β5 plasmids. 2 nM Hsp90α was used for 1 hr pretreatment, and 2 nM A488-irisin-His was subsequently used for 5 min treatment. Scale bar: 20 μm. (B) Anti-phosphorylated FAK (Y397) and anti-FAK western blots showing the levels of integrin signaling upon irisin and/or Hsp90α treatments. HEK293T cells were transfected and treated in the same way as (A), except for the addition of the shown amounts of unlabeled irisin-His (0.1 nM or 1 nM) and Hsp90α (1 nM). Anti-αV and anti-β5 antibodies were used to probe the levels of the ectopically expressed αV and β5. (C) Immunofluorescence confocal images showing cell surface Hsp90α in SK-Mel2 cells. Live cells were treated with either control IgG or anti-Hsp90α at 4°C. Scale bar: 50 μm. (D) Quantification of the percentage of SK-Mel2 cells expressing cell surface Hsp90α in (C) (significant if p-value < 0.05 by unpaired t-test). (E) Fluorescence confocal images showing A647-irisin binding in SK-Mel2 cells. Live cells were pretreated with either control IgG or anti-Hsp90α at 4°C for 1 hr followed by 2 nM A647-irisin-His treatment at room temperature for 5 min. Scale bar: 50 μm. (F) Quantification of the percentage of A647-positive cells in (E) (significant if p-value < 0.05 by unpaired t-test). (G) Co-immunoprecipitation assay of endogenous cell surface αV and β5 using SK-Mel2 cells. Endogenous cell surface Hsp90α was captured by anti-Hsp90α in live cells at 4°C. (H) Crystal violet assay showing does-dependent inhibition of the cell viability of SK-Mel2 upon irisin treatment. Grey bar: control treatment with PBS. Concentrations of irisin-His used for the treatments were indicated (one-way ANOVA). (I) Crystal violet assay showing the inhibition of irisin-mediated effect in SK-Mel2 cells by anti-Hsp90α or control antibody. Grey bar: control treatment with PBS. 50 ng/mL of irisin-His was used (one-way ANOVA). (J) Western blot of mouse inguinal fat tissue lysates using the indicated antibodies to probe integrin signaling. Mice were given anti-Hsp90α antibody or control IgG (500 μg/kg) subcutaneously 24 hrs before a bolus injection of recombinant irisin (5 mg/kg) directly into the inguinal fat pads. The mice were sacrificed and inguinal fat tissues were harvested 20 min after irisin injection.
Figure 4:
Figure 4:. Hsp90α activates αVβ5 for irisin binding.
(A) Flow charts of the steps used in three different methods for analyzing αVβ5-Apo and αVβ5/Hsp90α cryo-EM samples. (B) 2D classes (generated by method 1) of αVβ5 particles in each of the three conformational states and the numbers (quantified by all three methods) of particles in each state. (C) Quantification of the percentage of distinguished particles (“likely open” particles were not included) in each of the three conformational states. (D) Fluorescence anisotropy assay for A488-irisin binding by αVβ5, the αVβ5/Hsp90α complex in the presence of 1 mM MgCl2 and 1 mM CaCl2, or αVβ5 in the presence of 1 mM MnCl2. 50 nM A488-irisin-His was used in the assay. (E) Cartoon diagram showing a two-step process of the irisin action through αVβ5. Irisin alone has low affinity for the closed-state αVβ5. Hsp90α, Mn2+ ion, or other possible factors, “opens” αVβ5, allowing for high-affinity irisin binding and effective signaling transduction through its integrin receptor. (F) and (G) TALON pull-downs performed using 1 μM bead-bound clasped and tagged αVβ5. These were mixed with 2 μM untagged Hsp90α without bound nucleotide (Hsp90α-Apo) or Hsp90α charged with the indicated nucleotides (F), or Hsp90α nonhydrolyzing mutant (G95D) (G), and bound samples were analyzed by Coomassie staining and anti-Hsp90α western blot.
Figure 5:
Figure 5:. Biophysical characterization of the irisin/αVβ5 complex suggests an unconventional ligand-integrin interaction.
(A) MicroScale Thermophoresis (MST) measurement of the binding stoichiometry between A488-irisin-His and αVβ5 in the presence of 1 mM MnCl2. MST responses were recorded at varying irisin: αVβ5 ratios with the total molar concentration of irisin plus αVβ5 constant (10 μM). (B) Size-exclusion chromatography and multiangle light scattering (SEC-MALS) determination of the absolute protein and glycan molecular mass of irisin-mam. 100 μg irisin-His was used in the assay. LS: light scattering; Total: total molecular mass of glycosylated irisin; Protein: molecular mass of the irisin protein; Glycan: molecular mass of the glycan. (C) Hydrogen/Deuterium exchange mass spectrometry (HDX-MS) mapping of the protected sites on αVβ5 in the irisin/αVβ5 complex. The measured relative deuterium level of peptides in αVβ5-Apo at each deuteration time point was subtracted from the deuterium level of the corresponding peptide in the irisin/αVβ5 complex (Dcplx - Dapo), and the differences were colored according to the scale shown at the bottom. Peptides are shown from N- to C-terminus top to bottom, referring to the domain architecture on the left. The amount of time in deuterium is shown at the bottom. All deuterium uptake values used to generate these difference maps can be found in the Data S1. (D) Regions of αVβ5 protected from HDX in the irisin/αVβ5 complex (orange) on αVβ5 space filling structural model based on (C). αVβ5 structural model was generated from αVβ3 (PDB 1M1X) with β5 predicted by AlphaFold. αV subunit is in grey, and β5 subunit is in wheat.
Figure 6:
Figure 6:. Docking model of the irisin/αVβ5 complex.
(A) Schematic of the irisin/αVβ5 complex modeling. Experimental results (red) were incorporated into the procedure in the indicated steps. (B) Space filling structural model of the irisin/αVβ5 complex. αV subunit is in beige, β5 subunit is in grey, and irisin is in magenta. The N- and C-terminus of irisin are highlighted in yellow and green, respectively. (C) Space filling structural model of the irisin/FN10/αVβ5 complex. αV subunit is in beige, β5 subunit is in grey, irisin is in magenta, and FN10 is in yellow. FN10-αVβ3 complex structure (PDB 4MMX) was used for fibronectin alignment to dock FN10 onto αVβ5. (D) Electrostatic potential surfaces of irisin (top) and αVβ5 (bottom). The surface charge distribution is displayed as blue for basic/positive, red for acidic/negative, and white for neutral. One acidic amino acid-rich region (A) and one basic amino acid-rich region (B) were shown on both irisin and αVβ5 at the interface. (E) Irisin-αVβ5 interactions in the irisin/αVβ5 complex model. Electrostatic interactions are in dashed lines between the atoms involved. The hydrophobic interactions are represented by arcs with spokes radiating towards the ligand atoms they contact, and the contacted atoms are shown with spokes radiating back.
Figure 7:
Figure 7:. Validation of the irisin/αVβ5 complex model.
(A) Fluorescence anisotropy assay for A488-FN10 binding by αVβ5 in the presence of 1 mM MnCl2. 50 nM A488-FN10 was used in the assay. (B) Fluorescence anisotropy competition assay for the αVβ5 binding by irisin or FN10: 50 nM A488-FN10 and 500 nM αVβ5 were mixed with varying concentrations of unlabeled irisin-His or FN10, and anisotropy was recorded. Probe alone: 50 nM A488-FN10. (C) Fluorescence resonance energy transfer (FRET) assay using 50 nM A488-FN10 and 50 nM unlabeled or A555 labeled irisin-His in the presence or absence of 500 nM αVβ5. FRET efficiency was calculated as the ratio of F555/(F488+F555) where F555 is the acceptor emission and F488 is the donor emission (one-way ANOVA). (D) Fluorescence anisotropy assay for A488-irisin-bac binding by αVβ5 in the presence of 1 mM MnCl2. (E) Fluorescence anisotropy competition assay for the αVβ5 binding by irisin-mam or irisin-bac: 50 nM A488-irisin-bac and 1000 nM αVβ5 were mixed with varying concentrations of unlabeled irisin-mam (irisin-His) or irisin-bac, and anisotropy was recorded. Probe alone: 50 nM A488-irisin-bac. (F) Fluorescence anisotropy competition assay for the αVβ5 binding by irisin-WT or irisin-R75E: 50 nM A488-irisin-WT and 1000 nM αVβ5 were mixed with varying concentrations of unlabeled irisin-WT or irisin-R75E, and anisotropy was recorded. Probe alone: 50 nM A488-irisin-WT. (G) Fluorescence anisotropy assay for A488-irisin binding by αVβ5 WT and indicated mutants (mutated residues are indicated in the space-filling model on the left) in the presence of 1 mM MnCl2.

Comment in

References

    1. Myers J, Prakash M, Froelicher V, Do D, Partington S, and Atwood JE (2002). Exercise capacity and mortality among men referred for exercise testing. N Engl J Med 346, 793–801. 10.1056/NEJMoa011858. - DOI - PubMed
    1. Fernandez-Marcos PJ, and Auwerx J (2011). Regulation of PGC-1alpha, a nodal regulator of mitochondrial biogenesis. Am J Clin Nutr 93, 884S–890. 10.3945/ajcn.110.001917. - DOI - PMC - PubMed
    1. Puigserver P, Wu Z, Park CW, Graves R, Wright M, and Spiegelman BM (1998). A cold-inducible coactivator of nuclear receptors linked to adaptive thermogenesis. Cell 92, 829–839. 10.1016/s0092-8674(00)81410-5. - DOI - PubMed
    1. Reutzel M, Grewal R, Dilberger B, Silaidos C, Joppe A, and Eckert GP (2020). Cerebral Mitochondrial Function and Cognitive Performance during Aging: A Longitudinal Study in NMRI Mice. Oxid Med Cell Longev 2020, 4060769. 10.1155/2020/4060769. - DOI - PMC - PubMed
    1. Uldry M, Yang W, St-Pierre J, Lin J, Seale P, and Spiegelman BM (2006). Complementary action of the PGC-1 coactivators in mitochondrial biogenesis and brown fat differentiation. Cell Metab 3, 333–341. 10.1016/j.cmet.2006.04.002. - DOI - PubMed

Publication types