. 2023 Jun 1;30(6):781-799.e9.
doi: 10.1016/j.stem.2023.05.004.

Loss of TET2 in human hematopoietic stem cells alters the development and function of neutrophils

Affiliations

Loss of TET2 in human hematopoietic stem cells alters the development and function of neutrophils

Hector Huerga Encabo et al. Cell Stem Cell. .

Abstract

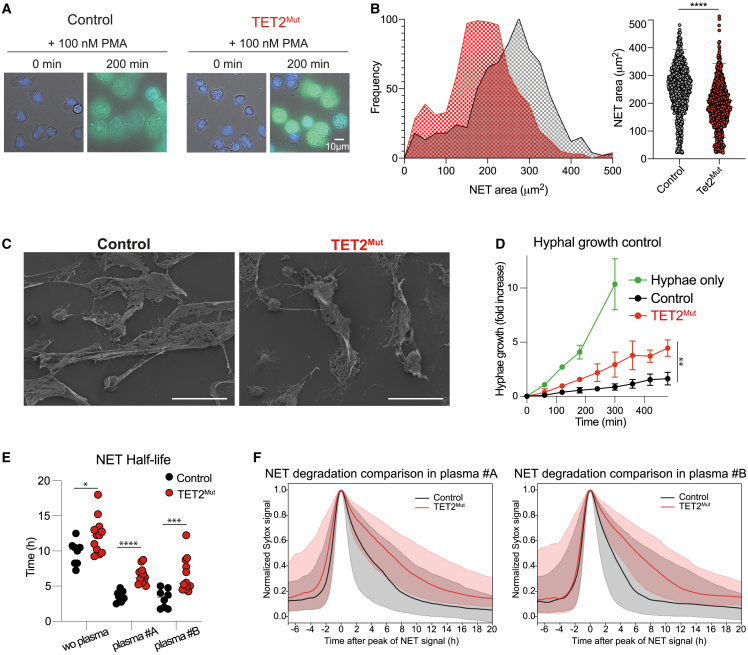
Somatic mutations commonly occur in hematopoietic stem cells (HSCs). Some mutant clones outgrow through clonal hematopoiesis (CH) and produce mutated immune progenies shaping host immunity. Individuals with CH are asymptomatic but have an increased risk of developing leukemia, cardiovascular and pulmonary inflammatory diseases, and severe infections. Using genetic engineering of human HSCs (hHSCs) and transplantation in immunodeficient mice, we describe how a commonly mutated gene in CH, TET2, affects human neutrophil development and function. TET2 loss in hHSCs produce a distinct neutrophil heterogeneity in bone marrow and peripheral tissues by increasing the repopulating capacity of neutrophil progenitors and giving rise to low-granule neutrophils. Human neutrophils that inherited TET2 mutations mount exacerbated inflammatory responses and have more condensed chromatin, which correlates with compact neutrophil extracellular trap (NET) production. We expose here physiological abnormalities that may inform future strategies to detect TET2-CH and prevent NET-mediated pathologies associated with CH.

Keywords: CRISPR; TET2; clonal hematopoiesis; hematopoietic stem and progenitor cells; immune system; preleukemic neutrophil.


Conflict of interest statement

Declaration of interests The authors declare no competing interests.

Figures

None
Graphical abstract
Figure 1
Figure 1
Identification of human neutrophil heterogeneity derived from TET2Mut hHSPCs in bone marrow and peripheral tissues of humanized mice (A) Schematic representation of the design to study the impact of TET2 loss in hHSPCs in the reconstitution of the human immune system in different tissues of NSG mice. Created with BioRender. (B) Uniform manifold approximation and projection (UMAP) dimensionality reduction of human hematopoietic cells isolated from bone marrow of mice engrafted with wild-type human HSCs (hHSPCs). 1.3 million cells are represented into 21 clusters. (C) Frequencies of the 21 clusters identified in the bone marrow of mice reconstituted with wild-type (black bars) or TET2 mutant (red bars) hHSPC (data showing mean and SD from 3 biological replicates). Two-way ANOVA test used for significance, p < 0.05; ∗∗p < 0.01; ∗∗∗p < 0.005; ∗∗∗∗p < 0.001. (D) Single-cell expression of CD66b used to define clusters containing granulocytes. See Figure S1A. Clusters 0, 3, 5, and 15 were selected for downstream analysis of neutrophil heterogeneity. (E) UMAP dimensionality reduction of 365 thousand cells to define the 5 neutrophil subsets (labeled as N1–N5). (F) Single-cell expression of progenitor markers CD117 and CD49d and maturation markers CD16 and CD11b. (G) Pseudo-time trajectory to determine the neutrophil development across N1–N5 subsets. A sub-setting of 500 cells per cluster was obtained to perform the pseudo-time analysis. (H) Comparison of the neutrophil heterogeneity in the bone marrow derived from control (148,464 cells) and TET2 mutant (152,708) hHSPCs by UMAP and pie-chart representing the percentage of each subset. (I) Frequencies of N1–N3 neutrophils and N4–N5 neutrophils in the bone marrow of mice reconstituted with wild-type (black dots) or TET2 mutant (red dots) hHSPC (each dot represents one biological replicate). n = 3 mice. Two-way ANOVA test used for significance, p < 0.05; ∗∗p < 0.01; ∗∗∗p < 0.005; ∗∗∗∗p < 0.001.
Figure 2
Figure 2
Neutrophils derived from TET2Mut hHSPCs have reduced granule complexity (A) Percentage of CD66b+CD15+CD16high cells within human hematopoietic system in bone marrow, blood, and lung of mice engrafted with control (black) or TET2Mut (red) hHSPCs (n = 6 mice, data representative of 3 independent experiments, each performed with hHSPCs from different human donors). Each dot represents one humanized mouse and error bars: mean ± SEM. Unpaired t test used for significance, p < 0.05; ∗∗p < 0.01. (B) Representative side-scatter plots of mature neutrophils and quantification of side-scatter area (a.u., arbitrary units acquired from the analyzer). n = 6 mice, data representative of 3 independent experiments, each performed with hHSPCs from different human donors. Each dot represents one humanized mouse and error bars: mean ± SEM. Unpaired t test used for significance, p < 0.05; ∗∗p < 0.01. (C and D) Representative transmission electron microscopy (TEM) images of DAB-stained mature neutrophils sorted from bone marrow of humanized mice as indicated in (A). Red arrows show examples of primary (DAB-positive) granules, yellow stars secondary/tertiary (DAB-negative) granules. Scale bars, 2 μm. (D) Quantification of primary and secondary/tertiary granules. Data from 3 mice engrafted with control (gray) and 3 mice engrafted TET2Mut (red/pink) HSPCs, at least 10 cells from each humanized mouse were analyzed (control n = 37, TET2Mut = 40). Violin plots showing median and quartiles. One-way ANOVA test used for significance, ∗∗∗p < 0.001; ∗∗∗∗p < 0.0001. (E) Mean fluorescent intensity (MFI) of CD63 in mature neutrophils (a.u., arbitrary units, raw data from the analyzer). Data from 1 experiment (control n = 6, TET2Mut = 4). Each dot represents one humanized mouse and error bars: mean ± SEM. (F and G) Immunocytochemistry staining of MPO and neutrophil elastase (NE) in control and TET2Mut neutrophils. Fire lookup table, scale bars, 10 μm. (G) Quantification of signal per cell n = 3–4 mice per group. Violin plots showing median and quartiles. Unpaired t test used for significance. (H and I) Schema (H) and flow gating strategy (I) to identify human neutrophils in chimeric mice engrafted with a 1:1 mix with control (black) or TET2Mut (red) hHSCs. Schema created with BioRender. (J) Percentage (right panel), SSC (center) and CD63-MFI (right) of control or TET2Mut neutrophils within the same chimeric mouse. n = 6 mice, data representative of 3 experiments (CD63-MFI was evaluated in 1 chimeric mice experiment). Paired t test was used for significance, ns, no-significance, p < 0.05, ∗∗p < 0.01.
Figure 3
Figure 3
TET2Mut neutrophils are characterized by distinctive epigenome, chromatin architecture, and transcriptome signatures (A) RNA-sequencing principal component analysis of control and TET2Mut sorted neutrophils (CD66b+CD15+CD16high) (n = 4 mice). (B) Volcano plot showing significantly (p value adjusted < 0.05) downregulated (blue dots) or upregulated (red dots) genes in TET2Mut neutrophils. See Table S2. (C) Heatmap representing the expression of genes associated with primary, secondary, and tertiary granule formation. The expression of these genes in our control and TET2Mut neutrophils was compared with the expression in the different neutrophil subsets identified in GSE109467. (D) Volcano plot of differentially methylated CpG bases. Orange colored dots indicate adjusted p value < 0.05. (E) Bar plot showing the distribution of the differentially methylated regions across the chromosomes. (F) Distribution of the differentially methylated regions according to their location in promoter, exon, intron, or intergenic regions. See Table S3. (G) ATAC-seq schematic representation of the distinguishable closed and open chromatin regions. For this experiment we used and compared control and TET2Mut neutrophils sorted from the same mouse engrafted with a mix of wild-type and TET2-mutant hHSPCs. (H) Comparison of the percentage of large chromatin fragments (>300 bp) between control and TET2Mut neutrophils from the same mouse. Paired t test used for significance, p < 0.05. See Table S3. (I) Comparison of annotated peaks between control and TET2Mut neutrophils from the same mouse. Paired t test used for significance, p < 0.05. See Table S3. (J) Venn diagram showing that 226 gene promoter regions were found both hypermethylated and less accessible in the differential accessible peak (DAP) analysis. These promoter regions were enriched in binding motifs associated with E2F, KLF3, or SP1 transcription factors. See Table S3. (K) Overlap of differentially expressed genes identified in the RNA-seq analysis and genes containing differentially methylated promoter identified in the methylome sequencing. Numbers in the corners indicate the number of genes differentially regulated and containing hypermethylated CpG sites in the promoters. See Table S3. (L) Selection of differentially regulated pathways in reactome using the genes containing hypermethylated CpGs in the promoters that were upregulated (in red) or downregulated (blue) in the RNA-seq. See Table S3 for complete list of pathways.
Figure 4
Figure 4
TET2 mutations alter the transcriptome of different neutrophil developmental stages and increase neutrophil progenitor potential (A) Representative sorting strategy to isolate from bone marrow human CD45+ cells: preNeu (CD66b+CD16CD117+CD49d+), immNeu (CD66b+CD16midCD117CD49d), and matNeu (CD66b+CD16highCD117+CD49d+). (B) RNA-sequencing principal component analysis of the different neutrophil populations from mice reconstituted with control and TET2Mut hHSPCs (n = 4 mice.). (C) Gene-set enrichment analysis using Hallmark database for the different comparisons displayed in the columns. See Table S4. (D) Scatterplots comparing the fold changes of genes with adjusted p values of ≤0.05 in the preNeu vs. immNeu (y axis) comparison with the fold changes of genes with adjusted p values of ≤0.05 that appear downregulated (blue) or upregulated (red) in TET2Mut immNeu (x axis). (E–G) Representative density plots from the secondary recipient mice engrafted with control or TET2Mut neutrophil progenitors (E). Number of human CD45 cells (F) and percentage of CD66b+CD16+ (G) in reconstituted secondary recipient mice. Each dot represents one secondary recipient mouse. 3 secondary recipient mice per group, each received the neutrophil progenitors from different primary humanized mouse, and error bars: mean ± SEM. Unpaired t test used for significance, p < 0.05.
Figure 5
Figure 5
TET2Mut neutrophils show exacerbated inflammation and recruitment to sites of infection (A and B) Percentage of control or TET2Mut human neutrophils undergoing phagocytosis of zymosan 488 beads (A) or yeast C. albicans (B) (n = 4–5 per group, representative of 3 independent experiments). Mann-Whitney statistical test used for significance, p < 0.05. (C) Gene-set enrichment analysis (GSEA) showing upregulation of inflammatory response pathway using the Hallmark database. See Table S5 for complete list of pathways. (D) Heatmap of selected genes differentially expressed (p value < 0.05) in TET2Mut neutrophils after LPS stimulation (3 h, 1 μg/mL). See Table S5 for complete list of differentially expressed genes. (E) Immunohistochemistry image of a lung section from a mouse engrafted with control hHSPCs challenged with PBS (top row) or LPS (bottom row) intranasally. Overview of a control lung section (left) with DAPI (blue) and MPO (magenta) staining, scale bars, 100 μm. Magnification of a region of interest of the lung with DAPI (blue), human CD45 (green), MPO (magenta), and cells containing CD45 and MPO signal (white) scale bars, 50 μm. (F) Quantification of percentage of neutrophil infiltration (%MPO+ cells) normalized to the total number of cells in the tissue. Each dot represents a lung section. 3–4 sections were used per lung (n = 3–4 mice in LPS group and n = 2–3 mice in PBS group). Mann-Whitney test used for significance. (G) Confocal immunohistochemistry images of a lung section from a mouse engrafted with control hHSPCs challenged with C. albicans showing human CD45+ MPO+ neutrophils attached to a C. albicans hyphae and phagocytosing a C. albicans yeast with MPO colocalized. DAPI (blue), hCD45 (cyan), C. albicans (magenta), and MPO (yellow). Scale bars, 20 and 5 μm. (H) Quantification of the percentage of Candida albicans signal over the total lung area in control and TET2Mut mice. Mean of 2–3 sections per mouse, unpaired t test used for significance.
Figure 6
Figure 6
NETs produced by neutrophils derived from TET2Mut HSCs are more compact and difficult to be degraded (A) Representative magnification images of wide-field fluorescence microscopy from time-lapse imaging of PMA-stimulated control and TET2Mut neutrophils at time point 0 and 200 min. Nucleus are stained with DAPI and NETs are stained with sytox green. Scale bars, 10 μm. (B) Frequency versus NET area plot displaying the distribution of NET areas of control and TET2Mut neutrophils quantified at time point 200 min (left panel). Distribution of NET area of individual cells in control (gray) and TET2Mut (red) neutrophils (right panel). n = 3 per group, representative of 4 independent experiments. Mann-Whitney statistical test used for significance, ∗∗∗∗p < 0.0001. (C) Scanning electron microscopy images of NETs formed upon 100 nM PMA stimulation from control or TET2Mut neutrophils. Scale bars, 30 μm. (D) Hyphal growth fold increase over time of C. albicans hyphae only (green line), hyphae co-cultured with control neutrophils (black line), and TET2Mut neutrophils (red line). n = 3 per group, Wilcoxon matched pair signed rank test, p < 0.05; ∗∗p < 0.01. (E) NET half-life values from NET traces obtained by gathering the signal over time of 1,000 randomly sampled pixels previously classified as NET by the pixROI method, median traces were calculated, and the half-life values of the median traces per field of view corresponding with the traces shown in Figure S6H and (F). Mann-Whitney statistical analysis, p < 0.05; ∗∗p < 0.01; ∗∗∗p < 0.001; ∗∗∗∗p < 0.0001. (F) Comparison of NET degradation profiles for control and TET2Mut neutrophils in the presence of different human plasma. Median curves (solid lines) of netotic pixel signals aligned and normalized to their peak as classified by the pixROI method. Shaded regions are bounded by the Q1 and Q3 curves corresponding to the 25% and 75% quartiles. The specific times in plasma #A (left panel) were 210 min (Q1 = 75 min; Q3 = 495 min) for the control NETs and 390 min (Q1 = 180 min; Q3 = 735 min) for the TET2Mut NETs; and for plasma #B (right panel) were 195 min (Q1 = 90 min; Q3 = 525 min) for the control NETs and 390 min (Q1 = 225 min; Q3 = 690 min) for the TET2Mut NETs. The curves are computed on signals gathering 1,000 randomly sampled pixels for all videos corresponding to the mouse type and experimental condition.
Figure 7
Figure 7
TET2-derived human clonal hematopoiesis is associated with the appearance of low-granule neutrophils (A) Overlayed heatmap into the hematopoietic tree showing the fold expansion of TET2 mutations from HSCs. The following cell populations were analyzed (HSCs, MPP, CLP, CMP, GMP, B cells, monocytes, and HG and LN neutrophils). Data representative of 4 humanized mice. See Figure S7A for sorting strategy and Figure S7B for raw data of VAF for each cell population in each humanized mice. (B) Comparison of the VAF between HSC and MPP (left panel), high granule (HG) neutrophils(center), and low-granule (LG) neutrophils (right). Each line of connected dots represents one humanized mouse. Paired t test used for significance, p < 0.05. (C–E) Percentage of TET2 mutations in different immune cell populations from bone marrow (C), blood (D), and lung (E). Monocytes (M), B cells (B), high granule (HG) neutrophils, and low-granule (LG) neutrophils were sorted from 4 humanized mice engrafted with hHSCs from different human donors, each line of connected dots represents one mouse. Two-way ANOVA test used for significance, p < 0.05; ∗∗p < 0.01; ∗∗∗∗p < 0.001. (F) UCLH cohort consisted of BM aspirates for routine diagnostic purposes at University College London Hospitals (UCLH). 22 patients with hematological disorder diagnosed were identified with mutations of TET2 but who had no other mutations. (G) Correlation between the median side scatter (SSC) of bone marrow mature neutrophils and the TET2 variant allele frequency (VAF) of these 22 patients (left panel) or the correlation for the patients with less than 50% TET2 VAF (right panel). See Figure S7C for gating strategy. Significant correlation was measured by linear regression analysis. (H) Correlation between the percentage of bone marrow mature neutrophils within total BM cells (left panel) or within the myeloid compartment (right panel) and the TET2 variant allele frequency (VAF) of these 22 patients. See Figure S7C. Significant correlation was measured by linear regression analysis. (I) Manchester cohort consisted of peripheral blood samples from CMML patients (n = 12) or healthy volunteers (n = 12) obtained from the Manchester Cancer Research Centre Tissue Biobank. (J) Side-scatter of neutrophils isolated by immunomagnetic negative isolation from peripheral blood of healthy volunteers or CMML patients. See Figure S7D. (K) Percentage of the immature neutrophil fraction (CD66b+CD16−/low) within the neutrophil population isolated from peripheral blood. See Figure S7D.

References

    1. Dancey J.T., Deubelbeiss K.A., Harker L.A., Finch C.A. Neutrophil kinetics in man. J. Clin. Invest. 1976;58:705–715. doi: 10.1172/JCI108517. - DOI - PMC - PubMed
    1. Dinh H.Q., Eggert T., Meyer M.A., Zhu Y.P., Olingy C.E., Llewellyn R., Wu R., Hedrick C.C. Coexpression of CD71 and CD117 identifies an early unipotent neutrophil progenitor population in human bone marrow. Immunity. 2020;53 doi: 10.1016/j.immuni.2020.07.017. 319.e6–334.e6. - DOI - PMC - PubMed
    1. Zhu Y.P., Padgett L., Dinh H.Q., Marcovecchio P., Blatchley A., Wu R., Ehinger E., Kim C., Mikulski Z., Seumois G., et al. Identification of an early unipotent neutrophil progenitor with pro-tumoral activity in mouse and human bone marrow. Cell Rep. 2018;24 doi: 10.1016/j.celrep.2018.07.097. 2329.e8–2341.e8. - DOI - PMC - PubMed
    1. Ng L.G., Ostuni R., Hidalgo A. Heterogeneity of neutrophils. Nat. Rev. Immunol. 2019;19:255–265. doi: 10.1038/s41577-019-0141-8. - DOI - PubMed
    1. Evrard M., Kwok I.W.H., Chong S.Z., Teng K.W.W., Becht E., Chen J., Sieow J.L., Penny H.L., Ching G.C., Devi S., et al. Developmental analysis of bone marrow neutrophils reveals populations specialized in expansion, trafficking, and effector functions. Immunity. 2018;48 doi: 10.1016/j.immuni.2018.02.002. 364.e8–379.e8. - DOI - PubMed

Publication types