. 2023 Jun 1;30(6):885-903.e10.
doi: 10.1016/j.stem.2023.05.001.

Transcriptional space-time mapping identifies concerted immune and stromal cell patterns and gene programs in wound healing and cancer

Affiliations

Transcriptional space-time mapping identifies concerted immune and stromal cell patterns and gene programs in wound healing and cancer

Kenneth H Hu et al. Cell Stem Cell. .

Abstract

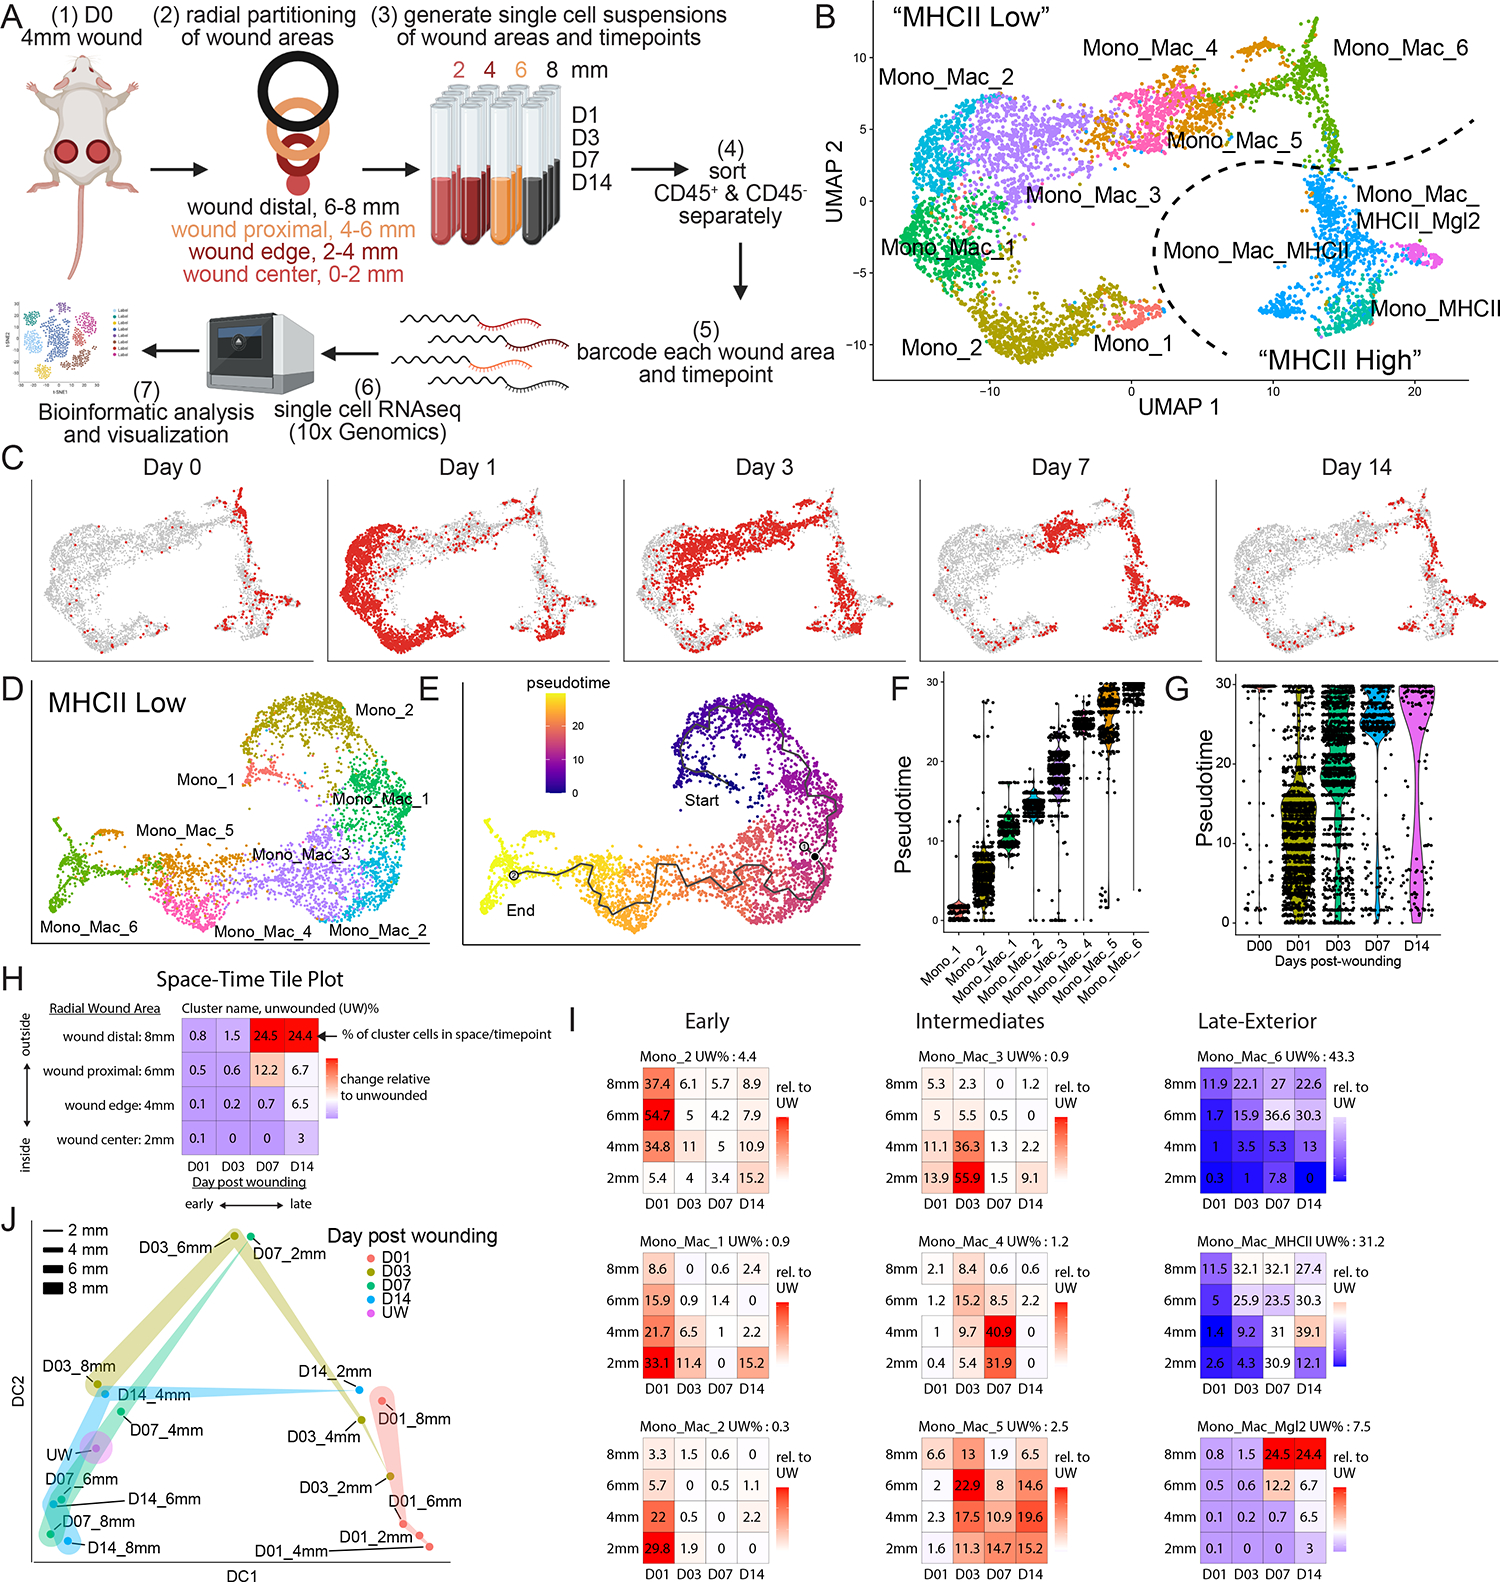
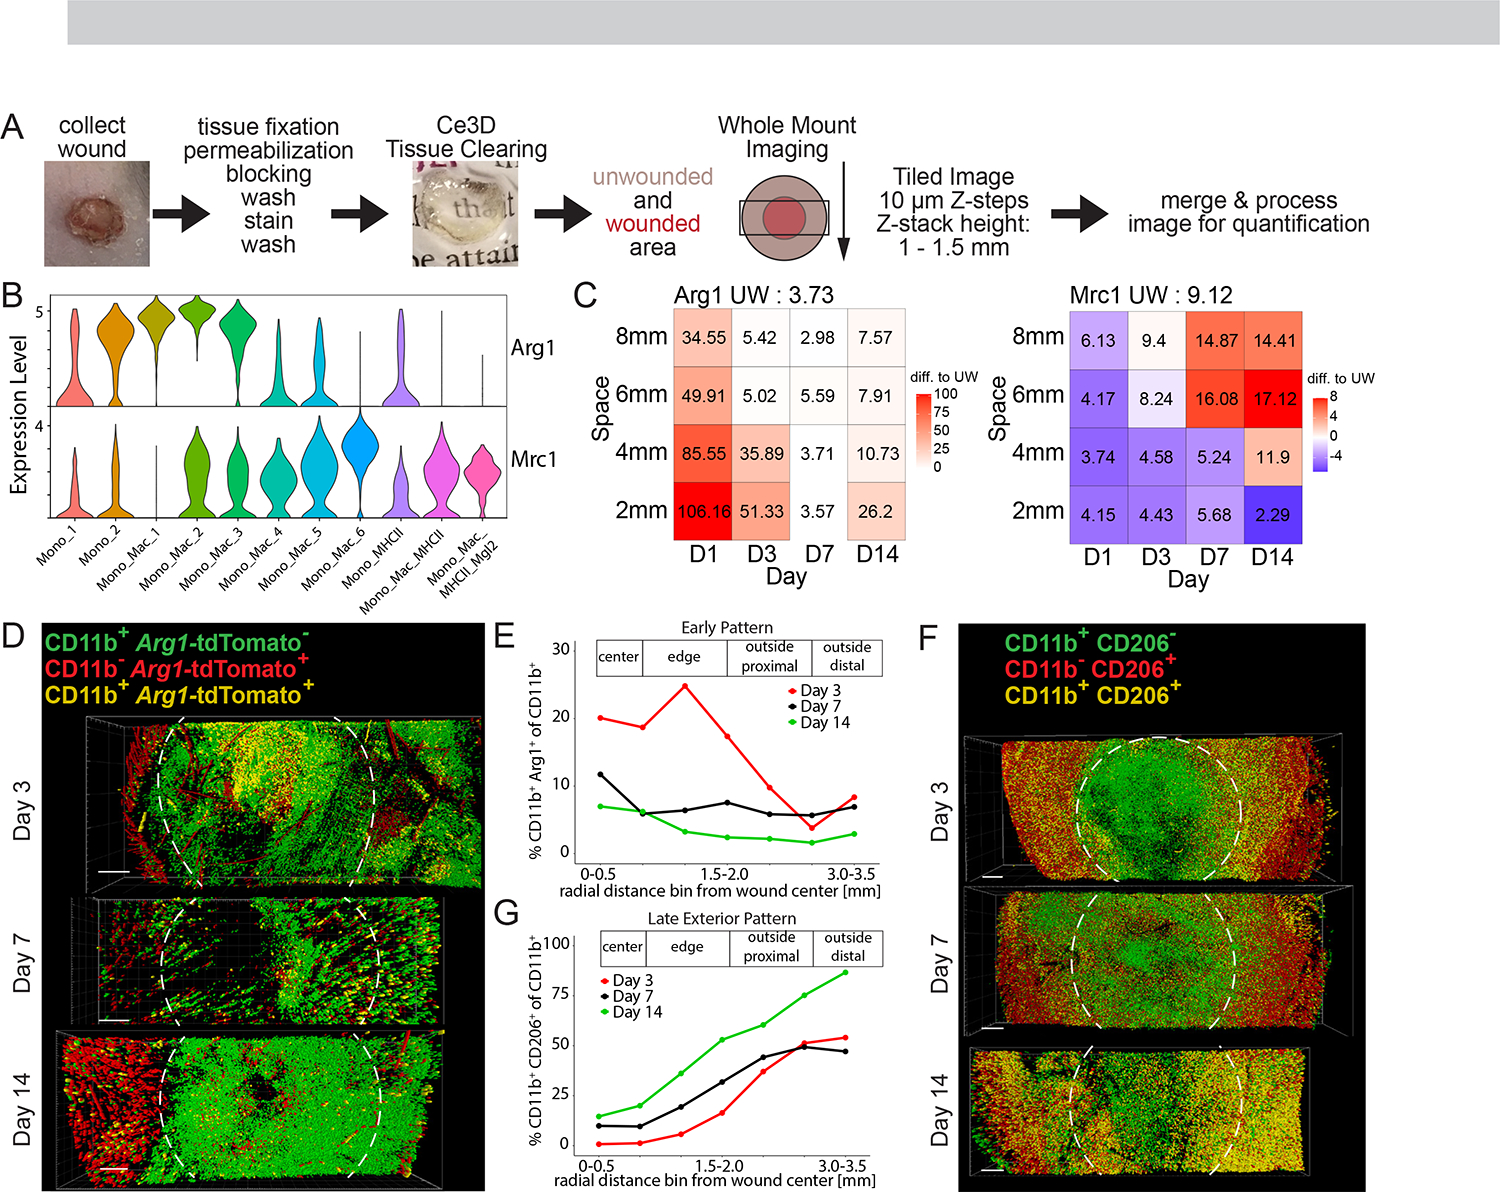
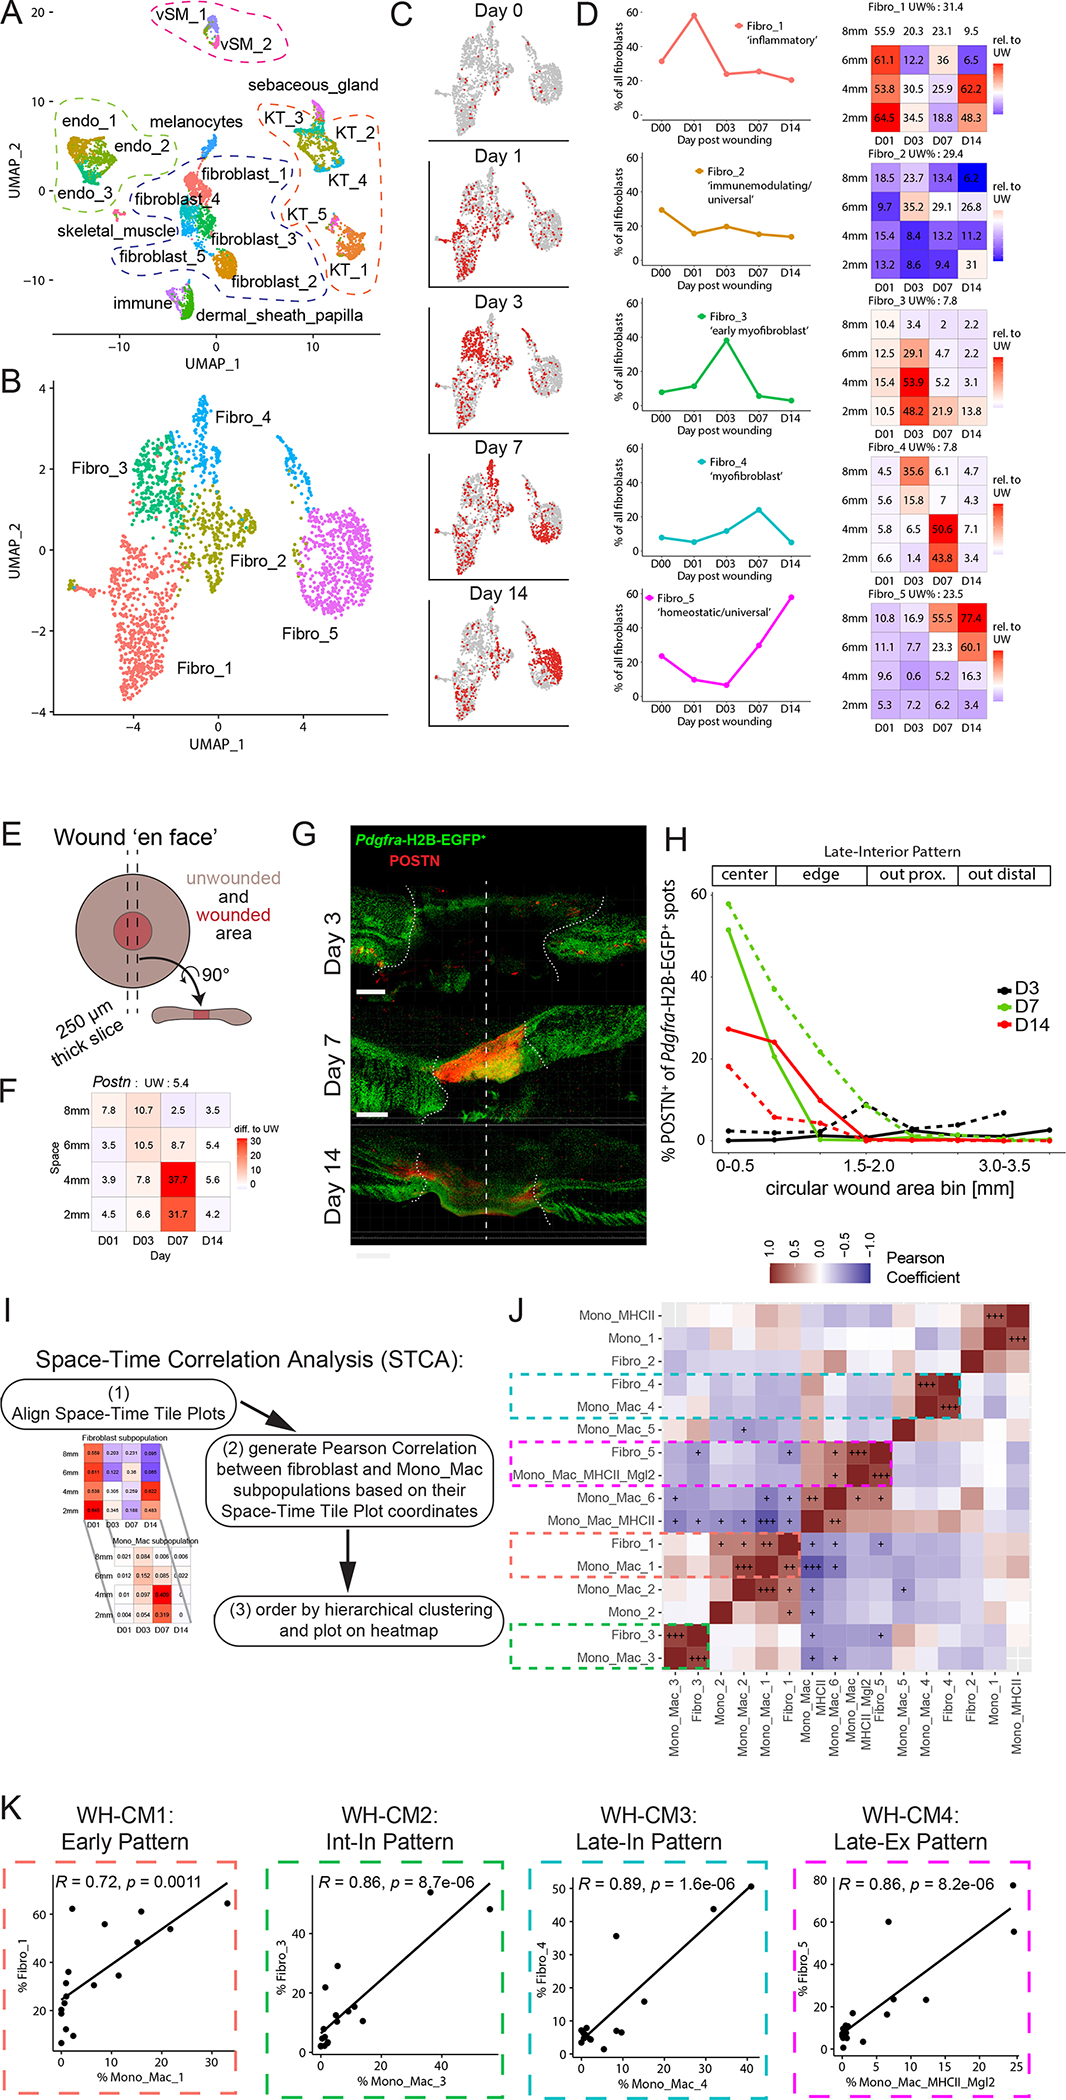
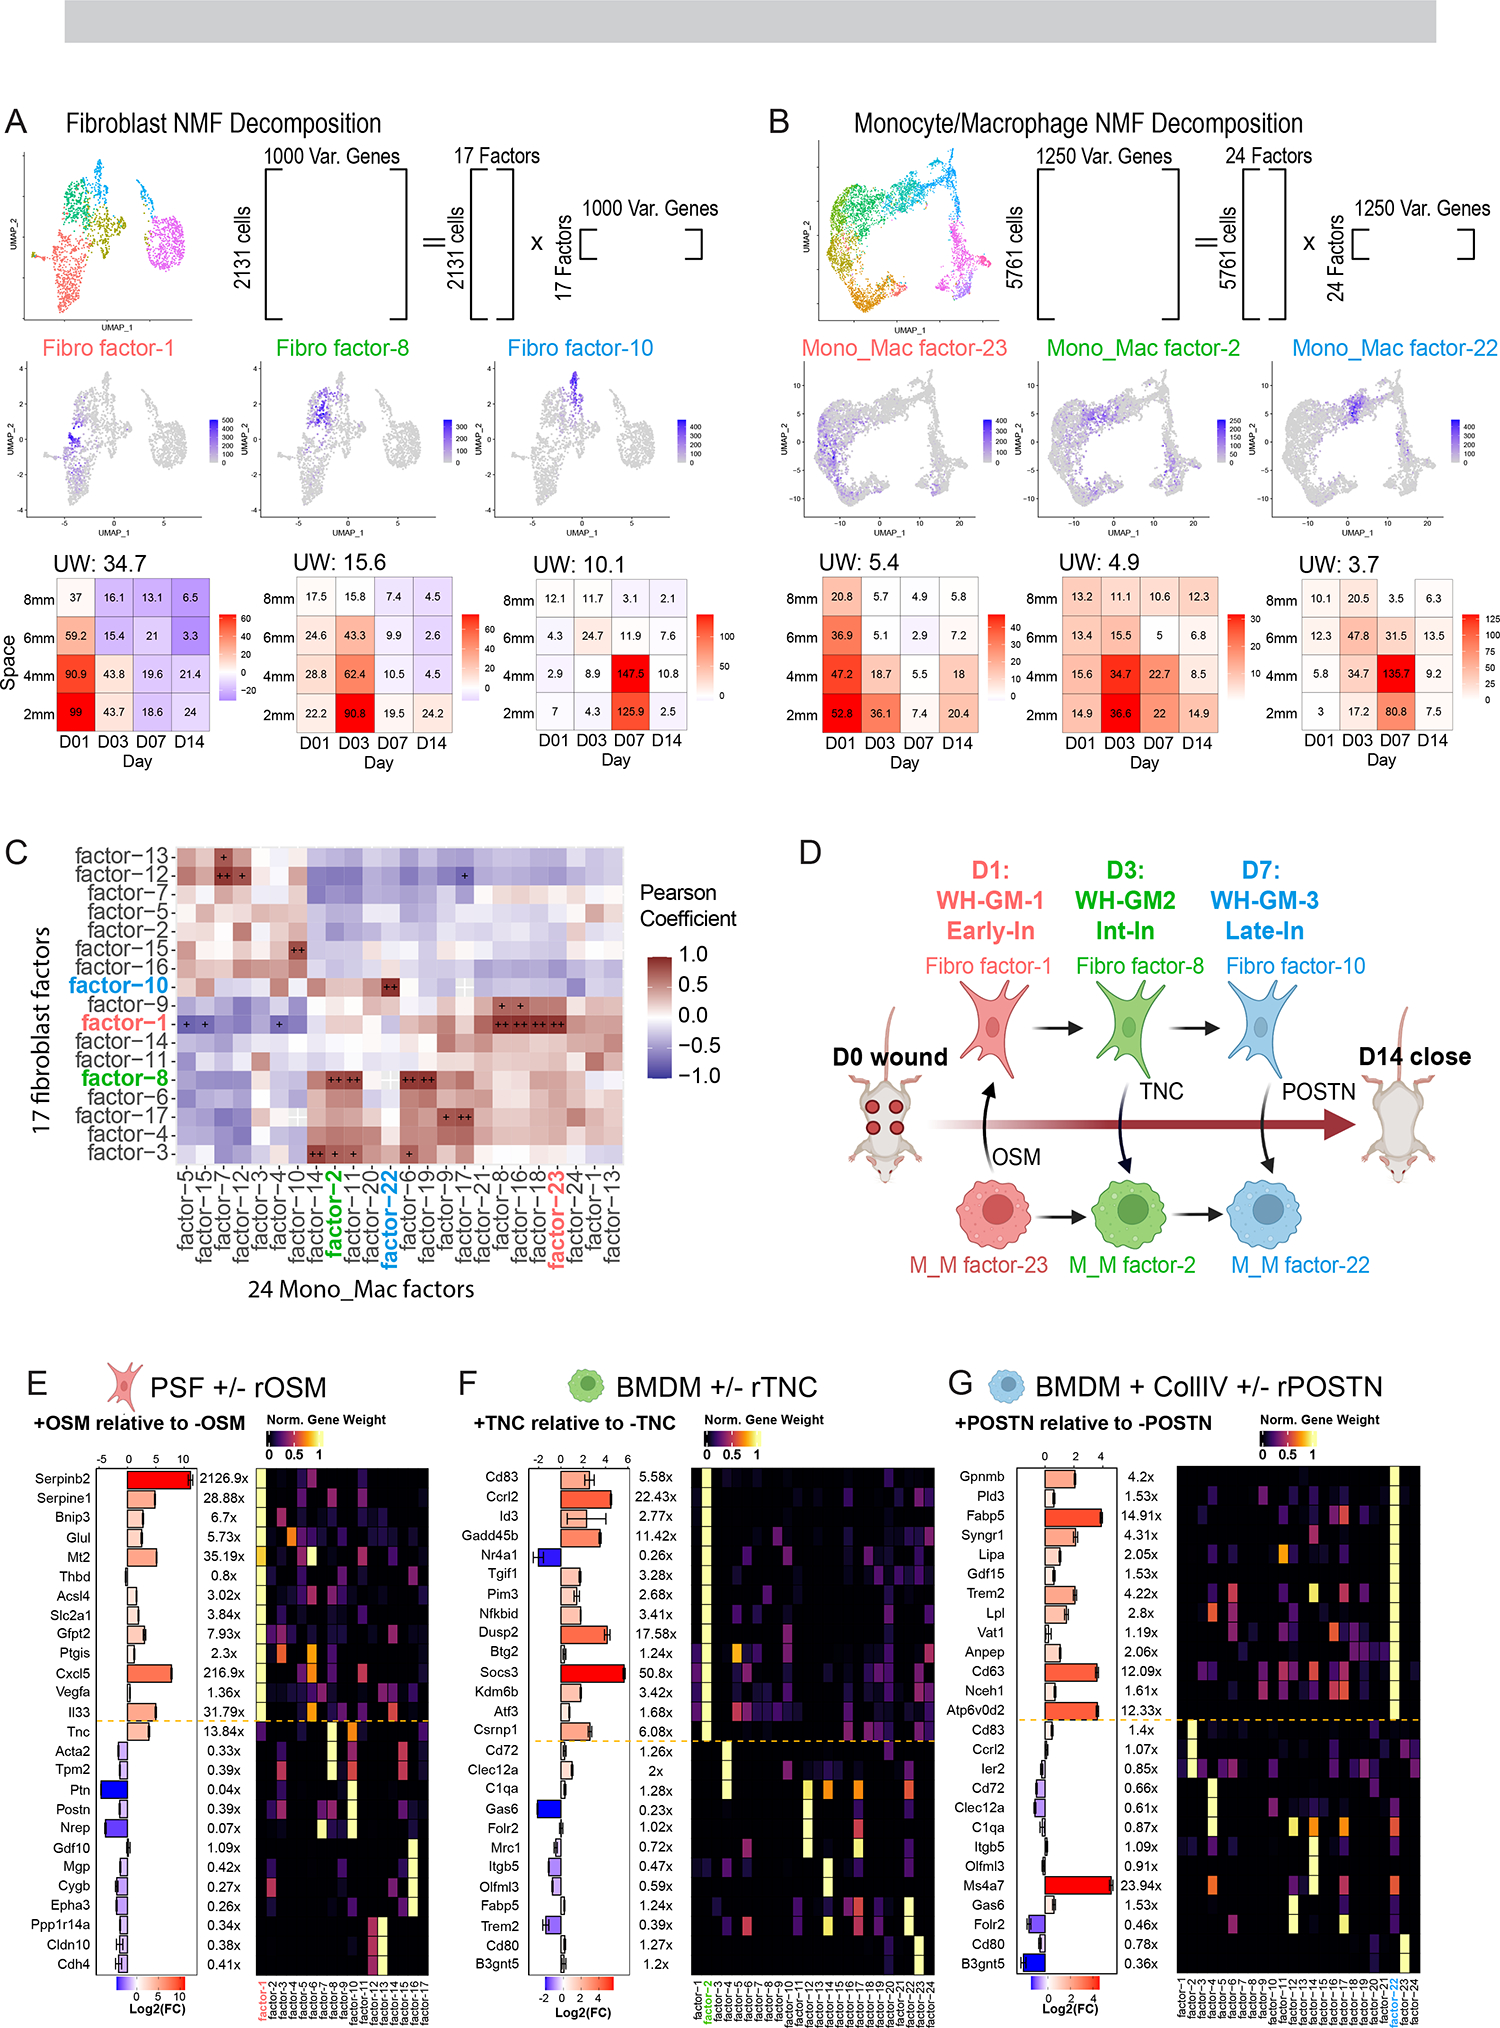
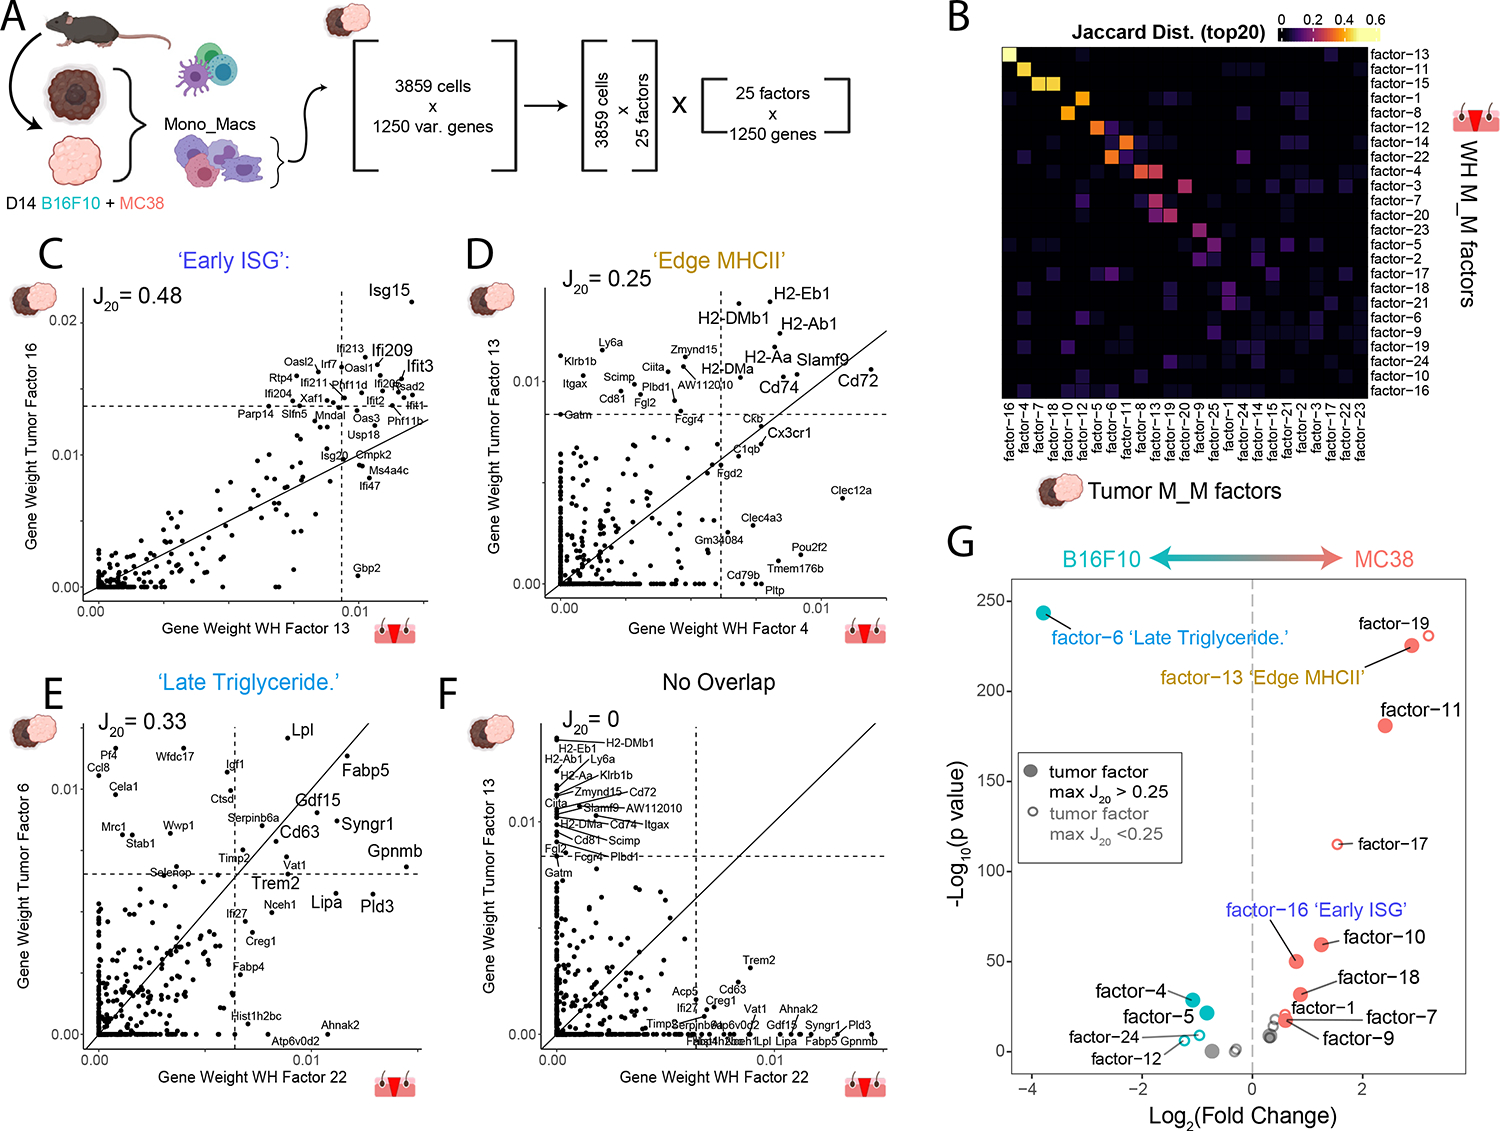
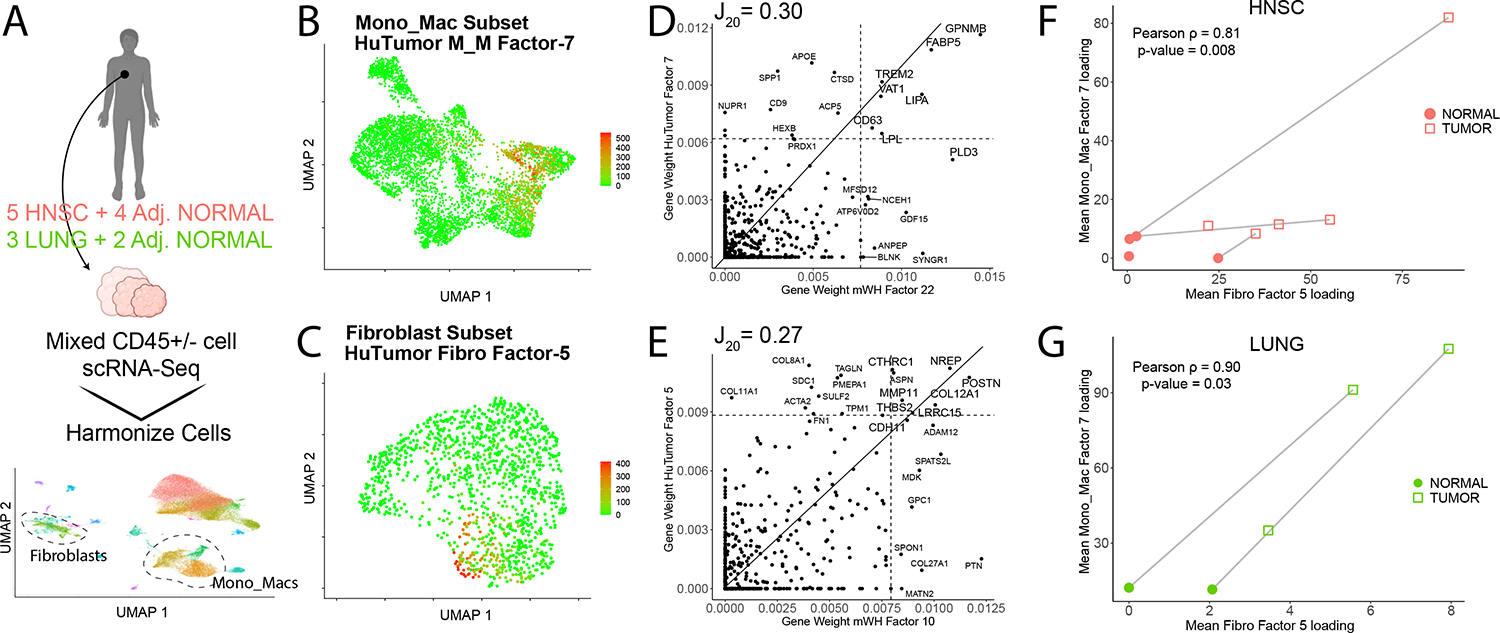
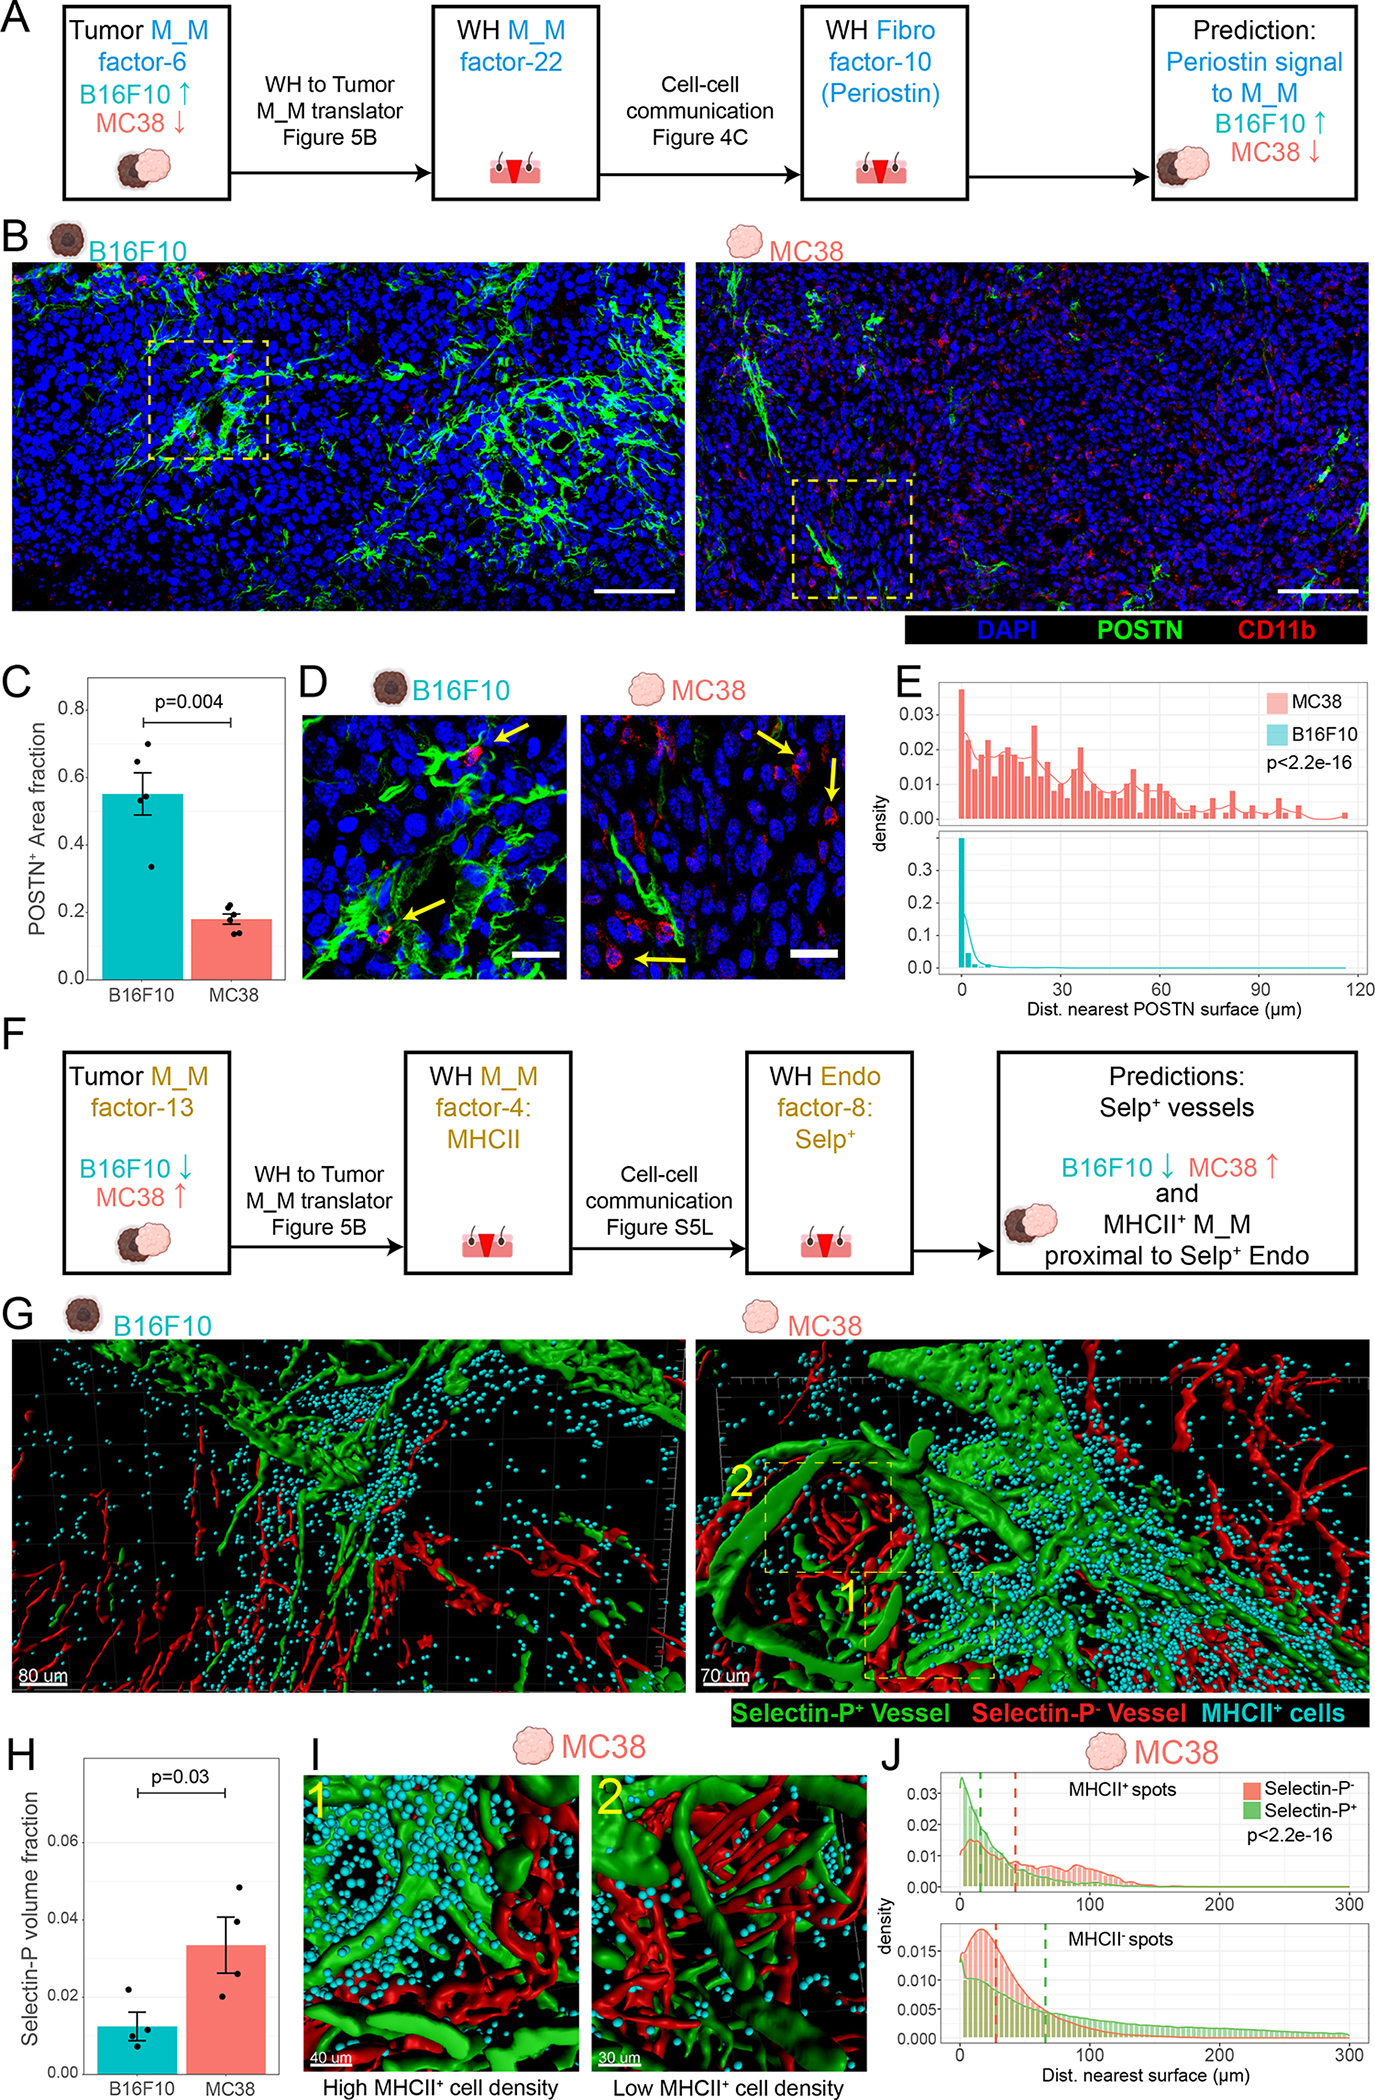
Tissue repair responses in metazoans are highly coordinated by different cell types over space and time. However, comprehensive single-cell-based characterization covering this coordination is lacking. Here, we captured transcriptional states of single cells over space and time during skin wound closure, revealing choreographed gene-expression profiles. We identified shared space-time patterns of cellular and gene program enrichment, which we call multicellular "movements" spanning multiple cell types. We validated some of the discovered space-time movements using large-volume imaging of cleared wounds and demonstrated the value of this analysis to predict "sender" and "receiver" gene programs in macrophages and fibroblasts. Finally, we tested the hypothesis that tumors are like "wounds that never heal" and found conserved wound healing movements in mouse melanoma and colorectal tumor models, as well as human tumor samples, revealing fundamental multicellular units of tissue biology for integrative studies.

Keywords: cell-cell crosstalk; fibroblasts; gene programs; immunology; macrophage; skin; systems biology; tumor microenvironment; wound healing.


Conflict of interest statement

Declaration of interests M.F.K. is a founder and shareholder of PIONYR immunotherapeutic and FOUNDERY innovations.

Figures

Figure 1.
Figure 1.. Transcriptional space-time analysis of single cells unveils unique patterns of monocyte/macrophage populations during skin repair
(A) Experimental layout of transcriptional space-time analysis in wounded skin. Cells analyzed from each wound area and timepoint were pooled from 4 separate wounds. Image generated with Biorender. (B) UMAP plot of monocyte/macrophage (Mono_Mac) subset from CD45+ object. Dotted line separates eight MHCIIlo and three MHCIIhi Mono_Mac clusters. (C) UMAP projection of all Mono_Mac cells from (B) in gray and cells highlighted in red by timepoint of wound sampling. (D) UMAP of MHCIIlo Mono_Mac subset with eight distinct clusters. (E) Pseudotime trajectory using Monocle 3 on MHCIIlo Mono_Mac subset starting at cluster Mono_1, progressing through all cell clusters and ending at cluster Mono_Mac_6. (F) Violin plot of MHCIIlo Mono_Mac subpopulations plotted according to their distribution in pseudotime. (G) Violin plot of MHCIIlo Mono_Mac cells by day post-wounding and plotted according to their presence in pseudotime. D00 equals unwounded skin. (H) Outline of Space-Time tile plot. The 4×4 grid depicts relative abundance of a cell cluster across radial wound area (y-axis) and time post wounding (x-axis). Each tile is one space-timepoint. Number in tile is the percentage of a subpopulation among all Mono_Mac cells at that specific space-timepoint. Background color indicates relative change compared to unwounded (UW) state: red indicates increase, blue indicates decrease, white indicates no change in subpopulation compared to UW. Exemplary data is depicted. (I) Space-time tile plots representing Mono_Mac subpopulations. (J) Phenotypic earth mover’s distance (PhEMD) diffusion map embedding of all space-timepoints. Each dot represents all CD45+ immune cells captured by scRNAseq within that space-timepoint. Dots are color-coded by day and width of band corresponds to area sampled. DC, diffusion coefficient. See also S1.
Figure 2.
Figure 2.. Large volume imaging visualizes spatial distribution of Mono_Mac subsets in whole wounds during skin repair
(A) Workflow for large volume imaging. A rectangular cuboid covering the wound and surrounding unwounded skin tissue is acquired on a scanning confocal microscope. Acquired images are stitched together and processed for image analysis using Imaris. (B) ViolinPlot of (left) Arg1 and (right) Mrc1 natural log-normalized mRNA expression level within all Mono_Mac subpopulations. (C) Space-time tile plot of (left) Arg1 and (right) Mrc1 mRNA expression (normalized to depth) within all Mono_Mac cells. Tiles are color-coded relative to unwounded (UW) state. Red, high. Blue, low. (D) Top-down view of processed image from Arg1-reporter mouse on days 3, 7, and 14 post-wounding. Colored dots indicate cell location of Arg1 CD11b+ Mono_Mac (green), Arg1+ CD11b non-myeloid cells (red), and Arg1+ CD11b+ Mono_Mac_3 (yellow). Dotted line represents original 4 mm wound diameter. Bar, 500 μm. Representative of 2 independent experimental replicates is shown. (E) Quantification of CD11b+ Arg1+ cells in (D) relative to distance from the center of the wound. Percentage of CD11b+ Arg1+ of all CD11b+ cells is plotted by day post wounding, representing an ‘Early Pattern’. (F) Top-down view of processed image on days 3, 7, and 14 post-wounding. Colored dots indicate cell location of CD206 CD11b+ Mono_Macs (green), CD206+ CD11b non-myeloid cells (red), and CD206+ CD11b+ Mono_Mac_6 (yellow). Dotted line represents original 4 mm wound diameter Bar, 500 μm. Representative of 2 independent experimental replicates is shown. (G) Quantification of CD11b+ CD206+ cells in (F) relative to distance from the center of the wound. Percentage of CD11b+ CD206+ of all CD11b+ cells is plotted by day post wounding, representing a ‘Late Exterior Pattern’. See also S2.
Figure 3.
Figure 3.. Unique space-time patterns of fibroblast subpopulations have matching Mono_Mac patterns
(A) UMAP plot of CD45 non-immune cells during skin repair. Endo, endothelial cells. KT, keratinocytes. vSM, vascular smooth muscle. (B) UMAP plot of the fibroblasts during skin repair. (C) UMAP projection of all fibroblasts from (B) in gray and cells highlighted in red by timepoint of wound sampling. (D) Left: Line plots of fibroblast subpopulations identified in the scRNAseq dataset during skin repair. Percentage of each subpopulation within all fibroblasts plotted by day post-wounding. Right: Space-time tile plot representing fibroblast subpopulations. Each tile is one space-timepoint. Number in tile is percentage of subpopulation among all fibroblasts at that specific space-timepoint. Color indicates relative change compared to unwounded (UW) state. Red indicates increase, blue indicates decrease in subpopulation compared to UW. (E) Schematic depicting wound ‘en face’ imaging. A 250 μm thick cross-section of fixed wound tissue is collected, stained, cleared using Ce3D, and the whole volume is imaged by scanning confocal microscopy. (F) Space-time tile plot of Postn mRNA expression (normalized to depth) within fibroblasts. Tiles color-coded relative to unwounded (UW) state. Red, high. Blue, low. (G) 3D-views of dorsal skin wound cross-sections from Pdgfra-reporter mice collected at days 3, 7, and 14 post-wounding. Periostin (POSTN) protein staining shown in red. Dotted vertical line, day 0 wound center. Scale bar, 500 μm. (H) Quantification of Pdgfra-H2B-EGFP+ spots proximal to POSTN+ staining as a percentage of all Pdgfra-H2B-EGFP+ spots in (G) relative to distance from the center of the wound. Percentage of POSTN-proximal Pdgfra-H2B-EGFP+ spots are plotted by day post wounding representing a ‘Late-Interior Pattern’. Two independent experiments shown overlaid with line dashes representing each replicate. (I) Outline of Space-Time Correlation Analysis (STCA). (J) Pearson correlation matrix output of STCA comparing fibroblast and Mono_Mac subpopulations. Correlation was calculated using Pearson correlation and significance adjusted for multiple comparisons using Bonferroni-Hochberg (BH) correction. +p-value<0.05, ++p-value<0.005, +++p-value<0.0005. (K) Correlation xy-plots of select fibroblast-Mono_Mac subpopulation pairs displaying high Pearson correlation in occurrence in space-time during wound skin repair, as identified in (J). Each dot represents one space-timepoint, i.e. one tile from the space-time tile plot and the unwounded state. The percentage of each paired fibroblast and Mono_Mac cluster within the whole fibroblast or Mono_Mac population, respectively, is plotted for each space-timepoint. Pearson correlation test used to calculate correlation coefficient R and p-value. WH-CM, wound healing cell movement. Int-In, intermediate interior. Late-In, late interior. Late-Ex, late exterior. See also S3.
Figure 4.
Figure 4.. Gene program analysis identifies modules of gene expression across diverse cell types and predicts cell-cell interactions between macrophages and fibroblasts
(A and B) Schematic showing strategy for NMF-based decomposition of the (A) fibroblast and (B) monocyte/macrophage populations. NMF decomposition of the fibroblast and Monocyte/Macrophage populations yielded 17/24 factors respectively. Shown are three example FeaturePlots for factor ‘expression’ and Tile Plots describing the average loading of the factor as a function of space-time, with colors indicating change of average expression relative to unwounded as in Fig. 1I (C) Space-time correlation matrix for average factor expression profiles. Correlation was calculated using Pearson correlation and significance adjusted for multiple comparisons using BH Correction. + (alpha <0.05), ++ (alpha <0.005). (D) Cartoon schematic of hypothetical fibroblast-macrophage crosstalk and progression over the timespan of wound healing. Three putative interactions that we investigate in vitro are labeled. WH-GM, wound healing gene movement. OSM, oncostatin M. TNC, tenascin-C. POSTN, periostin. Early-In, early interior. Int-In, intermediate interior. Late-In, late interior. (E) RT-qPCR quantification of gene transcripts in PSF’s predicted from gene program analysis (see S4B) to contribute most to Fibroblast factor-1 as well as genes contributing to other factors as a negative control. Bar chart and color scale denote the Log2 fold-change of relative expression between the OSM treated and untreated PSF’s. Error bars denote standard error of the mean from technical triplicates. Data is representative of two independent experiments. Right heatmap shows the normalized gene weight contribution to all 17 identified fibroblast factors for the genes being probed. (F) RT-qPCR quantification of gene transcripts in BMDM’s predicted from gene program analysis (see S4A) to contribute most to Mono_Mac factor-2 as well as genes contributing to other factors as a negative control. Bar chart and color scale denote the Log2 fold-change of relative expression between the TNC treated and untreated BMDM’s. Error bars denote standard error of the mean from technical triplicates. Data is representative of two independent experiments. Right heatmap shows the normalized gene weight contribution to all 17 identified Mono_Mac factors for the genes being probed. (G) RT-qPCR quantification of gene transcripts in BMDM’s predicted from gene program analysis (see S4A) to contribute most to Mono_Mac factor-22 as well as genes contributing to other factors as a negative control. Bar chart and color scale denote the Log2 fold-change of relative expression between the POSTN treated and untreated BMDM’s. Error bars denote standard error of the mean from technical triplicates. Data is representative of two independent experiments. Right heatmap shows the normalized gene weight contribution to all 17 identified Mono_Mac factors for the genes being probed. See also S4 and Table S2.
Figure 5.
Figure 5.. Identification of conserved gene programs in Mono_Mac between wound healing and mouse tumor models
(A) Strategy for generation of a multi-tumor model Mono_Mac CD45+ scRNA-Seq dataset. Following integration, Mono_Mac populations were selected for NMF decomposition, starting with 3859 cells and the top 1250 variable genes expressed in at least 2% of cells. This resulted in 25 factors of interest based on the cophenetic metric (seen in Figure S5C) (B) Heatmap showing the Jaccard20 distance (defined in STAR Methods) between all 25 M_M tumor and 24 M_M WH factors based on top contributing gene weights. (C-F) Scatter plots for selected tumor/WH factor pairs for (C) Tumor factor-16 vs WH factor-13, (D) Tumor factor-13 vs WH factor-4, (E) Tumor factor-6 vs WH factor-22, and (F) Tumor factor-13 and WH factor-22 with the gene weight contributions plotted as calculated from the basis matrix in the NMF output (see Figure S4A for WH factors and S5B for tumor factors). Slope represents x=y line and dotted lines represent the weight for the 20th highest gene contribution in either factor. The Jaccard20 index is shown and thus reflects the frequency of points in quadrant I over quadrants I, II and IV. For pairings in C-E, top shared genes in the upper right quadrant were put through Enrichr to find overrepresented cellular processes with the top result by p-value listed. Full Enrichr output can be found in the extended data (Table S2). (G) Volcano plot showing differential loading of factors between MC38 and B16F10 Mono_Mac. Datasets for the 25 identified factors. Y-axis denotes log10 of unadjusted p-value. Labelled points have adjusted p-value < 0.05 (Bonferroni correction) and absolute log2 fold-change greater than 0.5. Colored points have absolute log2 fold change greater than 0.5. See also S4 and S5.
Figure 6.
Figure 6.. The wound healing gene movement-3 (WH-GM3) is conserved in human tumors
(A) scRNA-seq datasets of both CD45+ and CD45 compartments from patient tumor resections and adjacent normal samples were collected from lung adenocarcinomas (LUNG) and head and neck squamous cell carcinomas (HNSC) as described in STAR Methods (n = 77,270 cells). (B) Feature plot shown for the Mono_Mac object for HuTumor Mono_Mac factor-7. (C) Feature plot shown for the fibroblast object for HuTumor fibro factor-5. (D) Scatter plot for gene weights from factor pair (human) HuTumor Mono_Mac factor-7 vs. (mouse) mWH Mono_Mac factor-22 (right). Mouse gene symbols were converted to their ortholog for comparison purposes with the gene weight contributions plotted as calculated from the basis matrix in the NMF output. Slope represents x = y line, and dotted lines represent the weight for the 20th highest gene contribution in either factor. The Jaccard20 index is shown. (E) Scatter plots for selected human (hu) tumor/murine (m) WH factor pairs huTumor Fibroblast Factor 5 vs. mouse WH Fibroblast factor-10. Mouse gene symbols were converted to their ortholog for comparison purposes with the gene weight contributions plotted as calculated from the basis matrix in the NMF output. Slope represents x = y line and dotted lines represent the weight for the 20th highest gene contribution in either factor. The Jaccard20 index is shown. (F and G) Scatter plot showing mean factor levels calculated for huTumor Mono_Mac factor-7 and huTumor fibroblast factor-5 across HNSC samples (F) and LUNG (G). Point shapes denote adjacent normal vs. tumor samples and lines between points represent paired adjacent normal and tumor samples. Pearson’s rho denoted and p value calculated via Pearson’s method. See also Figure S6 and Table S3.
Figure 7.
Figure 7.. Conservation of Mono_Mac factors predicts specific differential features of microenvironments in B16F10 vs MC38 tumor models
(A) Schematic for hypothesis generation in the tumor setting. Translation of the tumor M_M factor-6 to the WH M_M factor-22 allows prediction that the same stimuli (POSTN from WH Fibro factor-10) might underlie tumor M_M factor-6 and thus be more prevalent in the B16F10 vs. MC38 tumor model. (B) Representative immunofluorescent images of 10 μm sections of D14 B16F10 and MC38 tumors stained for DAPI (blue), POSTN (green), and CD11b (red). Scale bar = 100 μm. Representative of 2 independent replicates consisting of total of 6 and 5 samples for MC38 and B16F10 respectively. (C) Barchart denoting fraction area of POSTN+ surfaces as a fraction of total imaged tissue area. One-sided Wilcoxon rank-sum test used. Each point represents a scanned area from 6/5 separate tumor samples MC38/B16F10 respectively. (D) Insets from denoted regions of interest in Figure 6B. Arrows denote CD11b+ cells in close contact with POSTN+ surfaces (B16F10) or not (MC38). Scale bar = 25 μm. (E) Histograms showing distribution of distance of CD11b+ cells to nearest POSTN surface. Representative of 3 independent replicates (3 tumors). Bin-width = 2 μm. Kolmogorov-Smirnov (KS) test used to test for distribution similarity. (F) Schematic for hypothesis generation in the tumor setting. Translation of the tumor M_M factor-13 to the WH M_M factor-4 allows prediction that the same association between WH M_M factor-4 with endothelial WH factor-8 might be found in the tumor setting and that endothelial factor-8 might be more prevalent in MC38 vs. B16F10 tumor model. (G) Processed 3D images of cleared 250 μm thick tumor slices from a (left) B16F10 and (right) MC38 tumor. Generated surfaces based on Selectin-P+ staining (green) and CD31+/Selectin-P signal (red). Dots (cyan) denote MHCII+ cells. Representative of 4 independent replicates (4 separate tumors). (H) Bar chart showing comparison of the cumulative Selectin-P+ surfaces volume normalized to total imaged tissue volume between MC38 and B16F10. One-sided Wilcoxon rank sum test used. (I) Zoomed in and rotated insets from MC38 tumor in Figure 6G exemplifying (1) dense accumulation of MHCII+ cells proximal to Selectin-P+ vessels and (2) sparse MHCII+ cell accumulation proximal to Selectin-P. (J) Histograms indicating the distances of MHCII+ spots and MHCII spots to the nearest Selectin-P+ or Selectin-P surface in the MC38 model. Dashed line indicates the median. Histograms representative of 4 independent replicates (4 separate tumors). P-value calculated via KS test. See also S7.

Comment in

  • Choreographing tissue repair.
    Dempsey LA. Dempsey LA. Nat Immunol. 2023 Jul;24(7):1051. doi: 10.1038/s41590-023-01556-4. Nat Immunol. 2023. PMID: 37340181 No abstract available.

References

    1. Wertheimer T, Velardi E, Tsai J, Cooper K, Xiao S, Kloss CC, Ottmüller KJ, Mokhtari Z, Brede C, deRoos P, et al. (2018). Production of BMP4 by endothelial cells is crucial for endogenous thymic regeneration. Sci Immunol 3. 10.1126/sciimmunol.aal2736. - DOI - PMC - PubMed
    1. Walesky CM, Kolb KE, Winston CL, Henderson J, Kruft B, Fleming I, Ko S, Monga SP, Mueller F, Apte U, et al. (2020). Functional compensation precedes recovery of tissue mass following acute liver injury. Nat Commun 11. 10.1038/s41467-020-19558-3. - DOI - PMC - PubMed
    1. Rodrigues M, Kosaric N, Bonham CA, and Gurtner GC (2019). Wound healing: A cellular perspective. Physiol Rev. 10.1152/physrev.00067.2017. - DOI - PMC - PubMed
    1. Li P, and Elowitz MB (2019). Communication codes in developmental signaling pathways. Development (Cambridge) 146. 10.1242/dev.170977. - DOI - PMC - PubMed
    1. Zhou X, Franklin RA, Adler M, Jacox JB, Bailis W, Shyer JA, Flavell RA, Mayo A, Alon U, and Medzhitov R (2018). Circuit Design Features of a Stable Two-Cell System. Cell 172. 10.1016/j.cell.2018.01.015. - DOI - PMC - PubMed

Publication types