

Optimization and Deoptimization of Codons in SARS-CoV-2 and Related Implications for Vaccine Development
- PMID: 37267926
- PMCID: PMC10427376
- DOI: 10.1002/advs.202205445
Optimization and Deoptimization of Codons in SARS-CoV-2 and Related Implications for Vaccine Development
Abstract
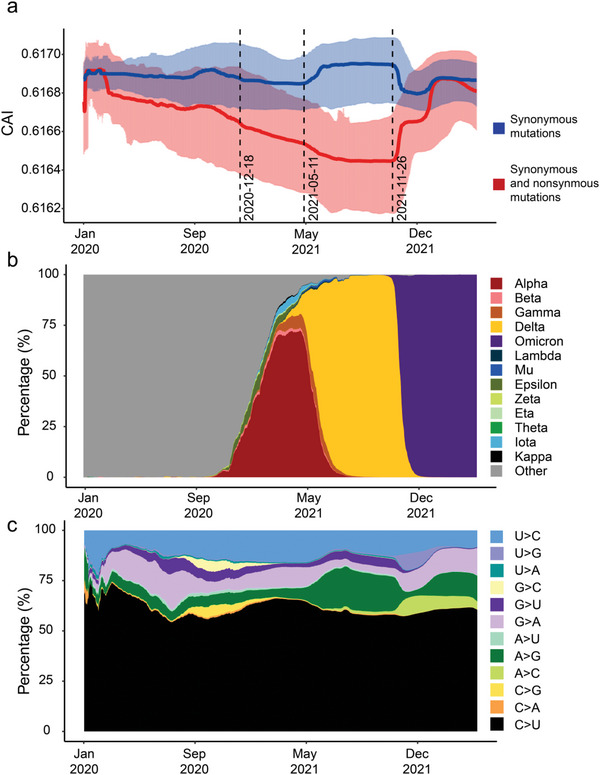
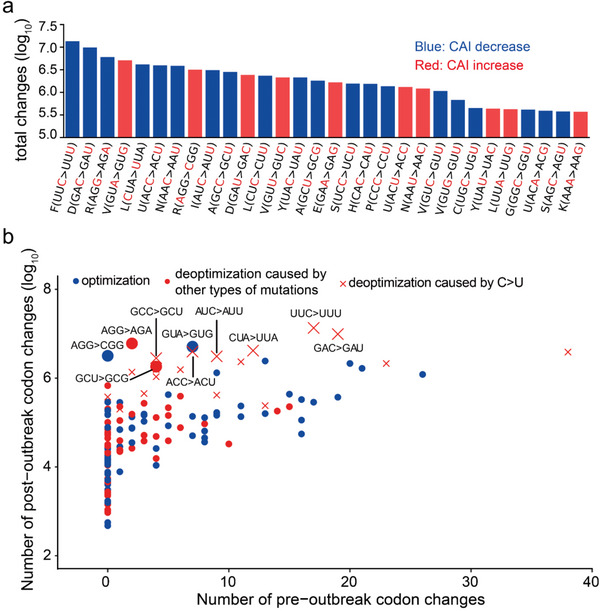
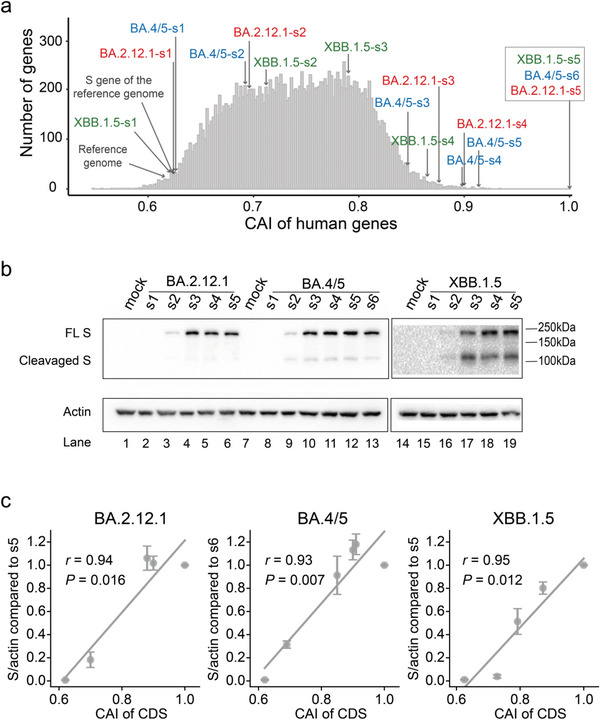
The spread of coronavirus disease 2019 (COVID-19), caused by severe respiratory syndrome coronavirus 2 (SARS-CoV-2), has progressed into a global pandemic. To date, thousands of genetic variants have been identified among SARS-CoV-2 isolates collected from patients. Sequence analysis reveals that the codon adaptation index (CAI) values of viral sequences have decreased over time but with occasional fluctuations. Through evolution modeling, it is found that this phenomenon may result from the virus's mutation preference during transmission. Using dual-luciferase assays, it is further discovered that the deoptimization of codons in the viral sequence may weaken protein expression during virus evolution, indicating that codon usage may play an important role in virus fitness. Finally, given the importance of codon usage in protein expression and particularly for mRNA vaccines, it is designed several codon-optimized Omicron BA.2.12.1, BA.4/5, and XBB.1.5 spike mRNA vaccine candidates and experimentally validated their high levels of expression. This study highlights the importance of codon usage in virus evolution and provides guidelines for codon optimization in mRNA and DNA vaccine development.
Keywords: SARS-CoV-2; codon optimization; codon usage bias; spike protein; synonymous mutations; vaccine design.
© 2023 The Authors. Advanced Science published by Wiley-VCH GmbH.
Conflict of interest statement
The authors declare no conflict of interest.
Figures
Similar articles
-
Mutation and codon bias analysis of the spike protein of Omicron, the recent variant of SARS-CoV-2.Int J Biol Macromol. 2023 Oct 1;250:126080. doi: 10.1016/j.ijbiomac.2023.126080. Epub 2023 Aug 2. Int J Biol Macromol. 2023. PMID: 37536405
-
Betacoronaviruses genome analysis reveals evolution toward specific codons usage: Implications for SARS-CoV-2 mitigation strategies.J Med Virol. 2021 Sep;93(9):5630-5634. doi: 10.1002/jmv.27056. Epub 2021 May 24. J Med Virol. 2021. PMID: 33934387 Free PMC article.
-
Comparative analysis of human coronaviruses focusing on nucleotide variability and synonymous codon usage patterns.Genomics. 2021 Jul;113(4):2177-2188. doi: 10.1016/j.ygeno.2021.05.008. Epub 2021 May 19. Genomics. 2021. PMID: 34019999 Free PMC article.
-
Research progress in spike mutations of SARS-CoV-2 variants and vaccine development.Med Res Rev. 2023 Jul;43(4):932-971. doi: 10.1002/med.21941. Epub 2023 Mar 16. Med Res Rev. 2023. PMID: 36929527 Review.
-
The Rise and Fall of SARS-CoV-2 Variants and Ongoing Diversification of Omicron.Viruses. 2022 Sep 10;14(9):2009. doi: 10.3390/v14092009. Viruses. 2022. PMID: 36146815 Free PMC article. Review.
Cited by
-
Molecular Evolution of Protein Sequences and Codon Usage in Monkeypox Viruses.Genomics Proteomics Bioinformatics. 2024 May 9;22(1):qzad003. doi: 10.1093/gpbjnl/qzad003. Genomics Proteomics Bioinformatics. 2024. PMID: 38862422 Free PMC article.
-
Codon-optimization in gene therapy: promises, prospects and challenges.Front Bioeng Biotechnol. 2024 Mar 28;12:1371596. doi: 10.3389/fbioe.2024.1371596. eCollection 2024. Front Bioeng Biotechnol. 2024. PMID: 38605988 Free PMC article. Review.
-
Self-Amplifying RNA: Advantages and Challenges of a Versatile Platform for Vaccine Development.Viruses. 2025 Apr 14;17(4):566. doi: 10.3390/v17040566. Viruses. 2025. PMID: 40285008 Free PMC article. Review.
-
Enhancing mRNA translation efficiency by introducing sequence optimized AU-rich elements in 3' UTR via HuR anchorage.Mol Ther Nucleic Acids. 2025 Feb 12;36(2):102485. doi: 10.1016/j.omtn.2025.102485. eCollection 2025 Jun 10. Mol Ther Nucleic Acids. 2025. PMID: 40125272 Free PMC article.
-
Unlocking the potential of circular RNA vaccines: a bioinformatics and computational biology perspective.EBioMedicine. 2025 Apr;114:105638. doi: 10.1016/j.ebiom.2025.105638. Epub 2025 Mar 19. EBioMedicine. 2025. PMID: 40112741 Free PMC article. Review.
References
-
- a) Shen X., Song S., Li C., Zhang J., Nature 2022, 606, 725; - PMC - PubMed
- b) Chen F., Wu P., Deng S., Zhang H., Hou Y., Hu Z., Zhang J., Chen X., Yang J. R., Nat. Ecol. Evol. 2020, 4, 589; - PMC - PubMed
- c) Nieuwkoop T., Finger‐Bou M., van der Oost J., Claassens N. J., Mol. Cell 2020, 80, 193; - PubMed
- d) Lu J., Wu C. I., Proc. Natl. Acad. Sci. U S A 2005, 102, 4063. - PMC - PubMed
-
- a) Presnyak V., Alhusaini N., Chen Y. H., Martin S., Morris N., Kline N., Olson S., Weinberg D., Baker K. E., Graveley B. R., Coller J., Cell 2015, 160, 1111; - PMC - PubMed
- b) Wu Q., Medina S. G., Kushawah G., DeVore M. L., Castellano L. A., Hand J. M., Wright M., Bazzini A. A., Elife 2019, 8, e45396. - PMC - PubMed
MeSH terms
Substances
Grants and funding
- 2021YFC2301300/National Key Research and Development Projects of the Ministry of Science and Technology of China
- 2021YFC0863300/National Key Research and Development Projects of the Ministry of Science and Technology of China
- 2020YFA0707600/National Key Research and Development Projects of the Ministry of Science and Technology of China
- 2020YFC0847000/National Key Research and Development Projects of the Ministry of Science and Technology of China
- L222009/Beijing Natural Science Foundation
LinkOut - more resources
Full Text Sources
Other Literature Sources
Medical
Miscellaneous