. 2023 Jun 27;42(6):112560.
doi: 10.1016/j.celrep.2023.112560. Epub 2023 Jun 1.

5-Azacytidine- and retinoic-acid-induced reprogramming of DCCs into dormancy suppresses metastasis via restored TGF-β-SMAD4 signaling

Affiliations

5-Azacytidine- and retinoic-acid-induced reprogramming of DCCs into dormancy suppresses metastasis via restored TGF-β-SMAD4 signaling

Deepak K Singh et al. Cell Rep. .

Abstract

Disseminated cancer cells (DCCs) in secondary organs can remain dormant for years to decades before reactivating into overt metastasis. Microenvironmental signals leading to cancer cell chromatin remodeling and transcriptional reprogramming appear to control onset and escape from dormancy. Here, we reveal that the therapeutic combination of the DNA methylation inhibitor 5-azacytidine (AZA) and the retinoic acid receptor ligands all-trans retinoic acid (atRA) or AM80, an RARα-specific agonist, promotes stable dormancy in cancer cells. Treatment of head and neck squamous cell carcinoma (HNSCC) or breast cancer cells with AZA+atRA induces a SMAD2/3/4-dependent transcriptional program that restores transforming growth factor β (TGF-β)-signaling and anti-proliferative function. Significantly, either combination, AZA+atRA or AZA+AM80, strongly suppresses HNSCC lung metastasis formation by inducing and maintaining solitary DCCs in a SMAD4+/NR2F1+ non-proliferative state. Notably, SMAD4 knockdown is sufficient to drive resistance to AZA+atRA-induced dormancy. We conclude that therapeutic doses of AZA and RAR agonists may induce and/or maintain dormancy and significantly limit metastasis development.

Keywords: CP: Cancer; CP: Cell biology; disseminated cancer cell; dormancy; enhancers; metastasis; transcriptional reprogramming.


Conflict of interest statement

Declaration of interests J.A.A.-G. is a scientific co-founder of, scientific advisory board member at, and equity owner in HiberCell and receives financial compensation as a consultant for HiberCell, a Mount Sinai spin-off company focused on therapeutics that prevent or delay cancer recurrence.

Figures

Figure 1.
Figure 1.. Transcriptional changes induced by AZA+atRA reprogramming
(A) T-HEp3 cells reprogrammed with AZA+atRA followed by CAM assay. (B) 4T1, a breast cancer cell line reprogrammed with AZA+atRA followed by CAM assay. (C) T-HEp3 cells reprogrammed with AZA-CdR+atRA followed by CAM assay. All CAM assays were repeated at least three times. (D) AZA+atRA reprogramming protocol: T-HEp3 cells seeded at low density were treated with AZA (5 nM) in DMEM containing charcoal-stripped FBS for 2 days at an interval of 24 h. After 48 h, AZA-containing culture medium was replaced with serum-free DMEM, and cells were treated with atRA (1 μM) and NR2F1 knockdown was carried out simultaneously for 48 h. Cells were collected and processed for RNA extraction, followed by RNA sequencing. (E) A heatmap shows DEGs upon AZA+atRA reprogramming and genes dependent or independent of NR2F1. (F) ChIP enrichment analysis of DEGs in (E) using Enrichr to compute overrepresentation of transcription factor (TF) targets. Only a few of the top significantly enriched and study-relevant TFs are shown. (G) ChEA of DEGs in AZA+atRA reprogramming independent of NR2F1 using Enrichr to compute overrepresentation of TF targets. See also Figures S1 and S2.
Figure 2.
Figure 2.. RNA-seq analysis of D-HEp3 and T-HEp3 transcriptome
(A) Volcano plot showing the DEGs (upregulated) in D-HEp3 (blue) and T-HEp3 (red). Adjusted p value (≤0.05) was used as a cutoff to identify DEGs. (B) Venn diagram shows the comparison of upregulated and downregulated genes in D-HEp3 with up- and downregulated NR2F1-independent genes upon AZA+atRA reprogramming (p < 3.542e−05, top, and p < 3.975e−07, bottom). (C) ChIP-seq analysis of H3K27ac marks was performed on D-HEp3 and T-HEp3 cells. Enriched peaks (specific to either D-HEp3 or T-HEp3 and common to both D-HEp3 and T-HEp3) are shown as density plot. (D) DEGs in D-HEp3 were overlaid with H3K27ac enriched marks in D-HEp3, and the heatmap shows upregulated genes in D-HEp3 regulated by enhancers. (E) ChEA of enhancer regulated genes in D-HEp3 using Enrichr to compute overrepresentation of TF targets. (F) ChIP-seq analysis of H3K27ac marks in T-HEp3 control and AZA+atRA reprogrammed. (G) Upregulated genes in T-HEp3 reprogrammed with AZA+atRA were overlaid with H3K27ac enriched marks, and the heatmap shows the genes regulated by enhancer upon AZA+atRA reprogramming. (H) ChEA of enhancer regulated genes in T-HEp3 cells reprogrammed with AZA+atRA using Enrichr to compute overrepresentation of TF targets. See also Figures S3 and S4.
Figure 3.
Figure 3.. AZA+atRA reprogramming induces SMAD2, SMAD3, and SMAD4 expression
(A) Western blots show upregulation of SMAD2/3/4 and dormancy-associated marker genes like p27 and P-p38 upon AZA+atRA reprogramming in T-HEp3 cells. (B) Immunofluorescence (IF) staining show the higher nuclear localization of p27 and SMAD4 (marked with solid white arrowheads) in AZA+atRA-reprogrammed T-HEp3 cells. (C) Quantification of nuclear SMAD4 and p27 in control and AZA+atRA-reprogrammed T-HEp3 cells (unpaired t test, p ≤ 0.05). (D) Western blots show higher expression of SMAD2/3/4 in D-HEp3 cells compared with T-HEp3 cells. (E) IF staining shows higher SMAD4 nuclear localization (marked with solid white arrowheads) in D-HEp3 cells. (F) Quantification of nuclear SMAD4 in D-Hep3 and T-HEp3 cells (unpaired t test, p ≤ 0.05, error bar represents standard error of mean). (G) SMAD4 knockdown by siRNA and AZA+atRA reprogramming in T-HEp3 cells reveals p27 dependency on SMAD4. (H) T-HEp3 (1.5 × 10⁻⁵) cells depleted of SMAD4 and AZA+atRA reprogrammed were inoculated in chicken CAM and incubated for 4 days. After incubation, tumors were excised, and the total number of cells was counted (experiment was repeated three times with a minimum of three eggs per experiment per condition, Mann-Whitney test, p ≤ 0.05, error bar represents standard deviation). See also Figure S5.
Figure 4.
Figure 4.. AZA+atRA and AZA+AM80 suppress the metastatic load in an experimental mouse model
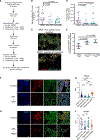
(A) Schematic of in vivo mouse experiment. 0.5 × 10⁻⁶ T-HEp3-GFP primary tumor cells (passage 0 from CAM) were injected into nude mice. Mice were treated in a neo-adjuvant setting with AZA+atRA or AZA+AM80 once when the tumor size reached an average size of 300 mm3. At a 600 mm3 tumor size, surgery was performed to remove the primary tumors from the animals, and they were treated with four cycles (28 days) of adjuvant therapy (AZA+atRA or AZA+AM80). Animals were euthanized, and organs were processed for analysis. (B) Mouse lungs digested enzymatically and counted for GFP+ T-HEp3 single cells. (C) T-HEp3-GFP cells in the digested lung suspensions were stained with vimentin and NR2F1. Representative images show positive (white arrow long tail), low positive (white arrow with short tail), and negative signals (white arrowhead) for NR2F1. (D) Quantification of T-HEp3-GFP cells in lung sections using vimentin IF staining. (E) Quantification of NR2F1+ and vimentin+ T-HEp3-GFP cells in lung sections. n = 15 unless otherwise mentioned (Mann-Whitney test, p ≤ 0.05, error bar represents standard deviation). (F) IF staining images showing SMAD4 expression in disseminated T-HEp3-GFP cells in control and AZA+atRA-treated mouse lungs. (G) Quantifications of mean fluorescent intensity (MFI) of SMAD4 signals in T-HEp3-GFP cells in control and AZA+atRA-treated mouse lungs (n from ≥5 mice, Mann-Whitney test, p ≤ 0.05, error bar represents standard deviation). (H) IF staining images showing SMAD4 expression in disseminated T-HEp3-GFP cells in control and AZA+AM80-treated mouse lungs. (I) Quantifications of MFI of SMAD4 signals in T-HEp3-GFP cells in control and AZA+AM80-treated mouse lungs (n from ≥5 mice, Mann-Whitney test, p ≤ 0.05, error bar represents standard deviation). See also Figure S6.
Figure 5.
Figure 5.. SMAD4 keeps DCCs in a dormant single-cell state
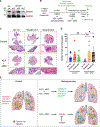
(A) Western blot shows knockdown efficiency of SMAD4 by stably expressed shRNAs in T-HEp3 cell line. (B) Schematic of in vivo mouse experiment. T-HEp3 cells with or without SMAD4 were reprogrammed for a week by AZA+atRA in vitro and then injected into nude mice. Mice were treated with AZA (1 mg/kg/day) and atRA (1 mg/kg/day) for 2 weeks. Lungs were collected and processed for experiments. (C) Representative images of H&E-stained mouse lungs showing metastasis. (D) Graph shows number of metastatic lesions (mets) per lung section per mouse (n ≥ 6 animals, Mann-Whitney test, p ≤ 0.05, error bar represents standard deviation). (E) Working model: lungs of control animals harbor macrometastasis, micrometastasis, and single DCCs, while treatment with AZA+atRA or AZA+AM80 inhibits metastatic growth leading to micrometastasis and single DCCs. Single DCCs have higher SMAD4 expression, which keeps cancer cells in a dormant single-cell state. Knockdown of SMAD4 abolishes the effect of AZA+atRA reprogramming to keep cancer cells dormant.

See also Figure S7.

References

    1. Dillekås H, Rogers MS, and Straume O (2019). Are 90% of deaths from cancer caused by metastases? Cancer Med. 8, 5574–5576. 10.1002/cam4.2474. - DOI - PMC - PubMed
    1. Lambert AW, Pattabiraman DR, and Weinberg RA (2017). Emerging biological principles of metastasis. Cell 168, 670–691. 10.1016/j.cell.2016.11.037. - DOI - PMC - PubMed
    1. Paget S (1889). The distribution of secondary growths in cancer of the breast. Lancet 133, 571–573. 10.1016/s0140-6736(00)49915-0. - DOI - PubMed
    1. Peinado H, Zhang H, Matei IR, Costa-Silva B, Hoshino A, Rodrigues G, Psaila B, Kaplan RN, Bromberg JF, Kang Y, et al. (2017). Pre-metastatic niches: organ-specific homes for metastases. Nat. Rev. Cancer 17, 302–317. 10.1038/nrc.2017.6. - DOI - PubMed
    1. Sosa MS, Bragado P, and Aguirre-Ghiso JA (2014). Mechanisms of disseminated cancer cell dormancy: an awakening field. Nat. Rev. Cancer 14, 611–622. 10.1038/nrc3793. - DOI - PMC - PubMed

Publication types

MeSH terms