. 2023 Jun 14;31(6):962-977.e8.
doi: 10.1016/j.chom.2023.05.006. Epub 2023 Jun 1.

Airway T cells are a correlate of i.v. Bacille Calmette-Guerin-mediated protection against tuberculosis in rhesus macaques

Affiliations

Airway T cells are a correlate of i.v. Bacille Calmette-Guerin-mediated protection against tuberculosis in rhesus macaques

Patricia A Darrah et al. Cell Host Microbe. .

Abstract

Bacille Calmette-Guerin (BCG), the only approved Mycobacterium tuberculosis (Mtb) vaccine, provides limited durable protection when administered intradermally. However, recent work revealed that intravenous (i.v.) BCG administration yielded greater protection in macaques. Here, we perform a dose-ranging study of i.v. BCG vaccination in macaques to generate a range of immune responses and define correlates of protection. Seventeen of 34 macaques had no detectable infection after Mtb challenge. Multivariate analysis incorporating longitudinal cellular and humoral immune parameters uncovered an extensive and highly coordinated immune response from the bronchoalveolar lavage (BAL). A minimal signature predicting protection contained four BAL immune features, of which three remained significant after dose correction: frequency of CD4 T cells producing TNF with interferon γ (IFNγ), frequency of those producing TNF with IL-17, and the number of NK cells. Blood immune features were less predictive of protection. We conclude that CD4 T cell immunity and NK cells in the airway correlate with protection following i.v. BCG.

Keywords: NK; T cell; adaptive immunity; correlates; lung; mucosal; tuberculosis vaccine.


Conflict of interest statement

Declaration of interests The authors declare no competing interests.

Figures
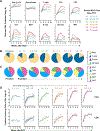
Figure 1.
Figure 1.. Serial assessment of total cells and antigen-specific T cells in BAL after varied IV BCG vaccination doses.
Rhesus macaques were vaccinated with half-log increasing doses of IV BCG between 4.5 and 7.5 log10 CFU; binned dose groups (with number of animals per bin) are color coded. BAL was collected before (Pre; P) and 2, 4, 8, and 12 weeks after vaccination. (A) Geometric mean number (log10) of total cells (live, nucleated cell counts) or selected leukocyte subsets (identified by flow cytometry) in the BAL before and after IV BCG are shown for each binned dose group. See also Figure S3 and S4A. (B and C) Average proportions of indicated live leukocyte (B) or CD3+ T cell (C) subset in BAL for animals in each dose group at 2 – 4 weeks after IV BCG. See also Figures S4B and S4C. (D) Number (log10) of memory CD4 (top) or CD8 (bottom) T cells in BAL producing IFNγ, IL2, TNF, or IL-17 following in vitro stimulation with mycobacterial antigens (purified protein derivative; PPD) as identified by flow cytometry. Shown are individual (thin grey lines) and median (thick colored lines) responses for macaques in each dose group before and after IV BCG. See also Figure S6 and S7.
Figure 2.
Figure 2.. Mycobacterial-specific T cell responses in PBMC after varied IV BCG vaccination doses.
(A) Frequency of memory CD4 (top) or CD8 (bottom) T cells in PBMC producing IFNγ, IL-2, TNF, or IL-17 following in vitro stimulation with mycobacterial antigens (whole cell lysate; WCL) as identified by flow cytometry. Shown are individual (thin grey lines) and median (thick colored lines) responses for macaques in each IV BCG binned dose group before (Pre, P) and 2, 4, 12, and 24 weeks after IV BCG. See also Figure S8. (B) Number of IFNγ spot forming units (SFU) per 200,000 cells in each dose group following stimulation of PBMC with mycobacterial antigens (culture filtrate protein, CFP) at the time of Mtb challenge (24 weeks); symbols represent individual animals and lines are medians.
Figure 3
Figure 3. Mycobacterial-specific antibody responses in blood and BAL after varied IV BCG doses.
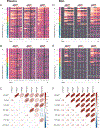
(A–B) Heatmaps of lipoarabinomannan (LAM)- (A) and PPD- (B) specific IgG1, IgA, and IgM antibody titers in the plasma of individual macaques (ordered by binned dose group) following IV BCG vaccination and Mtb challenge (24 weeks). (D–E) Heatmaps of LAM- (D) and PPD- (E) specific IgG1, IgA, and IgM antibody titers in the BAL after IV BCG. Titers (average of duplicate samples) are shown as the log2 fold change in Luminex MFI over the pre-vaccination (Pre) level. (C–F) Correlation matrices including IV BCG dose and each antibody measurement in the plasma (C) and BAL (F). Positive correlations are red; negative correlations are blue. Values represent the Spearman’s correlation coefficient. Ellipses have their eccentricity parametrically scaled to the strength of the relationship with statistical significance (unadjusted p-value) indicated: < 0.05 (*), < 0.01 (**), < 0.001 (**), < 0.0001 (***), < 0.00001 (****).
Figure 4.
Figure 4.. Outcomes of Mtb infection after varied IV BCG vaccination doses.
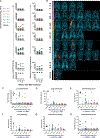
(A) Lung inflammation (FDG activity) and number of lung granulomas over the course of infection measured by monthly PET CT scans for each macaque in each binned IV BCG dose group. Lines connect the same animal over time. (B) Three-dimensional volume renderings of PET CT scans of the thoracic cavity of each macaque, arranged by dose group, just prior to necropsy. Areas of increasing orange/red coloring indicate FDG retention. TNTC, too numerous to count. (C) Total lung FDG activity from pre-necropsy scan. (D-H) Outcome data from necropsy: number of lung granulomas found at necropsy (D); total gross pathology score (E); pathology scores for lung (F), lymph node (G) and extra-pulmonary tissues (H). Dashed line in (E) and (G) is assumed normal pathology score accounting for variability in thoracic lymph node size in healthy rhesus macaques. Symbols represent individual macaques. Data points within grey areas are zero. Open black symbols indicate unvaccinated (Unvax) historical controls. TNTC, too numerous to count. Nonparametric bivariate correlations between outcomes and dose shown with Kendall’s τ and corresponding p-value (blue).
Figure 5.
Figure 5.. Mtb bacterial burdens after infection of IV BCG vaccinated macaques.
(A–C), Mtb bacterial burden (CFU) from the thoracic cavity of rhesus macaques necropsied 12 weeks post-challenge; total thoracic (A), lungs (B), or thoracic lymph nodes (C). Open symbols represent historical unvaccinated controls and star-shaped symbols indicate predicted total thoracic CFU based on total thoracic lung inflammation from PET-CT. Data points within grey areas are zero. Sterility was defined 0 thoracic CFU while protection was defined as <100 thoracic CFU. Nonparametric bivariate correlations between outcomes and dose (Kendall’s τ and corresponding p-value). (D) PBMC IFNγ ELISpots to antigens present in Mtb but not BCG (ESAT-6 and CFP-10). Lines shows individual macaques over time for each binned dose group. Dashed horizonal line represents the cut-off below which at least 95% of uninfected animals fall. See also Figure S10A. (E) Percentage of sterile or non-sterile macaques either positive or negative by ELISpot. Fisher’s exact test p-value (two-sided).
Figure 6.
Figure 6.. Selected immune parameters from BAL distinguish protection in IV BCG vaccinated macaques.
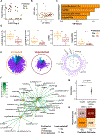
(A–D) PLSDA following LASSO was applied to identify immune features in BAL (L, lung) that distinguish protected and unprotected animals. (A) Animals with <100 total thoracic Mtb CFU (n=18) were defined as protected (Yes, orange). (B) The PLSDA scores plot shows the degree of discrimination between protected and unprotected animals following LASSO feature selection; symbols represent individual macaques, and ellipses indicate 95% confidence regions assuming a multivariate t distribution. (C) VIP (variable importance in projection) scores of the 4 LASSO-selected features that together discriminate protection. (D) Univariate box plots show the distribution of each selected feature in protected or unprotected animals. Boxes show IQR (interquartile range) with median (line) and whiskers (1.5*IQR). * p < 0.05, ** p <0.01, *** p <0.001, **** p < 0.0001 (Wilcoxin). (E) Polar plots depict the mean percentile of each measurement across the protected and the unprotected groups. Wedge distance from center depicts the mean percentile from 0 – 0.75 with a step of 0.25. (F) A correlation network shows the immune features (grey nodes) that are significantly co-correlated (p < 0.05 after Benjamini-Hochberg correction; Spearman’s > 0.7) with model-selected features (orange nodes) from panel (C). See also Table S3. (G–H) Model performance and robustness are validated with permutation testing and confusion matrix. (G) The violin plot shows the distributions of repeated classification accuracy testing using label permutation (two-sided p-value). Black squares show median accuracy and black lines represent one SD. (H) Average confusion matrix of the PLSDA model with Matthews correlation coefficient (MCC).
Figure 7.
Figure 7.. Immune features in BAL and blood associate with protection after controlling for IV BCG dose.
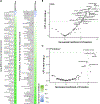
(A) Spearman’s correlation between each immune measurement in BAL (L, lung) or blood (P, PBMC or plasma) and IV BCG dose. Adjusted p values after Benjamini-Hochberg correction (* p < 0.05, ** p <0.01, *** p <0.001, **** p < 0.0001). (B and C) A nested mixed linear model was created for each immune measurement with and without a variable accounting for the animals’ protection group. The volcano plot shows the T-value (normalized coefficient) of protection incorporated in the mixed linear model (x-axis) vs the p-value of the likelihood ratio test (LRT) for the model fit difference between the two nested models (y-axis) using BAL- (B) and blood- (C) derived measurements. Positive T-values represent features enriched in the protected group. See also Table S3.

References

    1. Martinez L, Cords O, Liu Q, Acuna-Villaorduna C, Bonnet M, Fox GJ, Carvalho ACC, Chan PC, Croda J, Hill PC, et al. (2022). Infant BCG vaccination and risk of pulmonary and extrapulmonary tuberculosis throughout the life course: a systematic review and individual participant data meta-analysis. Lancet Glob Health 10, e1307–e1316. 10.1016/S2214-109X(22)00283-2. - DOI - PMC - PubMed
    1. Carpenter SM, and Lu LL (2022). Leveraging Antibody, B Cell and Fc Receptor Interactions to Understand Heterogeneous Immune Responses in Tuberculosis. Frontiers in immunology 13, 830482. 10.3389/fimmu.2022.830482. - DOI - PMC - PubMed
    1. Sia JK, and Rengarajan J (2019). Immunology of Mycobacterium tuberculosis Infections. Microbiol Spectr 7. 10.1128/microbiolspec.GPP3-0022-2018. - DOI - PMC - PubMed
    1. Bellamy R (2003). Susceptibility to mycobacterial infections: the importance of host genetics. Genes Immun 4, 4–11. 10.1038/sj.gene.6363915. - DOI - PubMed
    1. Godfrey MS, and Friedman LN (2019). Tuberculosis and Biologic Therapies: AntiTumor Necrosis Factor-alpha and Beyond. Clin Chest Med 40, 721–739. 10.1016/j.ccm.2019.07.003. - DOI - PubMed