. 2023 Jun 28;43(26):4907-4925.
doi: 10.1523/JNEUROSCI.1894-22.2023. Epub 2023 Jun 2.

Restoration of Sleep and Circadian Behavior by Autophagy Modulation in Huntington's Disease

Affiliations

Restoration of Sleep and Circadian Behavior by Autophagy Modulation in Huntington's Disease

Ankit Sharma et al. J Neurosci. .

Abstract

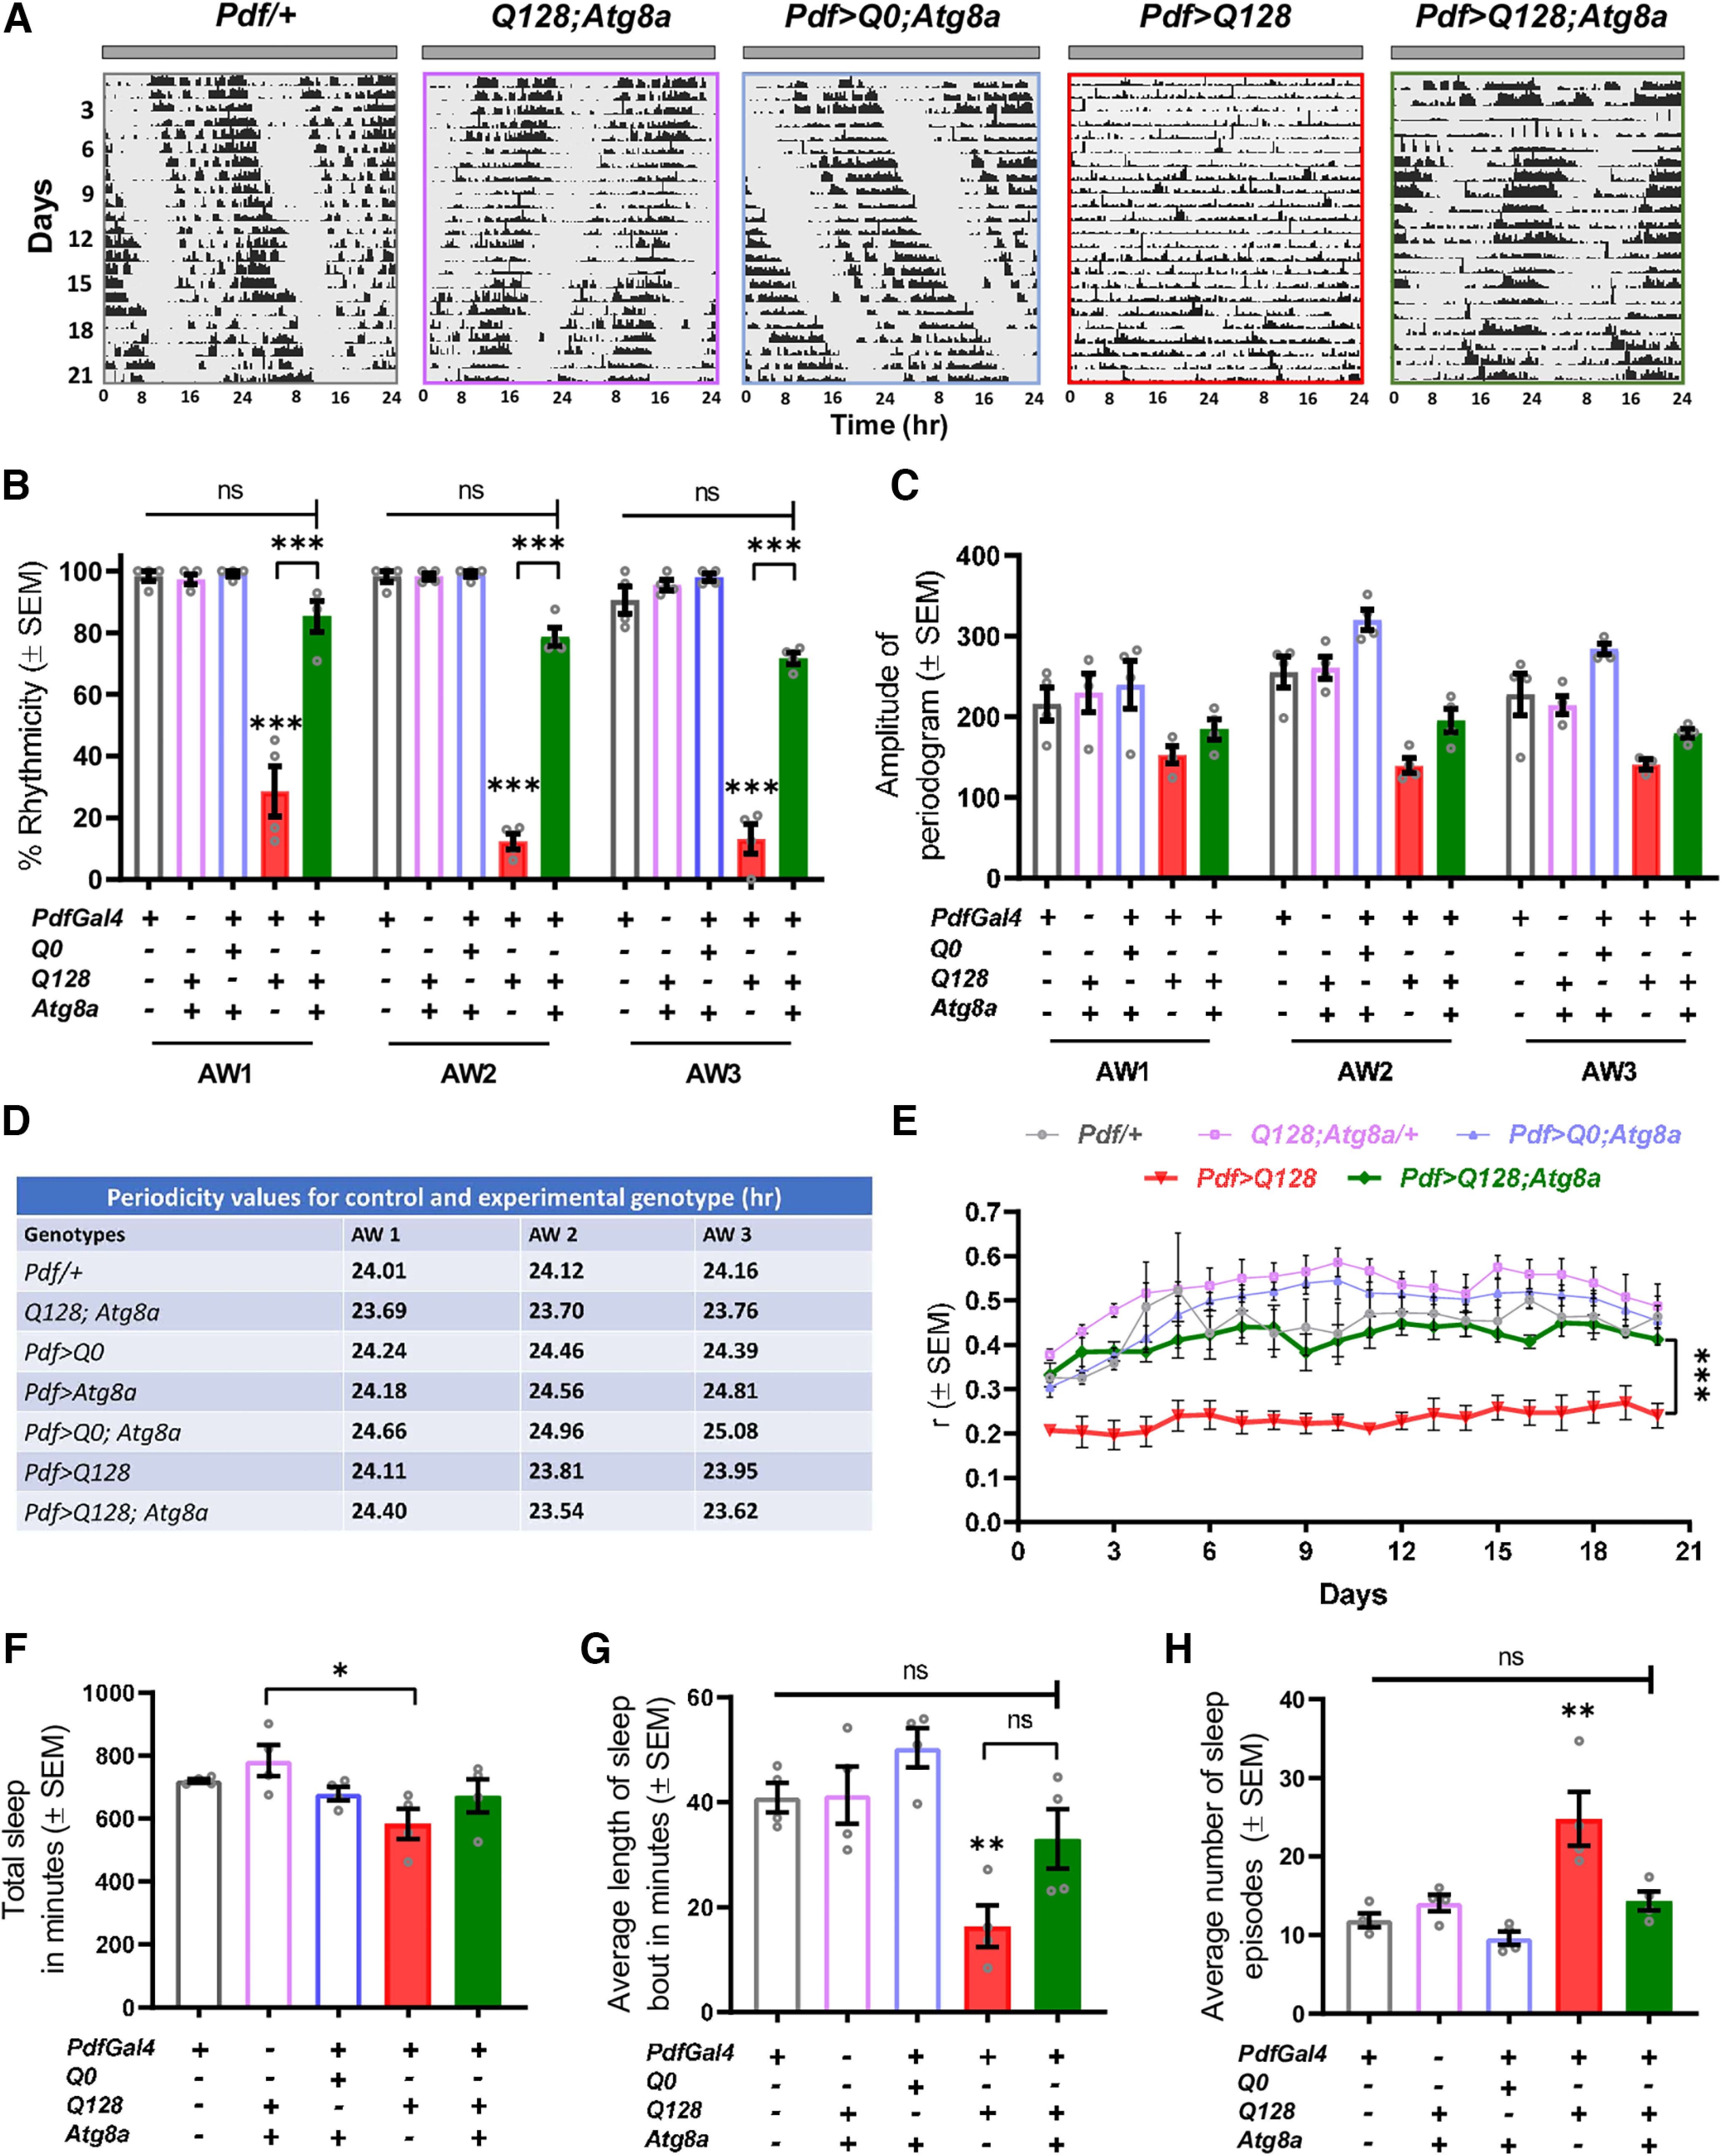
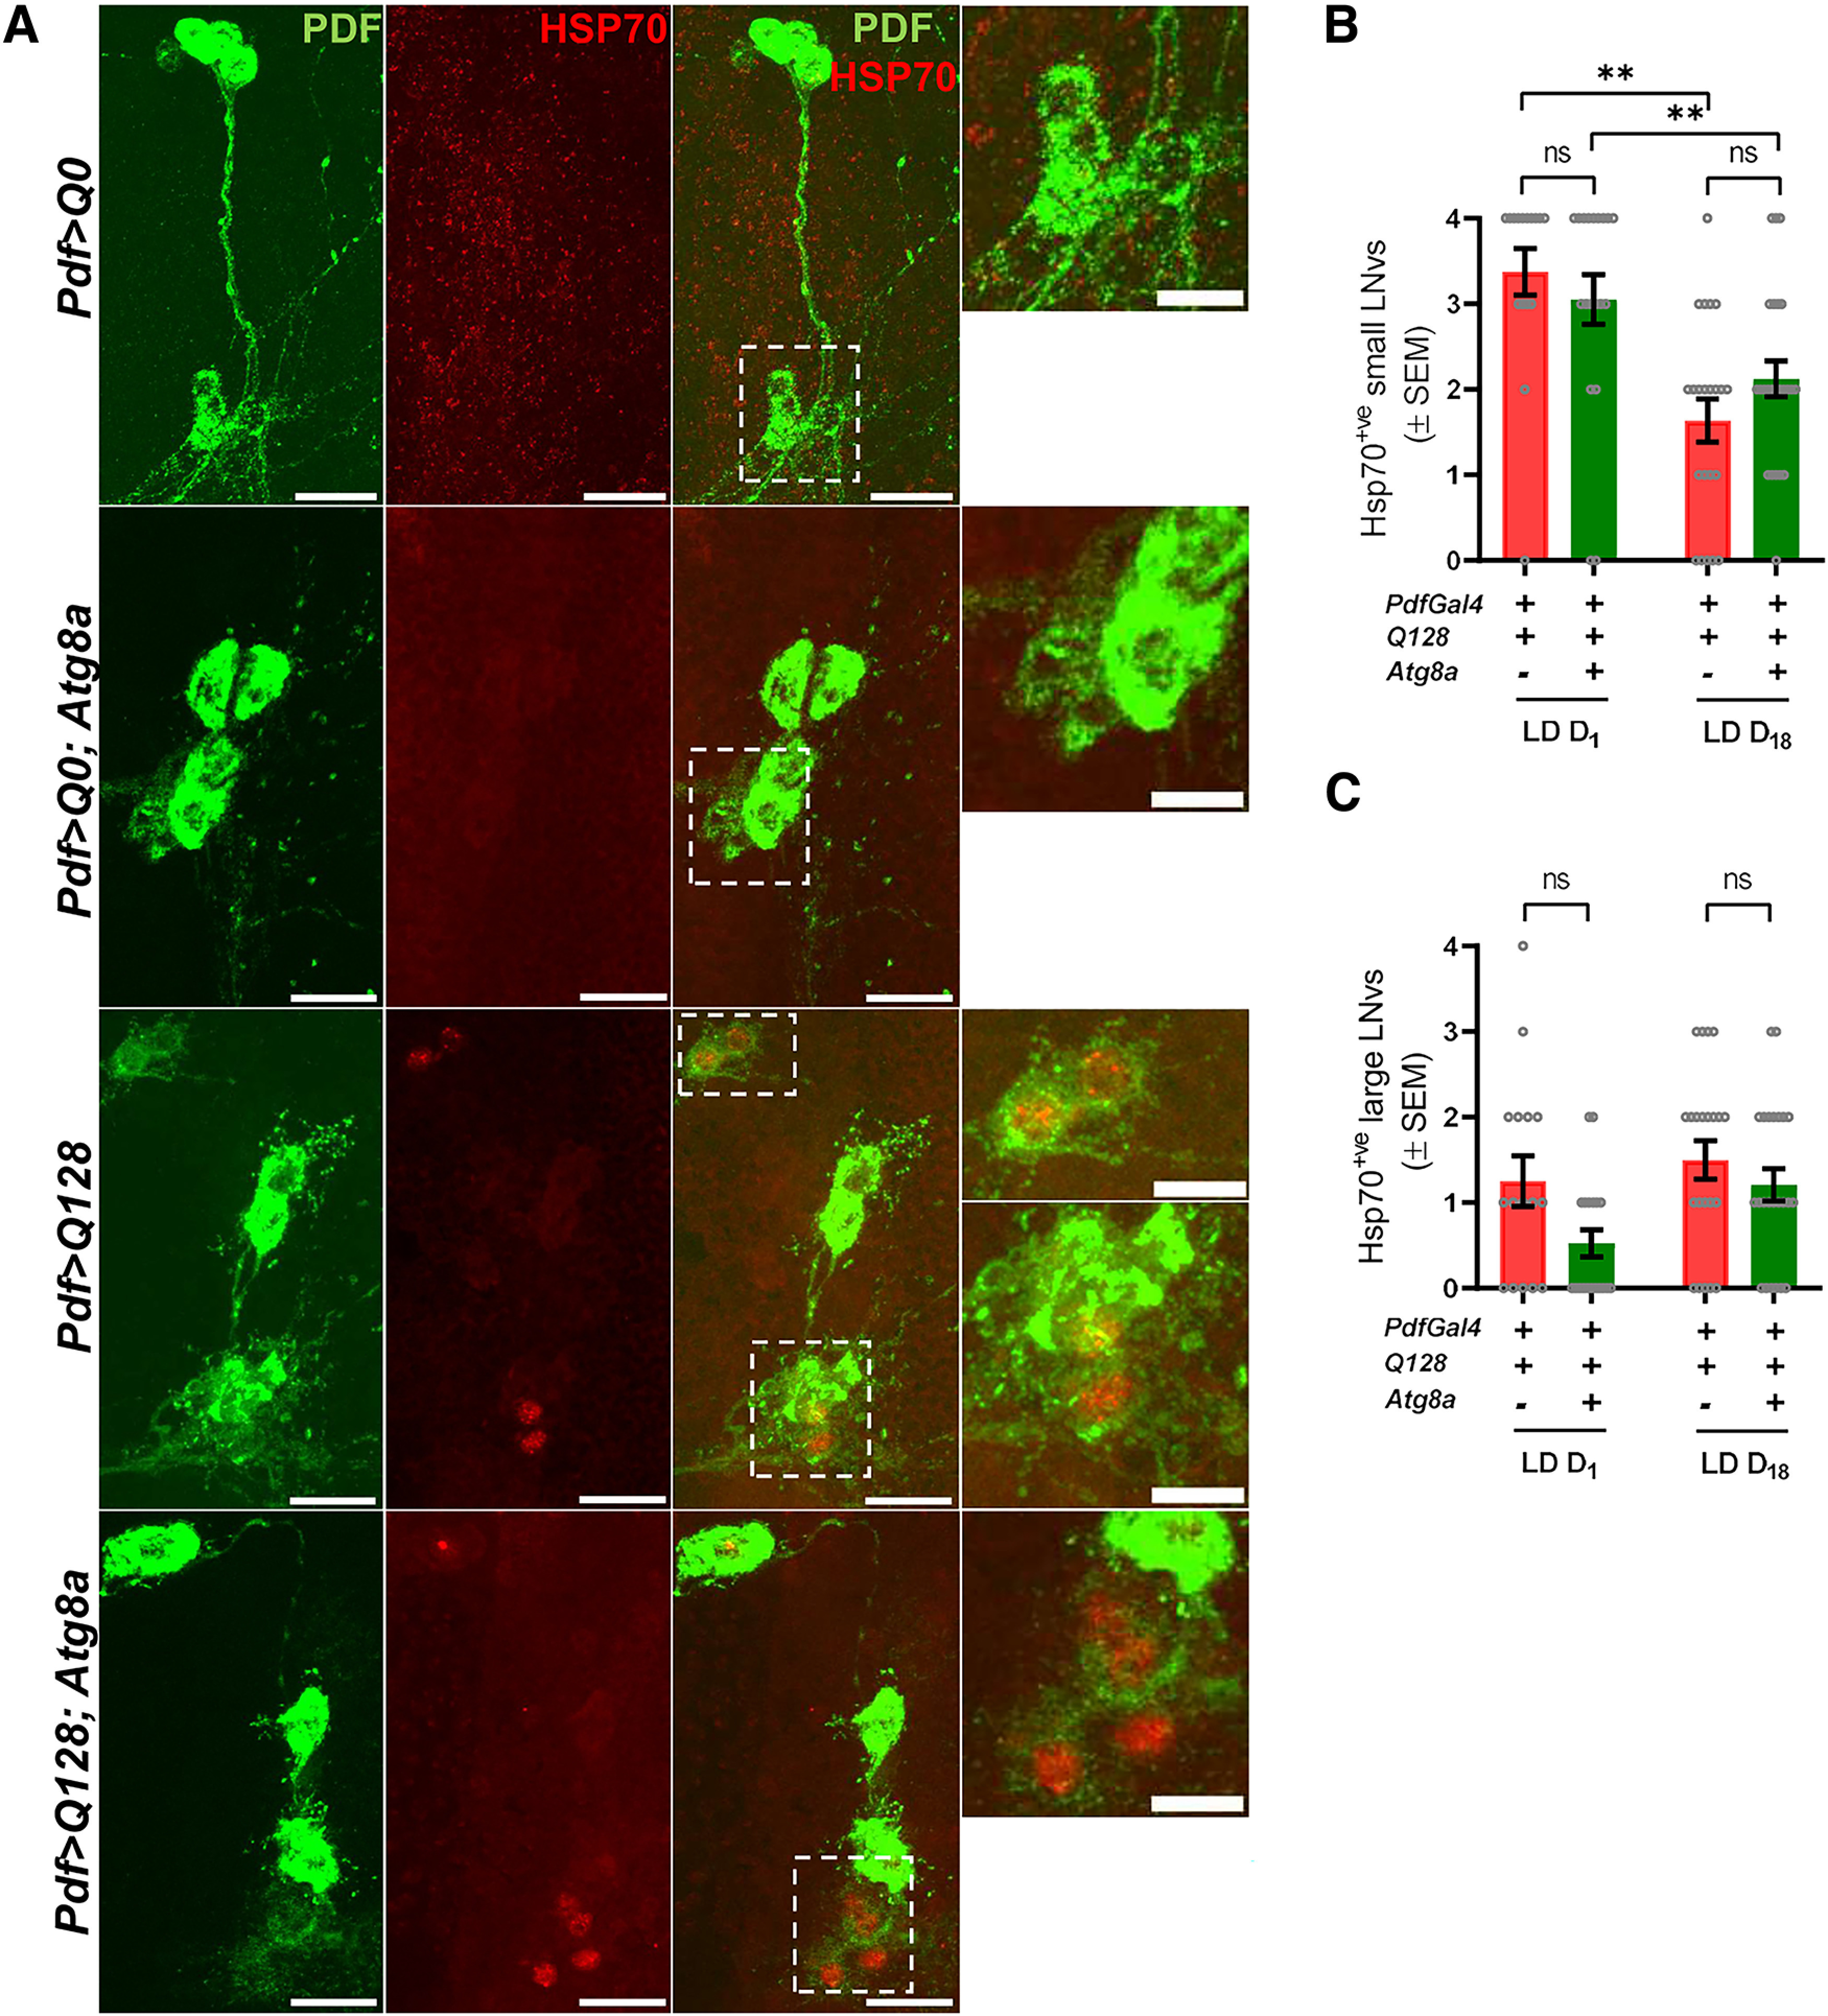
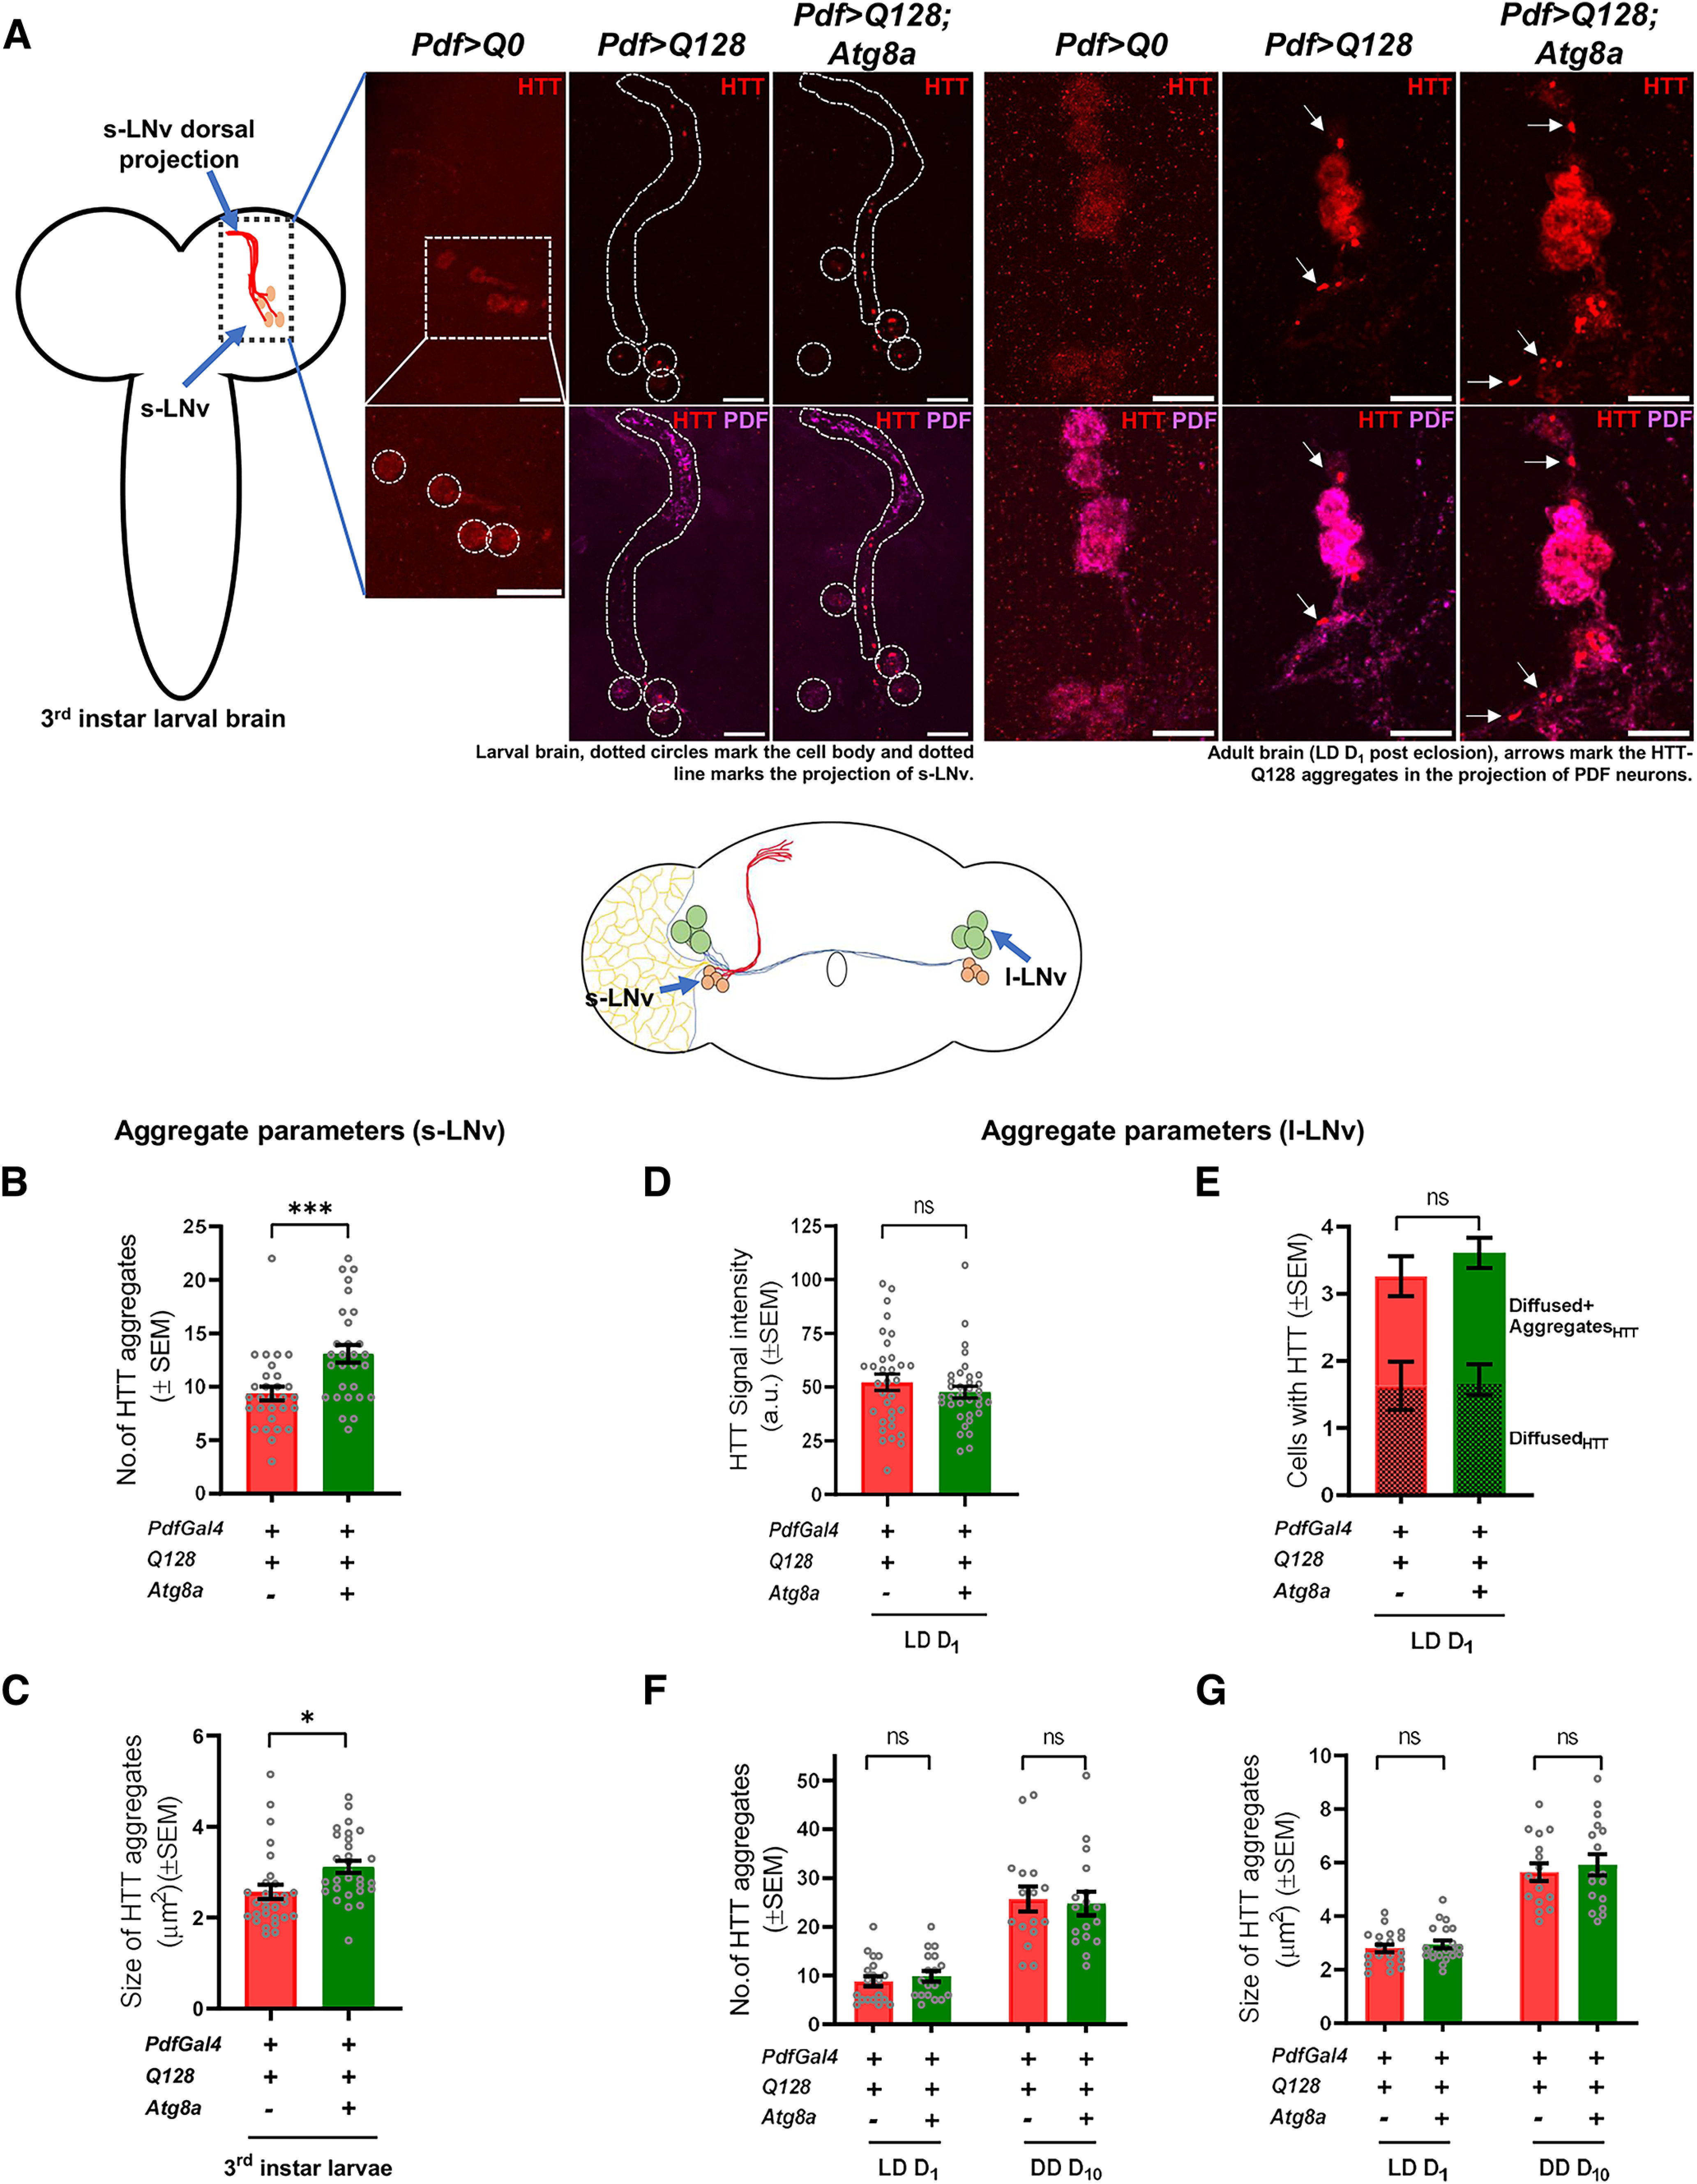
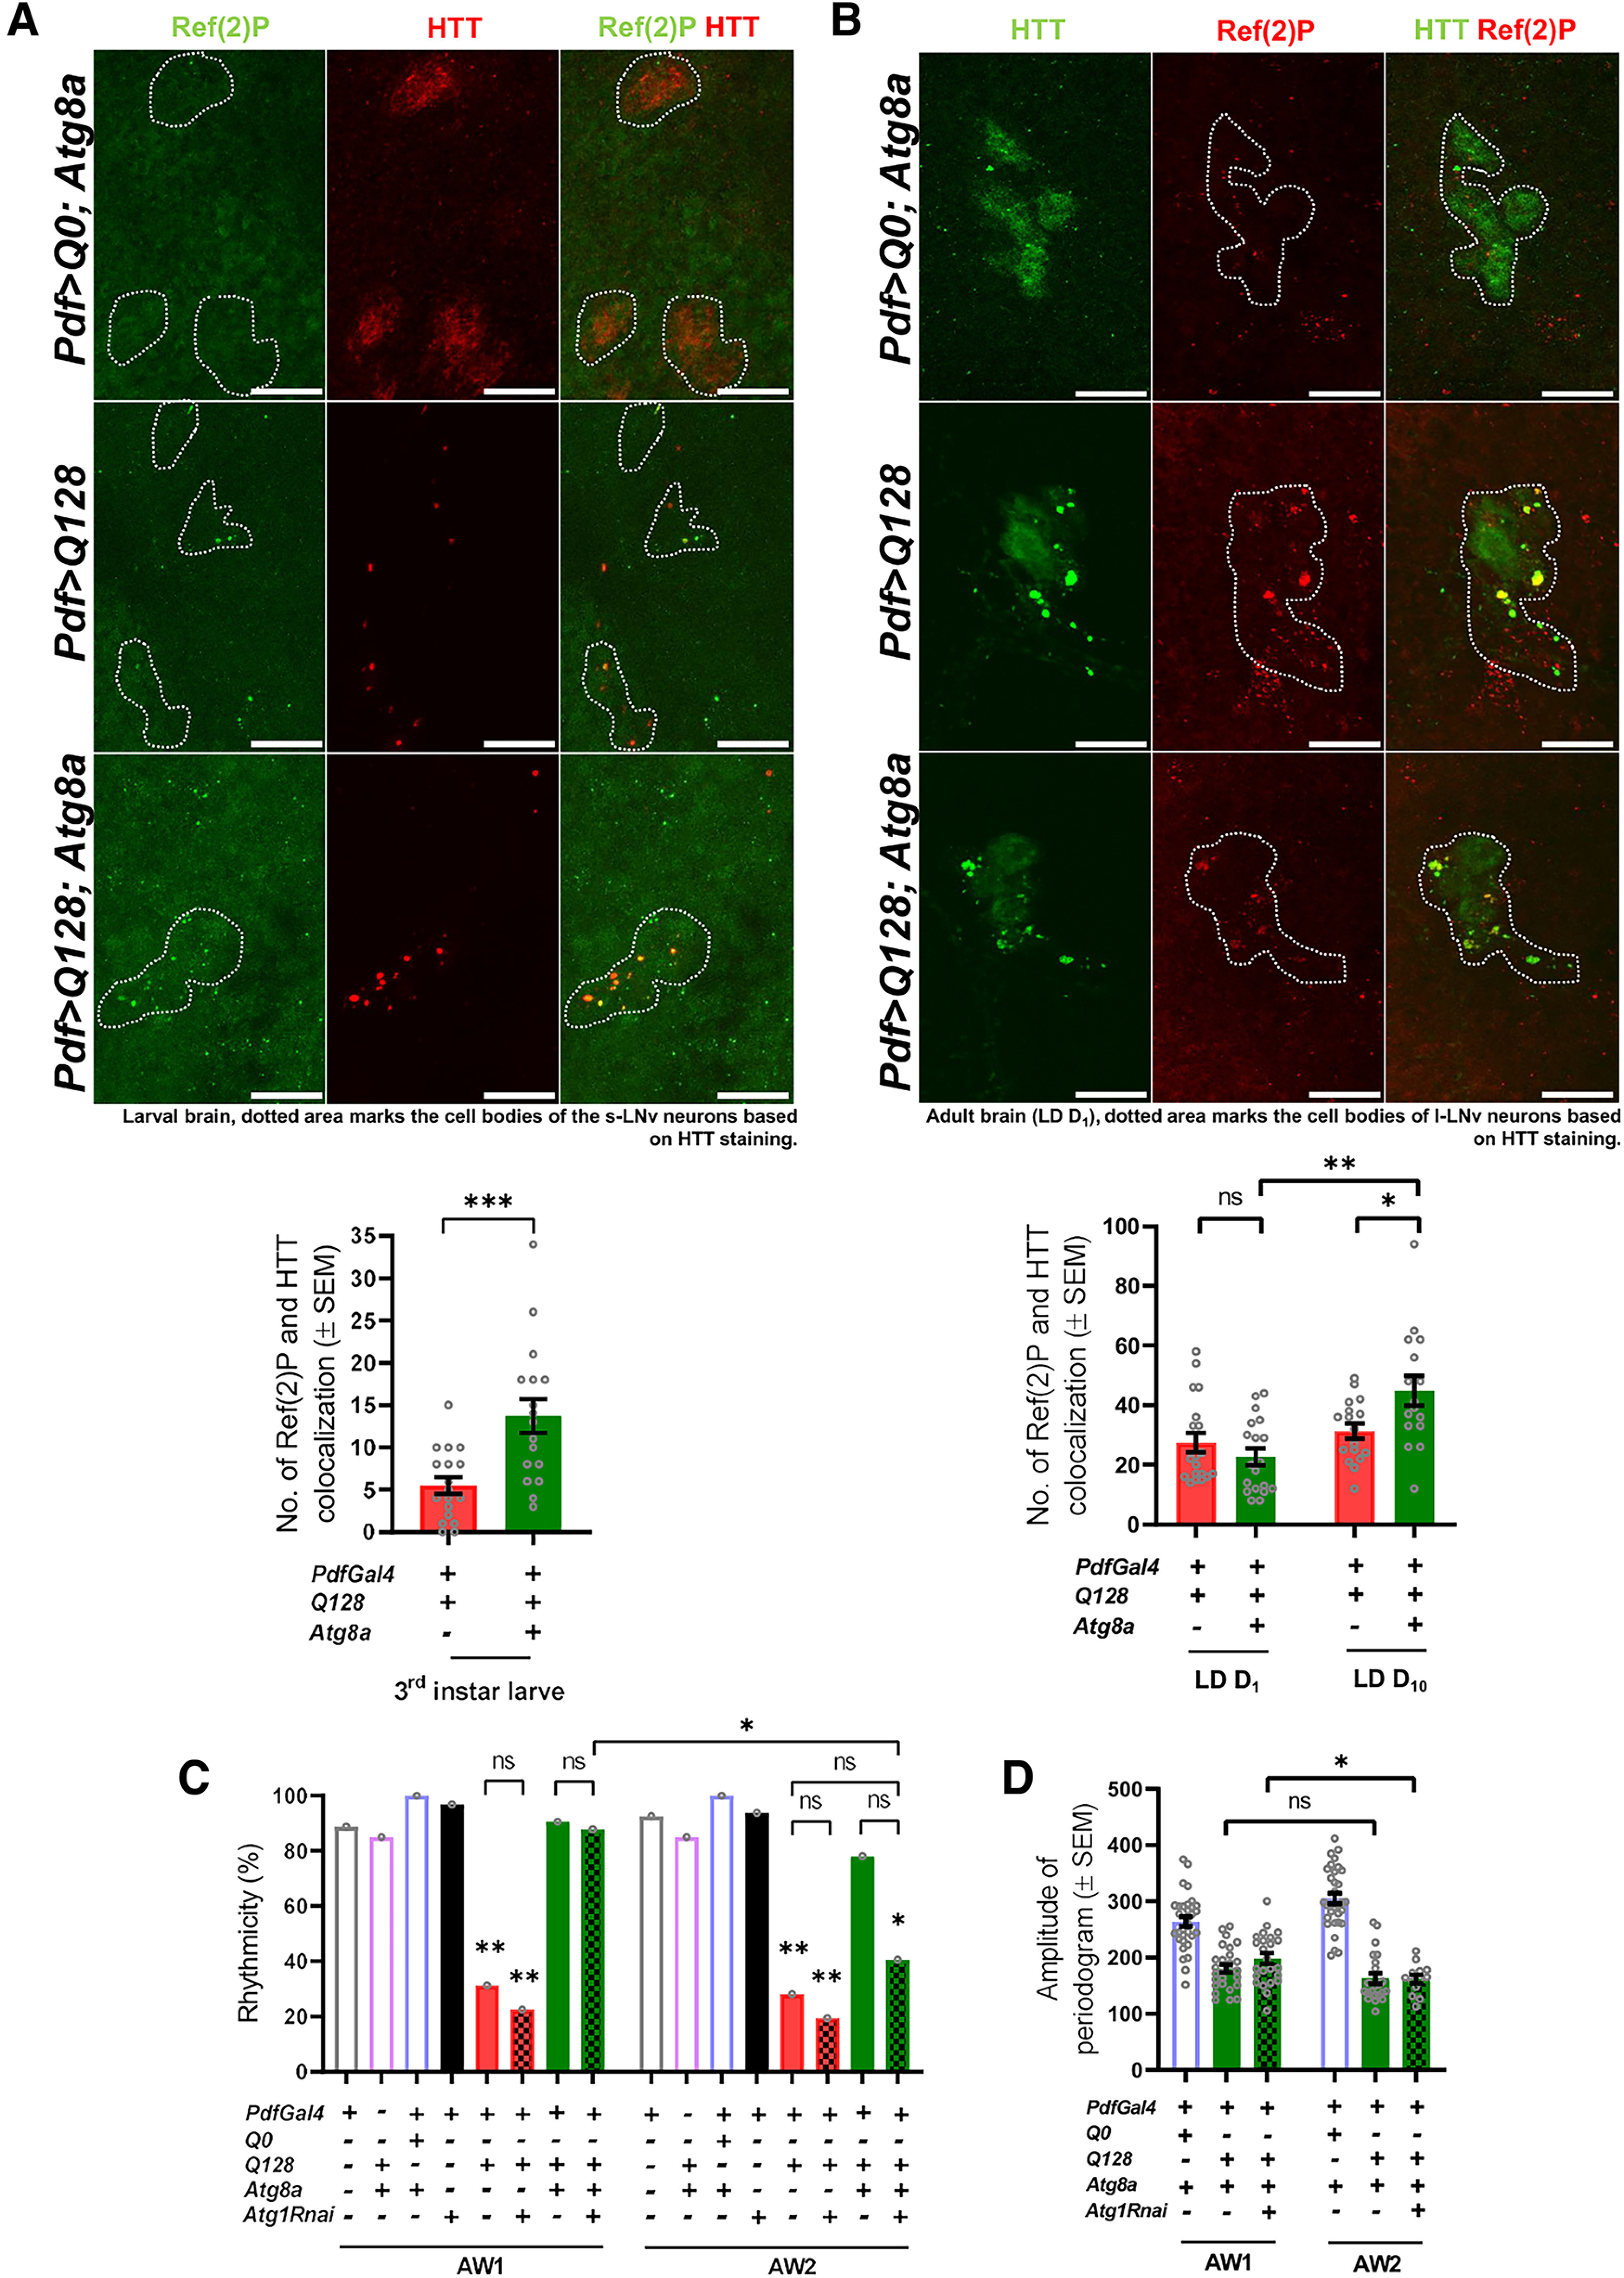
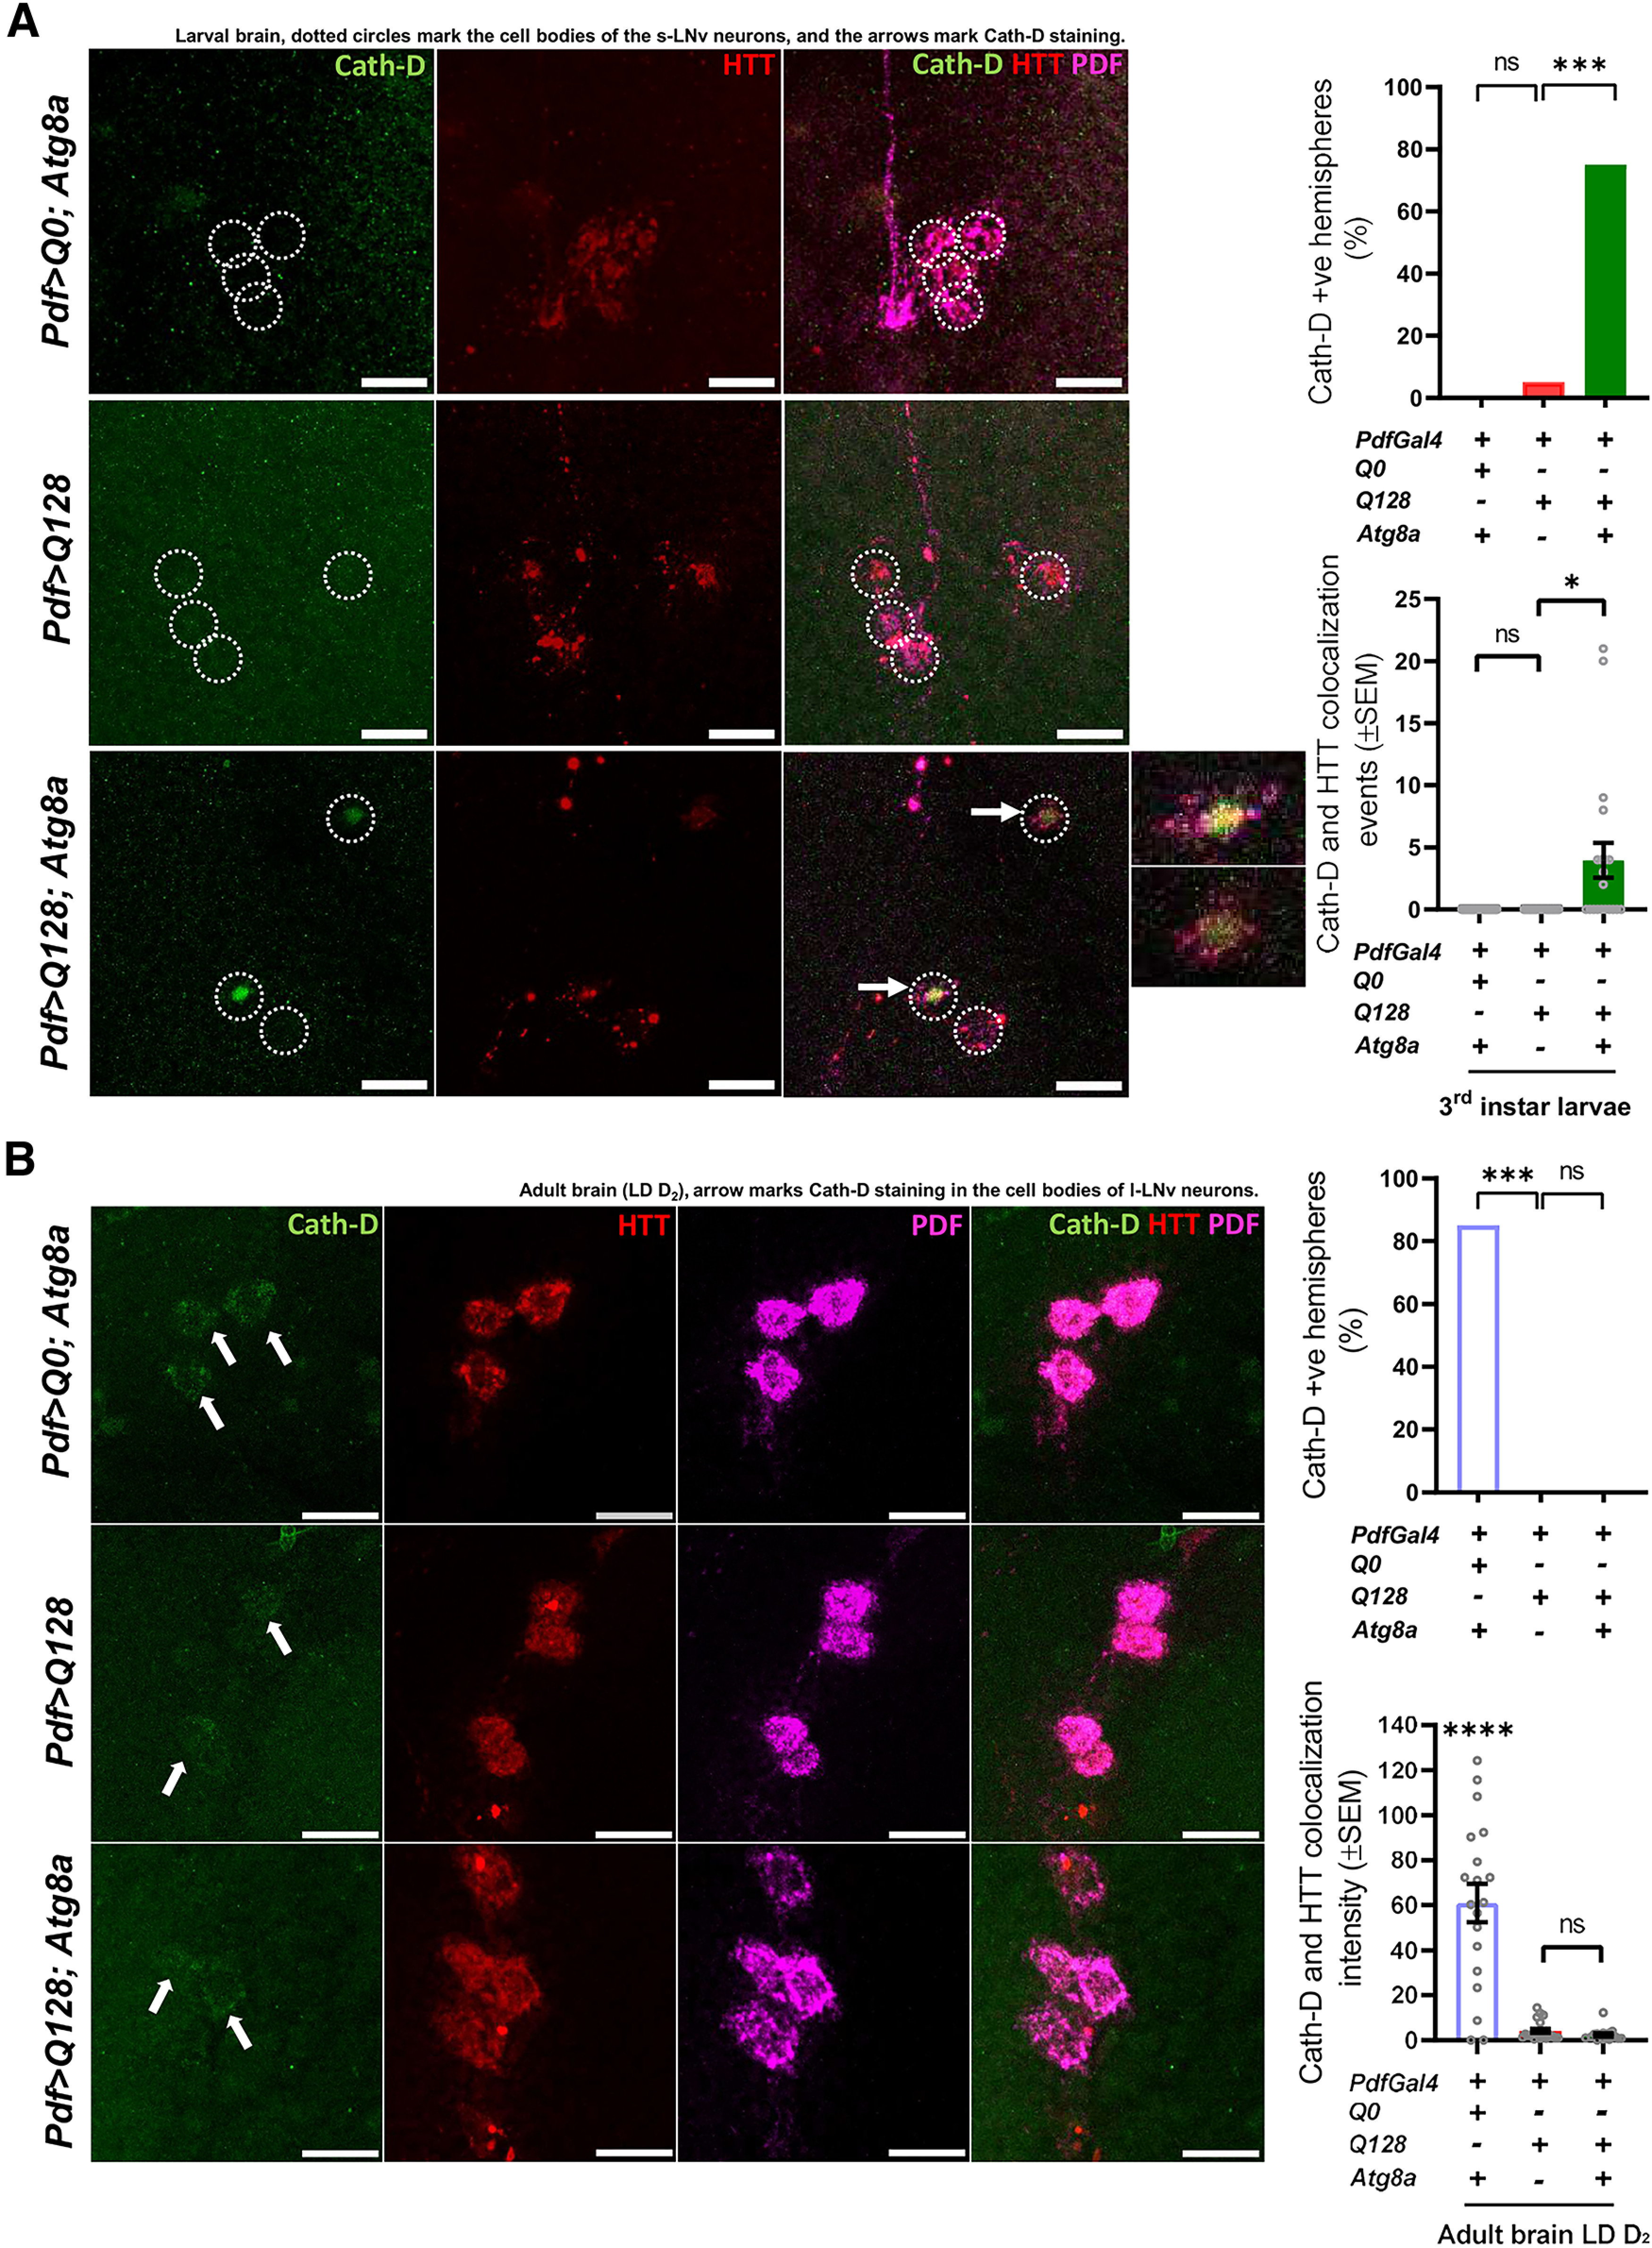
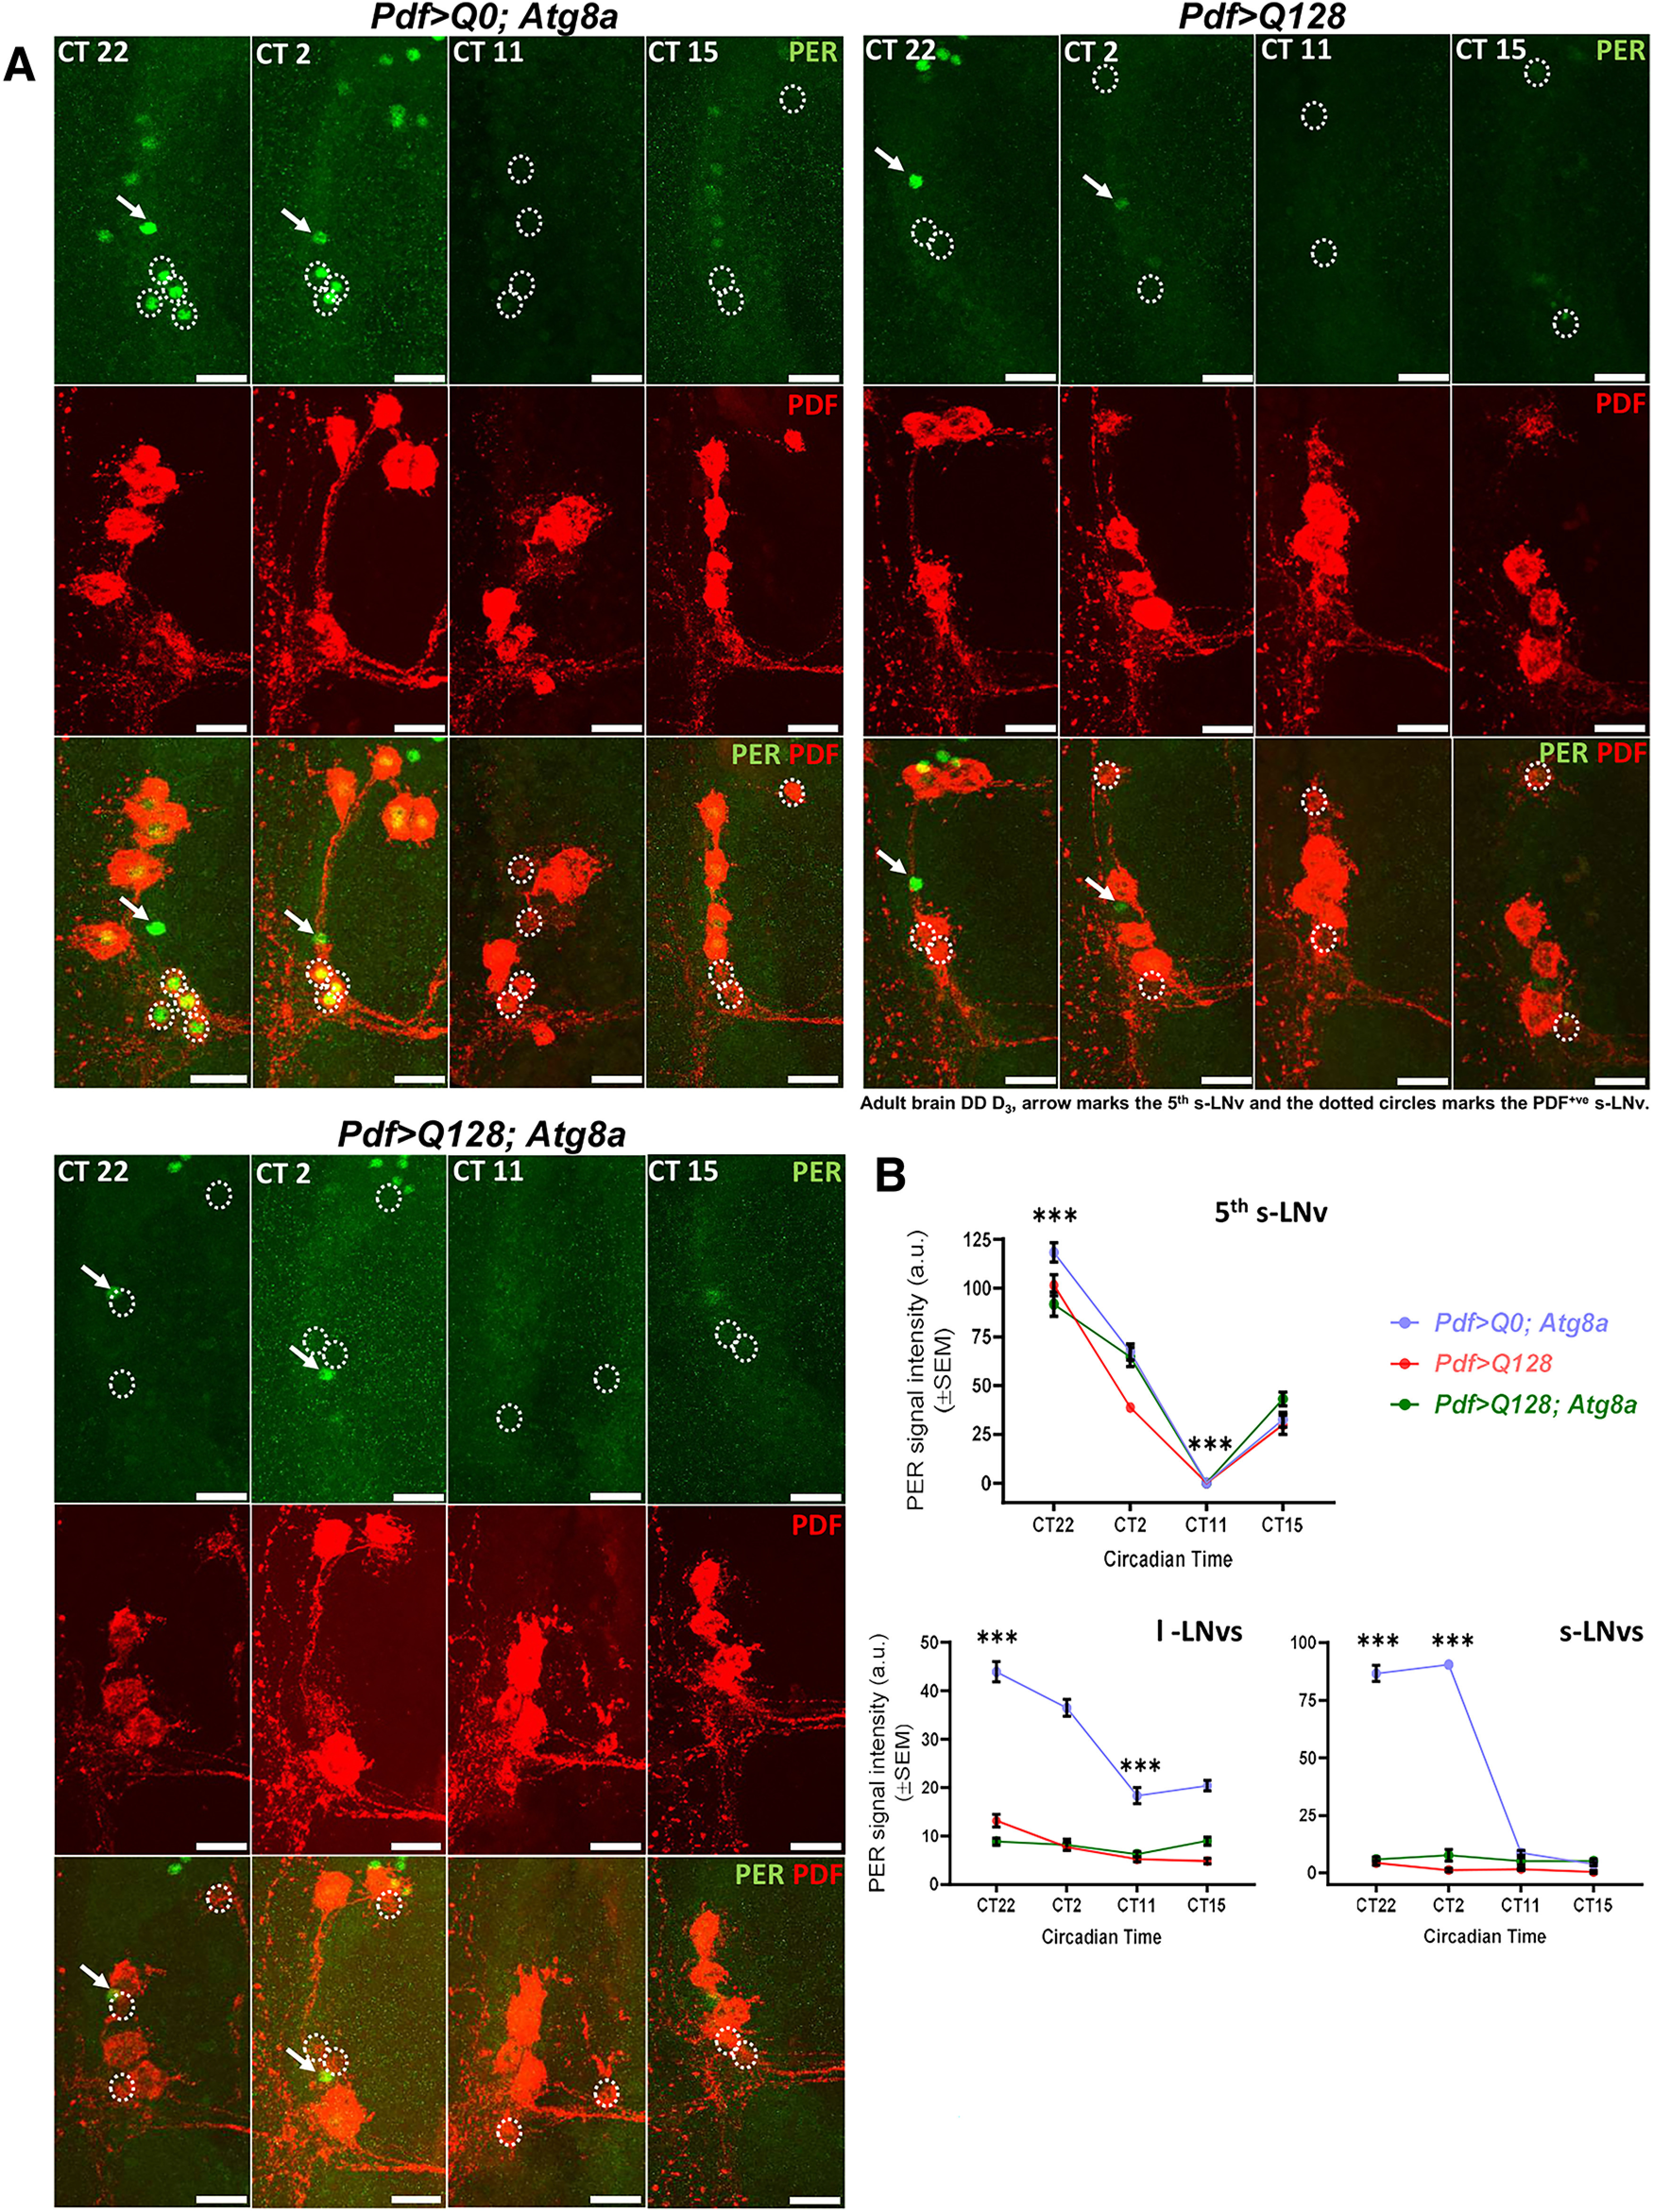
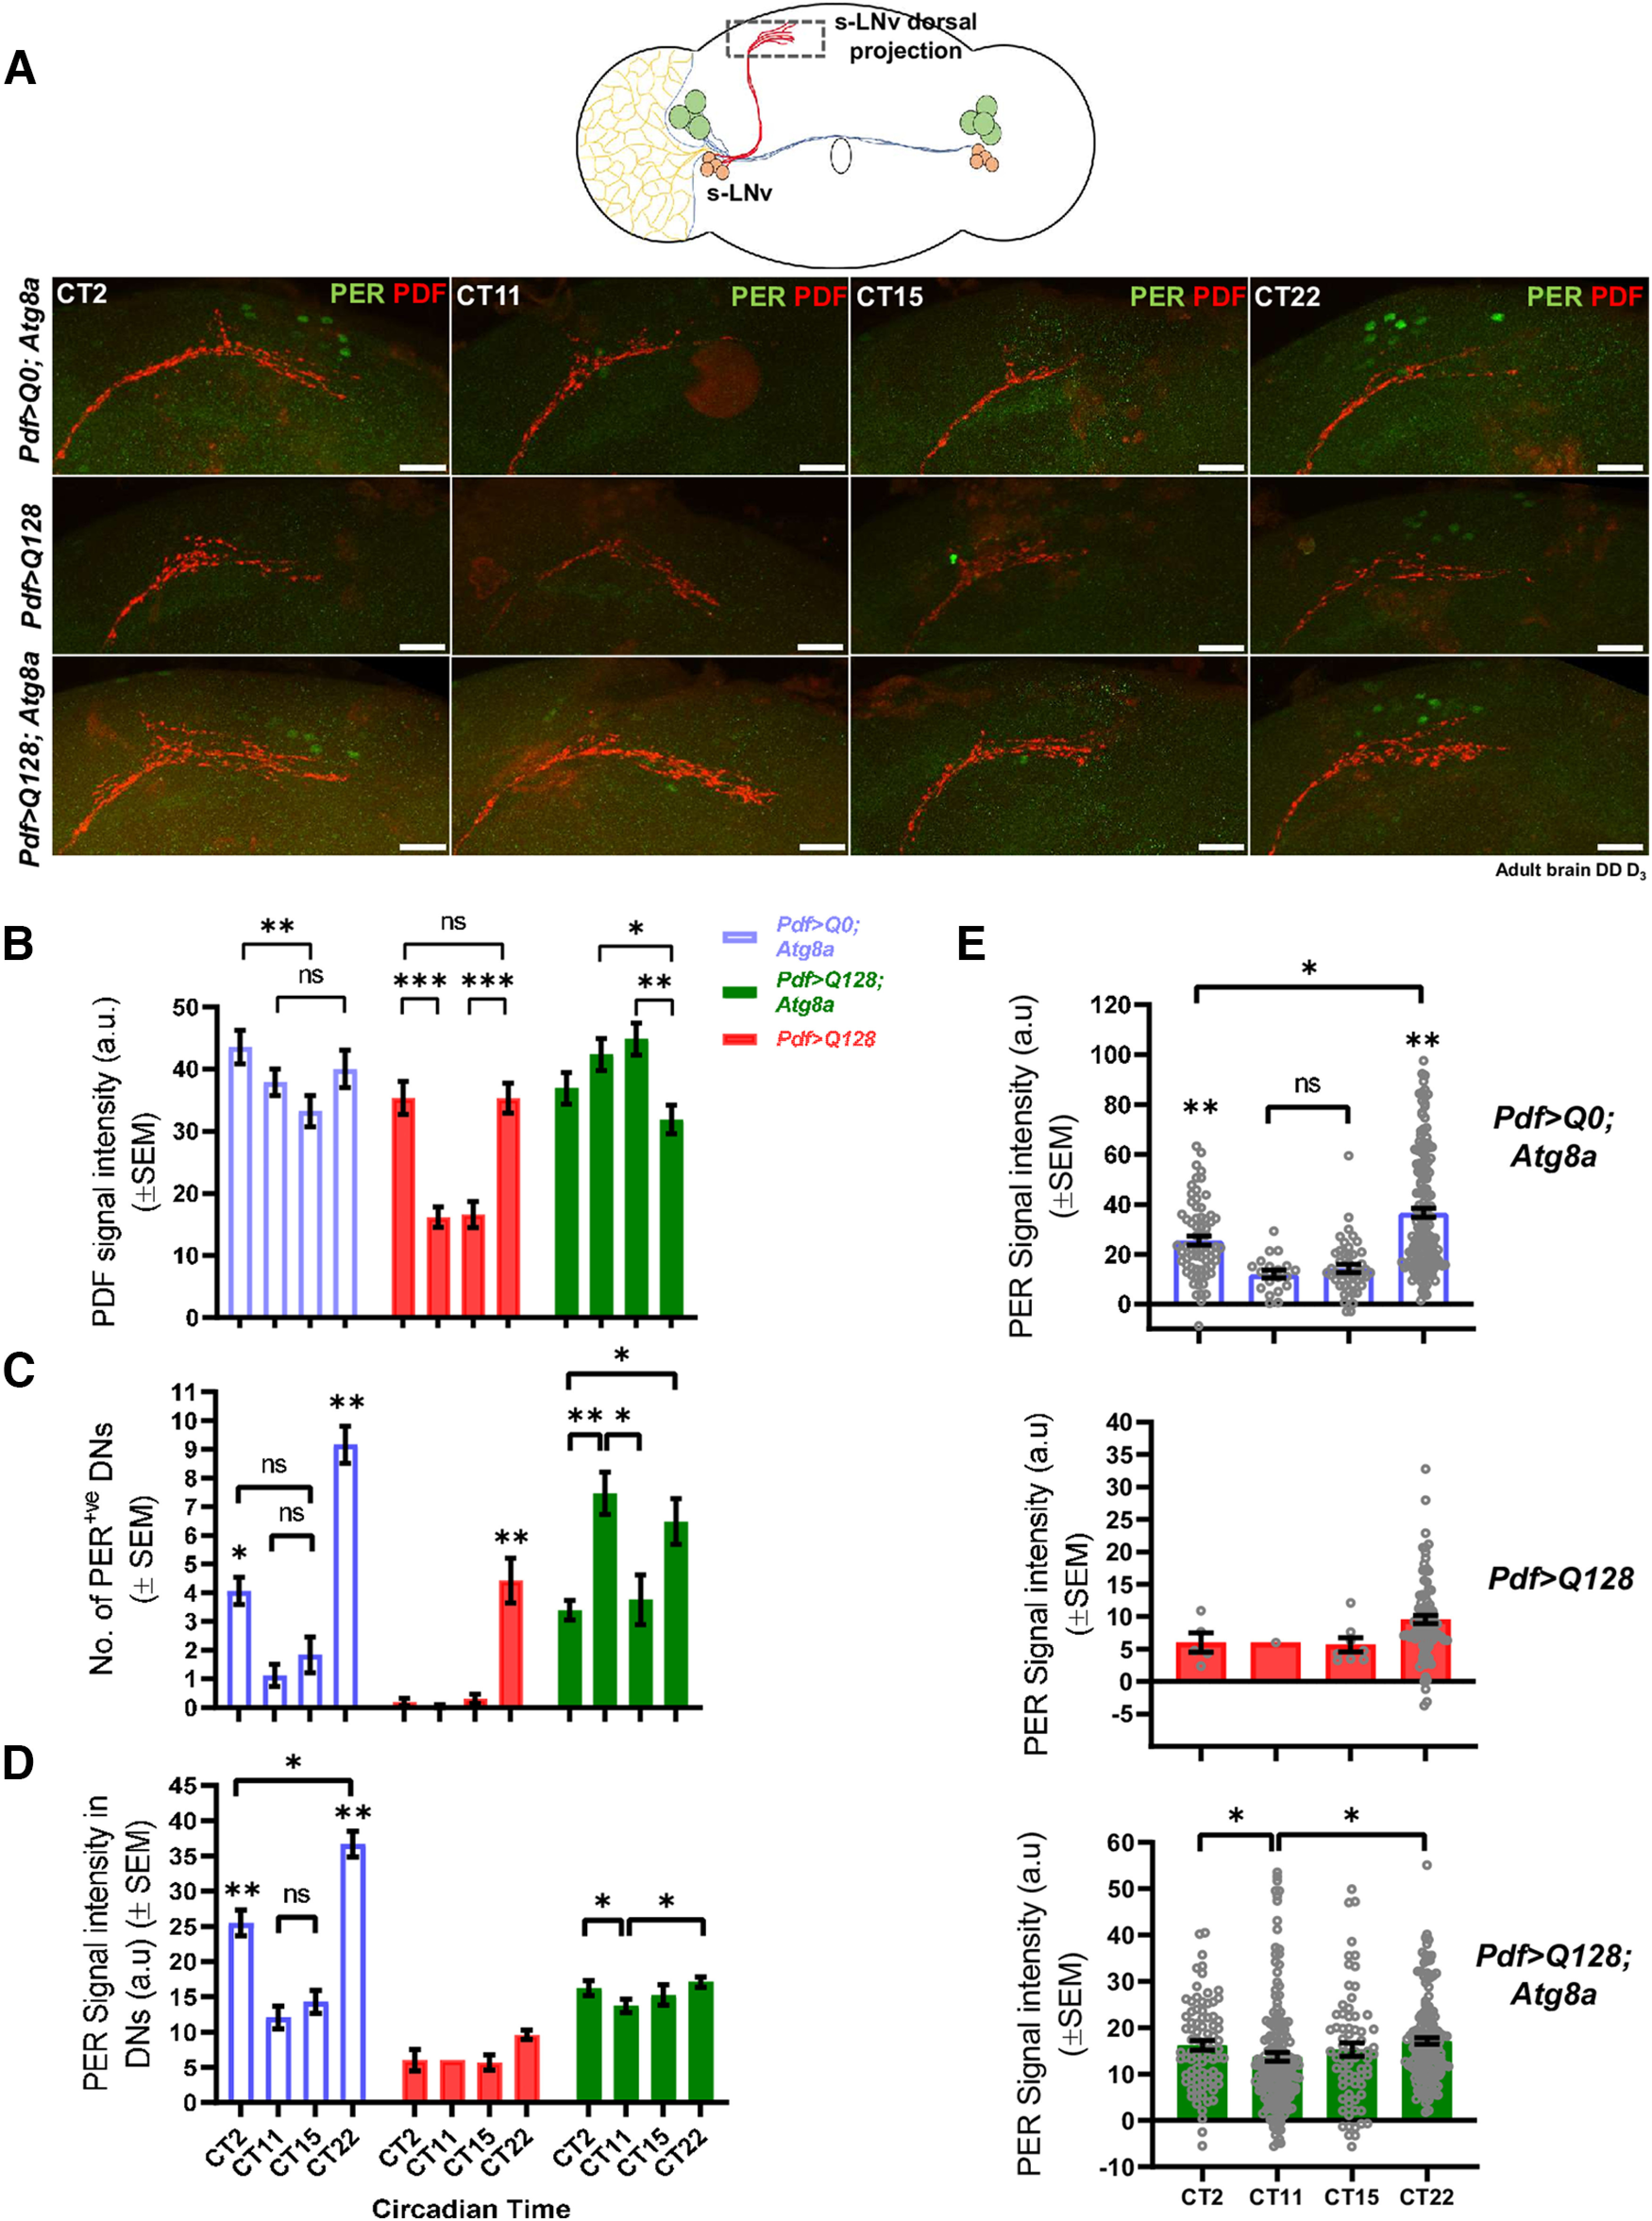
Circadian and sleep defects are well documented in Huntington's disease (HD). Modulation of the autophagy pathway has been shown to mitigate toxic effects of mutant Huntingtin (HTT) protein. However, it is not clear whether autophagy induction can also rescue circadian and sleep defects. Using a genetic approach, we expressed human mutant HTT protein in a subset of Drosophila circadian neurons and sleep center neurons. In this context, we examined the contribution of autophagy in mitigating toxicity caused by mutant HTT protein. We found that targeted overexpression of an autophagy gene, Atg8a in male flies, induces autophagy pathway and partially rescues several HTT-induced behavioral defects, including sleep fragmentation, a key hallmark of many neurodegenerative disorders. Using cellular markers and genetic approaches, we demonstrate that indeed the autophagy pathway is involved in behavioral rescue. Surprisingly, despite behavioral rescue and evidence for the involvement of the autophagy pathway, the large visible aggregates of mutant HTT protein were not eliminated. We show that the rescue in behavior is associated with increased mutant protein aggregation and possibly enhanced output from the targeted neurons, resulting in the strengthening of downstream circuits. Overall, our study suggests that, in the presence of mutant HTT protein, Atg8a induces autophagy and improves the functioning of circadian and sleep circuits.SIGNIFICANCE STATEMENT Defects in sleep and circadian rhythms are well documented in Huntington's disease. Recent literature suggests that circadian and sleep disturbances can exacerbate neurodegenerative phenotypes. Hence, identifying potential modifiers that can improve the functioning of these circuits could greatly improve disease management. We used a genetic approach to enhance cellular proteostasis and found that overexpression of a crucial autophagy gene, Atg8a, induces the autophagy pathway in the Drosophila circadian and sleep neurons and rescues sleep and activity rhythm. We demonstrate that the Atg8a improves synaptic function of these circuits by possibly enhancing the aggregation of the mutant protein in neurons. Further, our results suggest that differences in basal levels of protein homeostatic pathways is a factor that determines selective susceptibility of neurons.

Keywords: Atg8a; Drosophila circadian circuit; Huntington's disease; autophagy; pigment dispersing factor; sleep.


Figures

Figure 1.
Figure 1.
Atg8a overexpression in PDF+ lateral ventral neurons improves activity-rest rhythm in the presence of mutant HTT-Q128 protein. A, Representative double-plotted actograms for control (Pdf/+, Q128; Atg8a, Pdf>Q0; Atg8a) and experimental (Pdf>Q128, Pdf>Q128; Atg8a) genotypes, showing activity data for 21 d in DD at 25°C. (+) and (–) in the bar graphs represent the presence or absence, respectively, of the gene in the fly. B, Plot represents quantification of rhythmicity values from four independent replicate experiments for control and experimental genotypes (red bar, green bar) plotted across 3 AWs (AW1-AW3; 7 d each). Compared with the control genotypes, a significant decrease in percentage rhythmicity was observed in flies expressing mutant HTT-Q128 protein in PDF neurons. Further overexpression of Atg8a in the presence of mutant HTT-Q128 protein improves the number of rhythmic individuals in all 3 AWs, and the values were comparable to the control genotype. n > 16 flies for all the genotypes/replicate experiment. *p < 0.05. C, Plots represent mean amplitude values from four independent experiments plotted across 3 AWs (AW1-AW3; 7 d each) for all the genotypes. A significant difference was observed in the amplitude values of the control and Pdf>Q128; Atg8a (rescue) flies. Pdf>Q128 (mutant) genotype was not included in the analysis because of low rhythmic individuals. n > 16 flies for all the genotypes/replicate experiment. *p < 0.05. D, Table representing mean period values from three independent replicate experiments for control and experimental genotypes (red bar, green bar) for 3 AWs (AW1-AW3; 7 d each). Compared with control flies, overexpression of Atg8a in PDF neurons leads to a significant increase in clock period. Further, we observed an additive effect in the clock period value when both HTT-Q0 and Atg8a protein were expressed in the PDF neurons. However, no significant change was observed in the flies coexpressing mutant HTT-Q128 protein and Atg8a, and the values were comparable to the control flies. n > 16 flies for all genotypes/replicate experiment. E, Plot represents mean r values from four independent experiments plotted across 20 d for all the genotypes. Compared with control genotypes, a significant decrease was observed in the r values of mutant HTT-Q128 protein-expressing flies. A significant improvement in r value was observed on Atg8a overexpression in the presence of mutant HTT-Q128 protein, and the values were comparable to all control genotypes (except Q128; Atg8a). n > 16 flies for all the genotypes/replicate experiment. *p < 0.05. F, Plot represents mean values of total sleep from four independent experiments obtained by averaging total sleep across the first 4 d of the run for all the genotypes. Mutant HTT-Q128 expression and Atg8a coexpression in the PDF neurons does not affect the total sleep of the flies, and the values were comparable to all the control genotypes (except Q128; Atg8a). n > 16 flies for all the genotypes/replicate experiment. *p < 0.05. G, Plot represents mean values of length of sleep bout from four independent experiments obtained by averaging values across the first 4 d of the run for all the genotypes. Compared with control genotypes, mutant HTT-Q128 protein expression in PDF neurons led to a significant reduction in the length of sleep bouts of flies. Atg8a overexpression in the presence of mutant HTT-Q128 protein led to improvement in the length of sleep bouts; however, the values were not comparable to the control genotypes (except Pdf>Q0; Atg8a). n > 16 flies for all the genotypes/replicate experiment. *p < 0.05. H, Plot represents mean values of the number of sleep episodes from four independent experiments obtained by averaging the number of sleep episodes across the first 4 d of the run for all the genotypes. Compared with control genotypes, mutant HTT-Q128 protein expression in PDF neurons leads to a significant increase in the number of sleep episodes of flies. Atg8a overexpression in the presence of mutant HTT-Q128 protein significantly reduces the number of sleep episodes, and the values were comparable to all the control genotypes. n > 16 flies for all the genotypes/replicate experiment. *p < 0.05. Asterisk on individual genotypes indicates that the genotype is significantly different from all other plotted genotypes.
Figure 2.
Figure 2.
Atg8a overexpression in PDF+ lateral ventral neurons does not improve the levels of PDF neuropeptide in the small LNvs (s-LNv). A, Representative MIP images (day 1, adult brain) of PDF neurons (arrow indicates large neurons; dotted circles represent small neurons) depicting staining of GFP-Atg8a (green), mutant HTT-Q128 (red), and PDF (magenta). Right top diagram represents the right half of the Drosophila brain depicting the position of PDF neurons in the brain. Scale bar, 20 µm. (+) and (–) in the bar graphs represent the presence or absence, respectively, of the gene in the fly. B, Plot represents quantification of HTT protein intensity from small and large neurons when only HTT-Q0 protein or HTT-Q0 and Atg8a protein were coexpressed. No significant decrease in the intensity of HTT protein was observed on the expression of two UAS constructs in the PDF neurons. n > 16 brain hemispheres. *p < 0.05. C, Plot represents % rhythmicity values for control and experimental genotypes. Control flies were rhythmic; however, no significant improvement in % rhythmicity was observed when mutant HTT-Q128 protein was coexpressed with UAS-GFP. n > 17 flies/genotype. *p < 0.05. D, Plot represents quantification of the number of PDF+ small neurons. Based on PDF neuropeptide and HTT-Q128 staining, quantification was done at three different ages (days 1, 5, and 10). Control genotype showed ∼4 PDF+ small neurons per hemisphere. Compared with the control genotype, mutant HTT-Q128 protein expression led to a significant reduction in the number of small neurons. A small improvement in the number of small neurons was observed on Atg8a overexpression. n > 12 brain hemispheres (for control genotype), and n > 16 brain hemispheres (for experimental genotype). *p < 0.05. E, Plot represents quantification of the number of PDF+ large neurons. Based on PDF neuropeptide and HTT-Q128 staining, quantification was done at three different ages (days 1, 5, and 10). Control genotype showed ∼4 PDF+ large neurons per hemisphere. Compared with the control genotype, mutant HTT-Q128 protein expression in the large neurons does not lead to any significant reduction in the number of neurons. Neither any change was observed on Atg8a overexpression in the presence of mutant HTT-Q128 protein. n > 12 brain hemispheres (for control genotype), and n > 16 brain hemispheres (for both experimental genotypes). *p < 0.05. Asterisk on individual genotypes indicates that the genotype is significantly different from all other plotted genotypes.
Figure 3.
Figure 3.
Mutant HTT-Q128 protein induces HSP70 expression in the PDF+ lateral ventral neurons. A, Representative MIP images (day 1, adult brain) of PDF neurons (large neurons and small neurons) depicting staining of PDF neuropeptide (green), and HSP70 (red). Scale bar, 20 µm. Zoomed in panel shows small neurons. Scale bar, 10 µm. (+) and (–) in the bar graphs represent the presence or absence, respectively, of the gene in the fly. B, Plot represents quantification of the number of HSP70+ small neurons. Based on PDF neuropeptide and HSP70 staining, quantification was done at two different ages (day 1 and day 18). Mutant HTT-Q128 protein expression induces HSP70 protein expression in mainly small neurons at an early age. Compared with flies only expressing mutant HTT-Q128 protein, no significant change was observed in the number HSP70+ small neurons on Atg8a overexpression at both ages. n > 16 brain hemispheres (for both genotypes). *p < 0.05. C, Plot represents quantification of the number of HSP70+ large lateral ventral neurons. Based on PDF neuropeptide and HSP70 staining, quantification was done at two different ages (day 1 and day 18). Mutant HTT-Q128 expression led to the induction of HSP70 protein in large neurons. Compared with flies only expressing mutant HTT-Q128, no significant change was observed in the number of HSP70+ large neurons on Atg8a overexpression. n > 16 brain hemispheres (for both experimental genotypes). *p < 0.05. Asterisk on individual genotypes indicates that the genotype is significantly different from all other plotted genotypes.
Figure 4.
Figure 4.
Atg8a overexpression increases mutant HTT-Q128 protein aggregates in the PDF+ small lateral ventral neurons. A, Representative MIP images of PDF neurons (small – (larva brain; left) and large neurons – (adult brain; right) depicting staining of mutant HTT-Q128 protein (red) & PDF neuropeptide (magenta). Left diagram represents the larval Drosophila brain depicting the position of small PDF neurons. Dotted circles represent small neuron cell bodies. Dotted areas represent small neuron projections. Scale bar, 20 µm. (+) and (–) in the bar graphs represent the presence or absence, respectively, of the gene in the fly. B, Plot represents quantification of the number of mutant protein aggregates, quantified from the small neurons (at L3 stage). Mutant HTT-Q128 protein expression led to the formation of protein aggregates in the small neurons. Compared with flies only expressing mutant HTT-Q128 protein, a significant increase in the number of mutant HTT-Q128 protein aggregates was observed on Atg8a overexpression. n > 24 brain hemispheres (for both experimental genotypes). *p < 0.05. C, Plot represents quantification of the size of mutant protein aggregates, quantified from the small neurons (at L3 stage). Compared with flies only expressing mutant HTT-Q128 protein, a significant increase in the size of mHTT aggregates was observed on Atg8a overexpression. n > 24 brain hemispheres (for both experimental genotypes). *p < 0.05. D, Plot represents quantification of signal intensity of nonaggregated mutant HTT-Q128 protein, quantified from the large neurons (on day 1, after eclosion). Compared with flies only expressing mutant HTT-Q128 protein, Atg8a overexpression does not lead to any significant change in the intensity of nonaggregated mutant HTT-Q128 protein. n > 30 neurons (for both experimental genotypes). *p < 0.05. E, Plot represents quantification of the cell numbers positive for either only mutant HTT-Q128 protein aggregates or have both aggregated and nonaggregated mutant HTT-Q128 protein. Quantification was done from the large neurons (on day 1, after eclosion). Compared with mutant HTT-Q128-expressing flies, no significant change was observed in both the quantifications on Atg8a overexpression. n > 30 neurons (for both experimental genotypes). *p < 0.05. F, Plot represents quantification of the number of mutant protein aggregates, quantified from the large neuron cell bodies and some part of the projections at two different ages (days 1 and 10). As observed in small neurons, mutant HTT-Q128 protein expression in large neurons led to the formation of protein aggregates. Compared with flies only expressing mutant HTT-Q128 protein, at both ages, no significant change was observed in the number of mutant HTT-Q128 protein aggregates on Atg8a overexpression. n > 18 brain hemispheres (day 1, for both experimental genotype), and n > 16 brain hemispheres (day 10, for both experimental genotypes). *p < 0.05. G, Plot represents quantification of the size of mutant protein aggregates, quantified from the large neuron cell bodies and some part of the projections at two different ages (days 1 and 10). Compared with flies only expressing mutant HTT-Q128 protein, at both ages, no significant change was observed in the size of mutant HTT-Q128 aggregates on Atg8a overexpression. n > 18 brain hemispheres (day 1, for both the experimental genotypes), and n > 16 brain hemispheres (day 10, for both experimental genotypes). *p < 0.05. Asterisk on individual genotypes indicates that the genotype is significantly different from all other plotted genotypes.
Figure 5.
Figure 5.
Increased Ref(2)P levels in the rescue genotype suggest that Atg8a-mediated rescue in activity rhythm is autophagy-dependent. A, (+) and (–) in the bar graphs represent the presence or absence, respectively, of the gene in the fly. Representative MIP images of small PDF neurons (from L3 stage, larval brain) depicting staining for Ref(2)P protein (green), control (HTT-Q0), and mutant HTT-Q128 (red). Dotted area represents the cell bodies of the small neurons. Scale bar, 20 µm. Images for HTT-Q0 were acquired separately and not subjected to quantification. Plot represents quantification of the Ref(2)P-HTT colocalization events in small neurons for both the experimental genotypes. A mean Ref(2)P-HTT colocalization event of ∼5 was observed in flies expressing mutant HTT-Q128 protein (red bar). Compared with the flies only expressing mutant HTT-Q128 protein, a significant increase in Ref(2)P-HTT colocalization event (∼15) was observed on Atg8a overexpression. n > 16 brain hemispheres (for both genotypes). *p < 0.05. B, Representative MIP images (LD day 1, adult brain) of PDF neurons depicting staining for Ref(2)P protein (red), control (HTT-Q0), and mutant HTT-Q128 (green). Dotted area represents the cell bodies of the small neurons. Scale bar, 20 µm. Plot represents quantification of the number of Ref(2)P-HTT colocalization events quantified across two different ages (days 1 and 10) for both the experimental genotypes from large neurons. A mean Ref(2)P-HTT colocalization of ∼30 was observed in flies expressing mutant HTT-Q128 protein. Additionally, no significant change was observed in the values with age for the mutant genotype (red bar). Compared with the flies only expressing mutant HTT-Q128 protein, Atg8a coexpression does not lead to a significant increase in the number of Ref(2)P-HTT colocalization events on day 1. However, a significant increase in the colocalization was observed on day 10 compared with the values obtained from the same genotype at an earlier age (day 1) and flies only expressing mutant HTT-Q128 protein on day 10. n > 16 brain hemispheres (for both genotypes). *p < 0.05. C, Plot represents quantification of rhythmicity values quantified across 2 AWs (8 d each) for all the genotypes. Consistent with the previous results, expression of mutant HTT-Q128 protein in PDF neurons results in a significant decrease in percentage rhythmicity compared with the control genotypes (red bar). Further, coexpression of Atg8a with mutant HTT-Q128 improves the number of rhythmic individuals in both the AWs (green bar). In the first AW, downregulation of Atg1 in the rescue genotype (Pdf>Q128; Atg8a) does not lead to any significant decrease in the rhythmicity, and the values were comparable to both control and rescue genotypes. However, compared with the first AW, a significant decrease in the number of rhythmic individuals was observed in the second AW (green-filled bars). n > 16 flies/genotype. *p < 0.05. D, Plot represents rhythm amplitude values for Pdf>Q0; Atg8a, Pdf>Q128; Atg8a, and Pdf>Q128; Atg8a, Atg1Rnai flies. A significant decrease in rhythm amplitude was only observed on Atg1 downregulation in the Pdf>Q128; Atg8a background. n > 16 flies/genotypes. *p < 0.05. Asterisk on individual genotypes indicates that the genotype is significantly different from all other plotted genotypes.
Figure 6.
Figure 6.
Flies overexpressing Atg8a shows Cathepsin-D staining (possibly lysosome functioning) in the small neurons. (+) and (–) in the bar graphs represent the presence or absence, respectively, of the gene in the fly. A, Representative MIP images (at L3 stage, larval brain) of small PDF+ neurons, depicting staining of Cath-D (green), control (HTT-Q0) and HTT-Q128 (red), and PDF neuropeptide (magenta). Scale bar, 20 µm. Top right, Quantification showing that, in both the control genotype and flies expressing only mutant HTT-Q128 protein, no staining for Cath-D was observed in the cell bodies. However, big spot-like staining for Cath-D was observed in flies overexpressing Atg8a in the presence of mHTT. n > 14 brain hemispheres/genotype. *p < 0.05. Bottom, Quantification of Cath-D-HTT-Q128 colocalization events in control and experimental genotypes. Compared with other control and experimental genotypes, Atg8a-overexpressing flies show a significantly high number of Cath-D-HTT colocalization events. n > 14 brain hemispheres/genotype. *p < 0.05. B, Representative MIP images (LD day 1, adult brain) of large PDF+ neurons, depicting staining of Cath-D (green), control (HTT-Q0) and HTT-Q128 (red), and PDF neuropeptide (far-red). Arrow indicates the Cath-D staining in the large neurons for all genotypes. Scale bar, 20 µm. Top right, Quantification showing that staining for Cath-D (both diffuse and punctate) can be observed in the large neurons for the control genotype. No such staining pattern was observed in flies expressing either mutant HTT-Q128 protein or coexpressing Atg8a with the mutant protein. n > 16 brain hemispheres/genotype. *p < 0.05. Bottom, Quantification of Cath-D-HTT-Q128 colocalization intensity in control and experimental genotypes. Control flies show a significantly high level of Cath-D-HTT colocalization intensity compared with other experimental genotypes. n > 16 brain hemispheres/genotype. *p < 0.05. Asterisk on individual genotypes indicates that the genotype is significantly different from all other plotted genotypes.
Figure 7.
Figure 7.
Atg8a overexpression does not improve PERIOD (PER) protein oscillations in the PDF+ lateral ventral neurons. A, Representative MIP images (DD day 3, adult brain) of PDF neurons and fifth small lateral ventral neuron (do not express PDF neuropeptide and served as our control for the PER staining) depicting staining for PER protein (green) and PDF neuropeptide (red) for four circadian time points (CT22, CT2, CT11, and CT15). Arrow indicates fifth s-LNv. Dotted circles represent small PDF neurons. Scale bar, 20 µm. B, Plots represent quantification of the mean signal intensity of PER protein, quantified on DD day 3 from fifth small lateral ventral neuron (left), PDF+ small neurons (middle), and large neurons (right) at four different circadian time points. Fifth small ventral neuron shows time-dependent oscillation of PER protein in all the genotypes. Compared with the control genotype, expression of mutant HTT-Q128 protein in both small and large neurons significantly hampers the PER protein levels and oscillation in both small and large neurons (red curve). No significant improvement was observed in PER protein levels or oscillation on Atg8a overexpression in the presence of mutant HTT-Q128 protein in the PDF neurons (green curve). n > 16 brain hemispheres/time point (for control genotype), and n > brain 18 hemispheres/time point (for experimental genotypes). *p < 0.05. Asterisk on individual genotypes indicates that the genotype is significantly different from all other plotted genotypes and time points.
Figure 8.
Figure 8.
Atg8a overexpression improves the output from the PDF+ small neurons to the downstream neurons. A, Representative MIP images (DD day 3, adult brain) of dorsal projections (part of small lateral ventral neurons) and DNs, depicting staining for PER protein (green) and PDF neuropeptide (red) for four circadian time points (CT22, CT2, CT11, and CT15). Scale bar, 20 µm. B, Plots represent quantification of the mean signal intensity of PDF neuropeptide, quantified from the dorsal projections of small neurons at four different circadian time points on DD day 3. Time-dependent oscillation of PDF neuropeptide was observed in the control genotype (blue bars). Expression of mutant HTT-Q128 in the PDF neurons does not hamper the oscillation of PDF neuropeptide in the dorsal projections, but like the control genotype, no gradual decrease or increase was observed in the intensity (red bars). Atg8a-overexpressing flies in the presence of mutant HTT-Q128 protein also show PDF oscillation (green bar), but the change in the intensity is distinctly different from what was observed in flies only expressing mutant HTT-Q128 protein. n > 16 brain hemispheres/time point (for control genotype), and n > 18 brain hemispheres/time point (for experimental genotype). *p < 0.05. C, Plot represents quantification of the number of PER+ DN1 and DN2 (together mentioned as DNs) neurons quantified across four different circadian time points. Nice time-dependent oscillation was observed in the number of PER+ DNs for the control genotype. Expression of mutant HTT-Q128 protein in the PDF neurons hampers PER expression in the DNs, and hardly any cells were visualized at CT2, CT11, and CT15 time points. Overexpression of Atg8a in the PDF neurons improves PER expression in the DNs; however, the oscillation in the cell number was not the same as observed in the control genotype. n > 16 brain hemisphere/time point (for control genotype), and n > 18 brain hemisphere/time point (for experimental genotype). *p < 0.05. D, Plots represent quantification of the mean signal intensity of PER protein, quantified from DNs at four different circadian time points. The control genotype showed a nice time-dependent oscillation of PER protein in the DNs (blue bars). Expression of mutant HTT-Q128 protein in the PDF neurons hampers PER oscillation in the DNs (red bars). Atg8a overexpression in the PDF neurons results in a low amplitude PER oscillation in downstream DNs (green bars). n > 16 brain hemispheres/time point (for control genotype), and n > 18 brain hemispheres/time point (for experimental genotype). *p < 0.05. E, Plots (same as in D) represent individual values of PER protein intensity quantified from the DNs. *p < 0.05. Asterisk on individual genotypes indicates that the genotype is significantly different from all other plotted genotypes.
Figure 9.
Figure 9.
Atg8a overexpression in the dorsal fan-shaped body neurons (dFB) rescues sleep defects. A, Sleep profiles of control and experimental genotypes for 3 AWs each comprising 3 d of data. Plots represent data from two independent replicate experiments. Expression of mHTT leads to reduction in predominantly nighttime sleep in the flies. Atg8a overexpression rescues the sleep defects in the flies. B, Plot represents quantification of mean total sleep quantified for a single replicate experiment for 3 AWs. Control genotypes show good sleep levels; however, the expression of mHTT leads to a significant decrease in total sleep in the initial two AWs (red bar). Expression of Atg8a with mutant protein rescues sleep defects, and the values are comparable to the control genotypes. n > 17 flies/genotype. *p < 0.05. C, Plot represents quantification of mean day sleep quantified for a single replicate experiment for 3 AWs. Control genotypes show good sleep levels; however, the expression of mHTT leads to a significant decrease in daytime sleep in the initial two AWs (red bar). Expression of Atg8a with mutant protein rescues daytime sleep, and the values are comparable to the control genotypes (green bar). n > 17 flies/genotype. *p < 0.05. D, Plot represents quantification of mean nighttime sleep quantified for a single replicate experiment for 3 AWs. Control genotypes show good sleep levels; however, the expression of mHTT leads to a significant decrease in nighttime sleep in the initial two AWs (red bar). Expression of Atg8a with mutant protein rescues nighttime sleep. n > 17 flies/genotype. *p < 0.05. E, Plot represents quantification of mean length of daytime sleep bouts quantified for a single replicate experiment for 3 AWs. Expression of mHTT leads to a significant decrease in daytime sleep bout length (red bar). Expression of Atg8a with mutant protein rescues length of daytime sleep episode. n > 17 flies/genotype. *p < 0.05. F, Plot represents quantification of mean length of nighttime sleep bouts quantified for a single replicate experiment for 3 AWs. Expression of mHTT leads to a significant decrease in nighttime sleep bout length (red bar). Expression of Atg8a with mutant protein rescues length of nighttime sleep episode. n > 17 flies/genotype. *p < 0.05. (+) and (–) in the bar graphs represent the presence or absence, respectively, of the gene in the fly. G, Plot represents quantification of nonaggregates and aggregated mHTT. Expression of mHTT in dFB leads to accumulation of nonaggregated mHTT in the axons (left, red bar). Atg8a overexpression in the presence of mHTT significantly reduces the nonaggregated mHTT from the projections (left, green bar). However, Atg8a overexpression does not lead to any significant change in the mutant aggregate number in the targeted neurons (right). n > 10 brains/genotype. *p < 0.05. H, Representative MIP images (day 3, adult brain) of dFB neurons depicting staining of HTT (red). Dotted area represents the projections from the neurons. Arow points to the neuropil region. Scale bar, 40 µm. Asterisk on individual genotypes indicates that the genotype is significantly different from all other plotted genotypes.

Similar articles

Cited by

References

    1. Allocca M, Zola S, Bellosta P (2018) The fruit fly, Drosophila melanogaster: modeling of human diseases (Part II). In: Drosophila melanogaster: model for recent advances in genetics and therapeutics. London, United Kingdom: IntechOpen.
    1. Arrasate M, Mitra S, Schweitzer ES, Segal MR, Finkbeiner S (2004) Inclusion body formation reduces levels of mutant huntingtin and the risk of neuronal death. Nature 431:805–810. 10.1038/nature02998 - DOI - PubMed
    1. Baldo B, Soylu R, Petersén Å (2013) Maintenance of basal levels of autophagy in Huntington's disease mouse models displaying metabolic dysfunction. PLoS One 8:e83050. 10.1371/journal.pone.0083050 - DOI - PMC - PubMed
    1. Bellosta Diago E, Pérez Pérez J, Santos Lasaosa S, Viloria Alebesque A, Martínez Horta S, Kulisevsky J, López del Val J (2017) Circadian rhythm and autonomic dysfunction in presymptomatic and early Huntington's disease. Parkinsonism Relat Disord 44:95–100. 10.1016/j.parkreldis.2017.09.013 - DOI - PubMed
    1. Benes P, Vetvicka V, Fusek M (2008) Cathepsin D: many functions of one aspartic protease. Crit Rev Oncol Hematol 68:12–28. 10.1016/j.critrevonc.2008.02.008 - DOI - PMC - PubMed

Publication types

Substances

LinkOut - more resources