. 2023 Jul 5;43(27):4997-5013.
doi: 10.1523/JNEUROSCI.1775-22.2023. Epub 2023 Jun 2.

Basolateral Amygdala Astrocytes Are Engaged by the Acquisition and Expression of a Contextual Fear Memory

Affiliations

Basolateral Amygdala Astrocytes Are Engaged by the Acquisition and Expression of a Contextual Fear Memory

Rebecca L Suthard et al. J Neurosci. .

Abstract

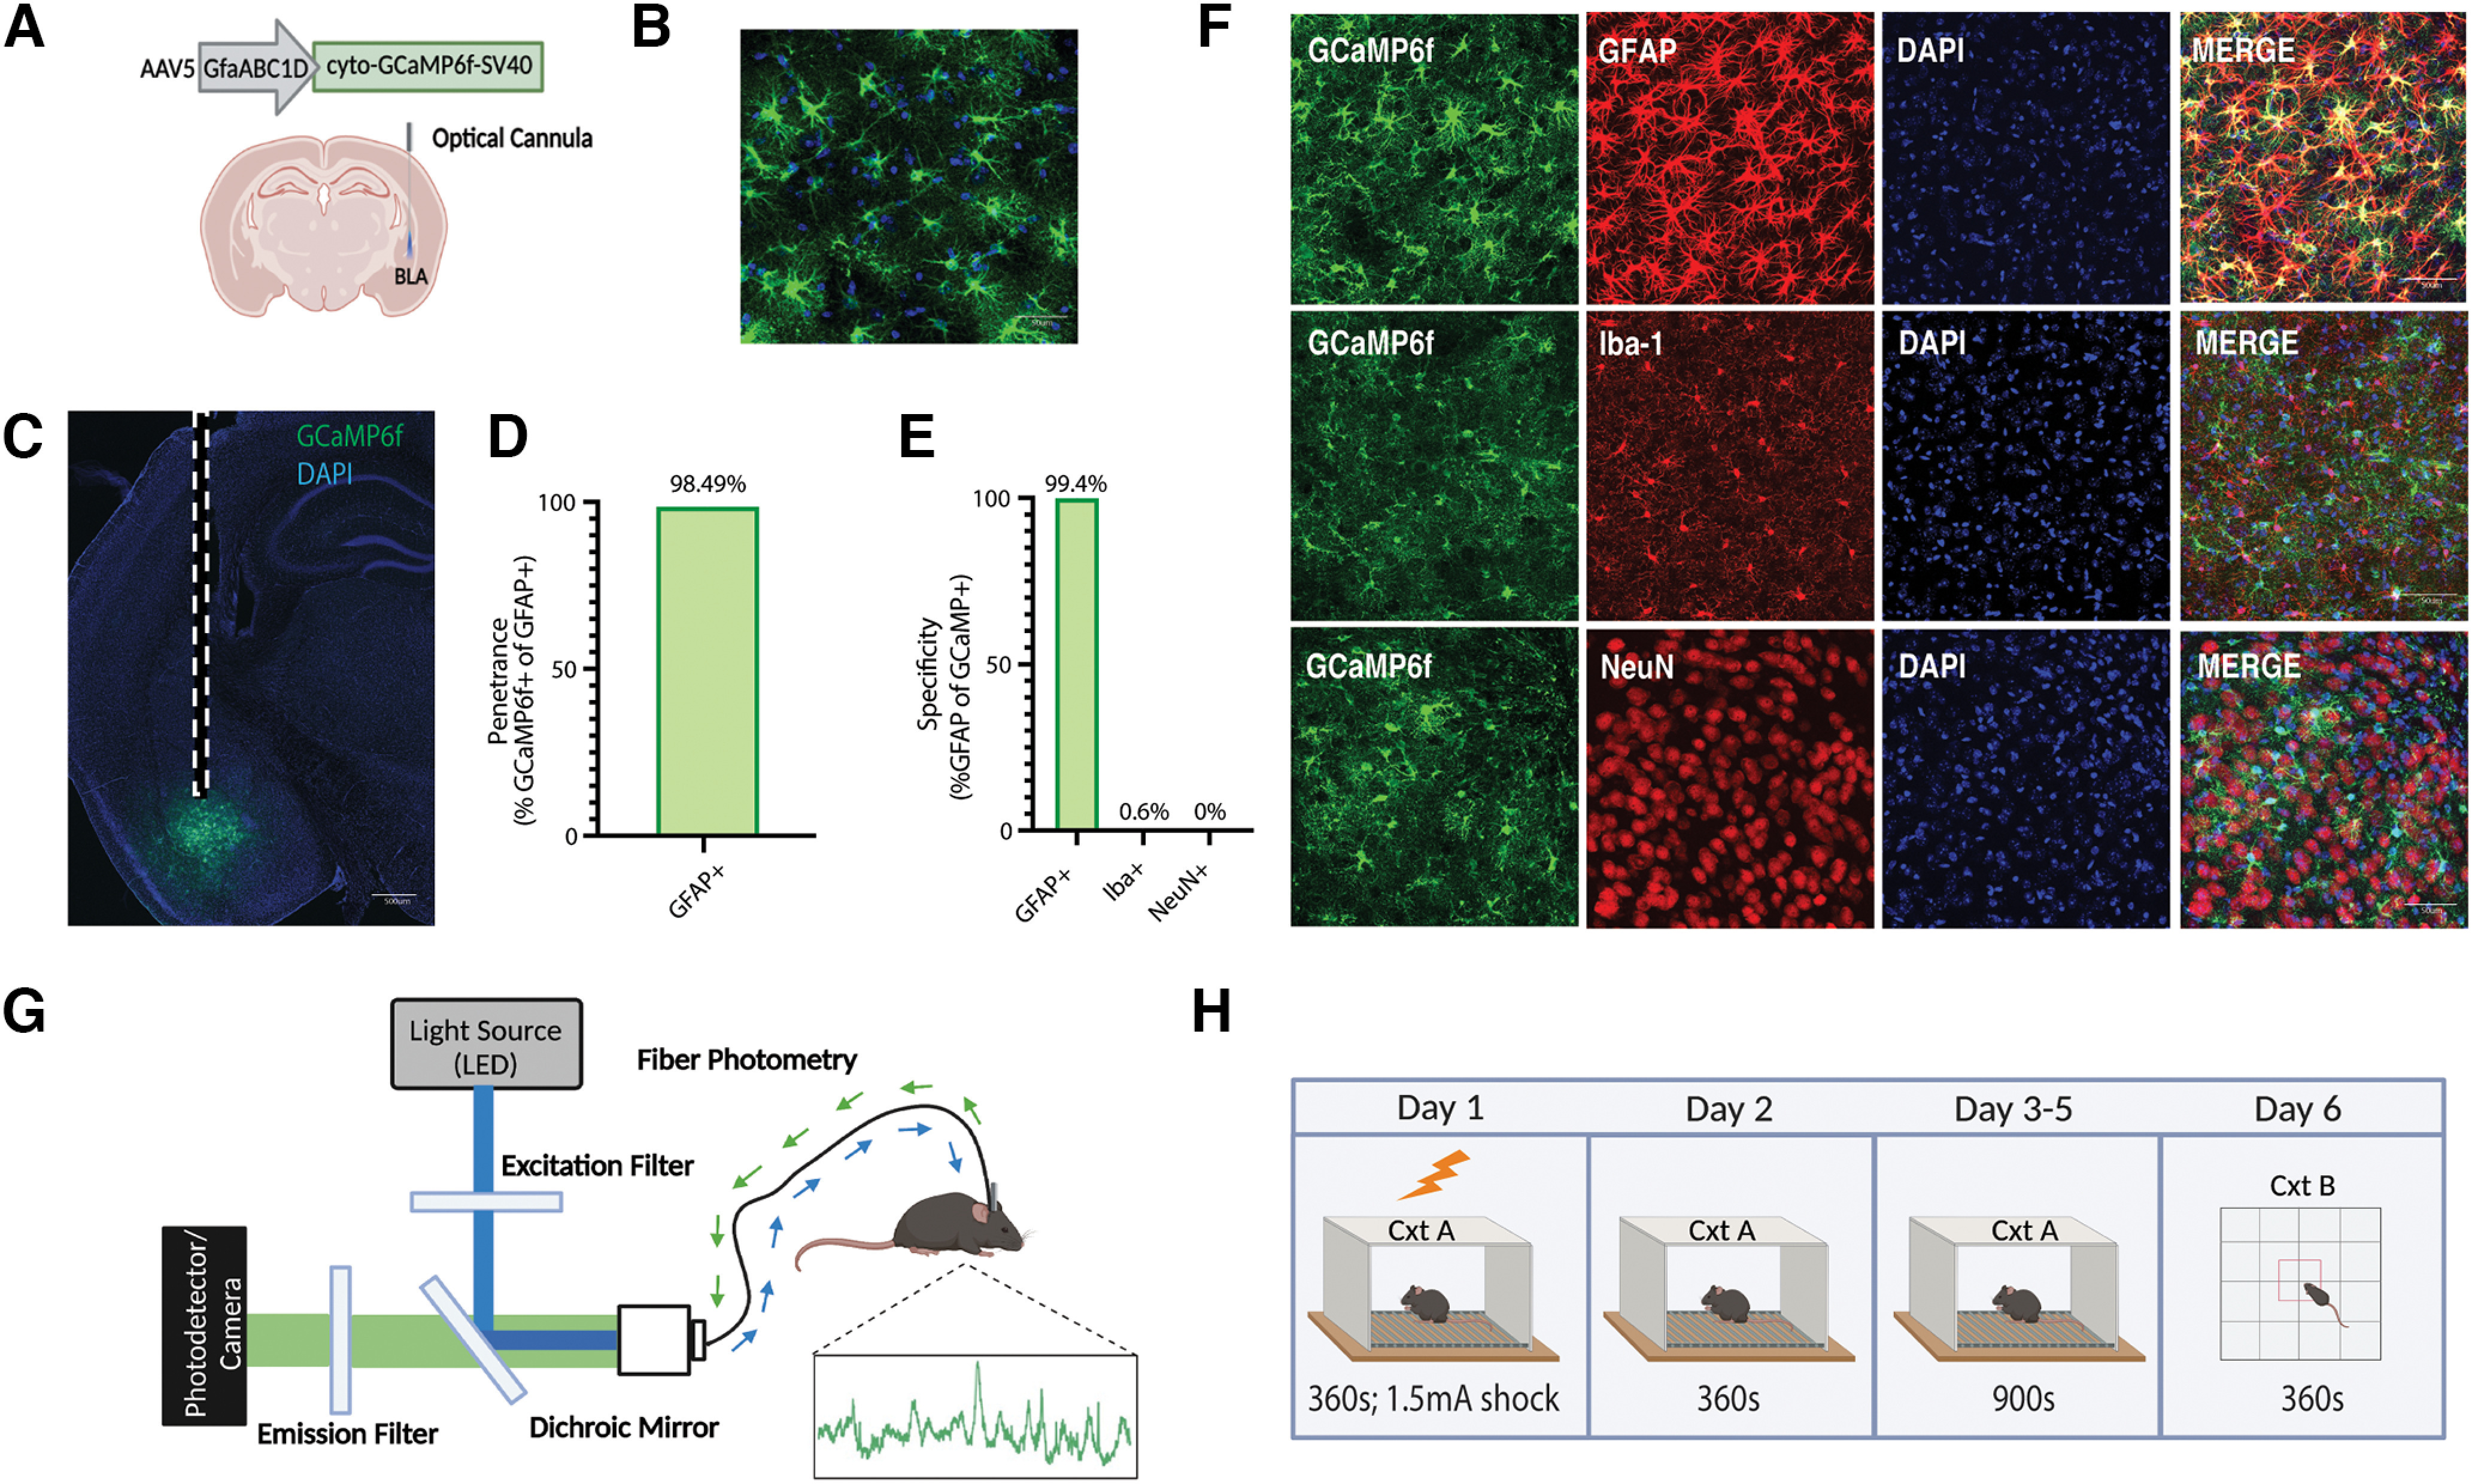
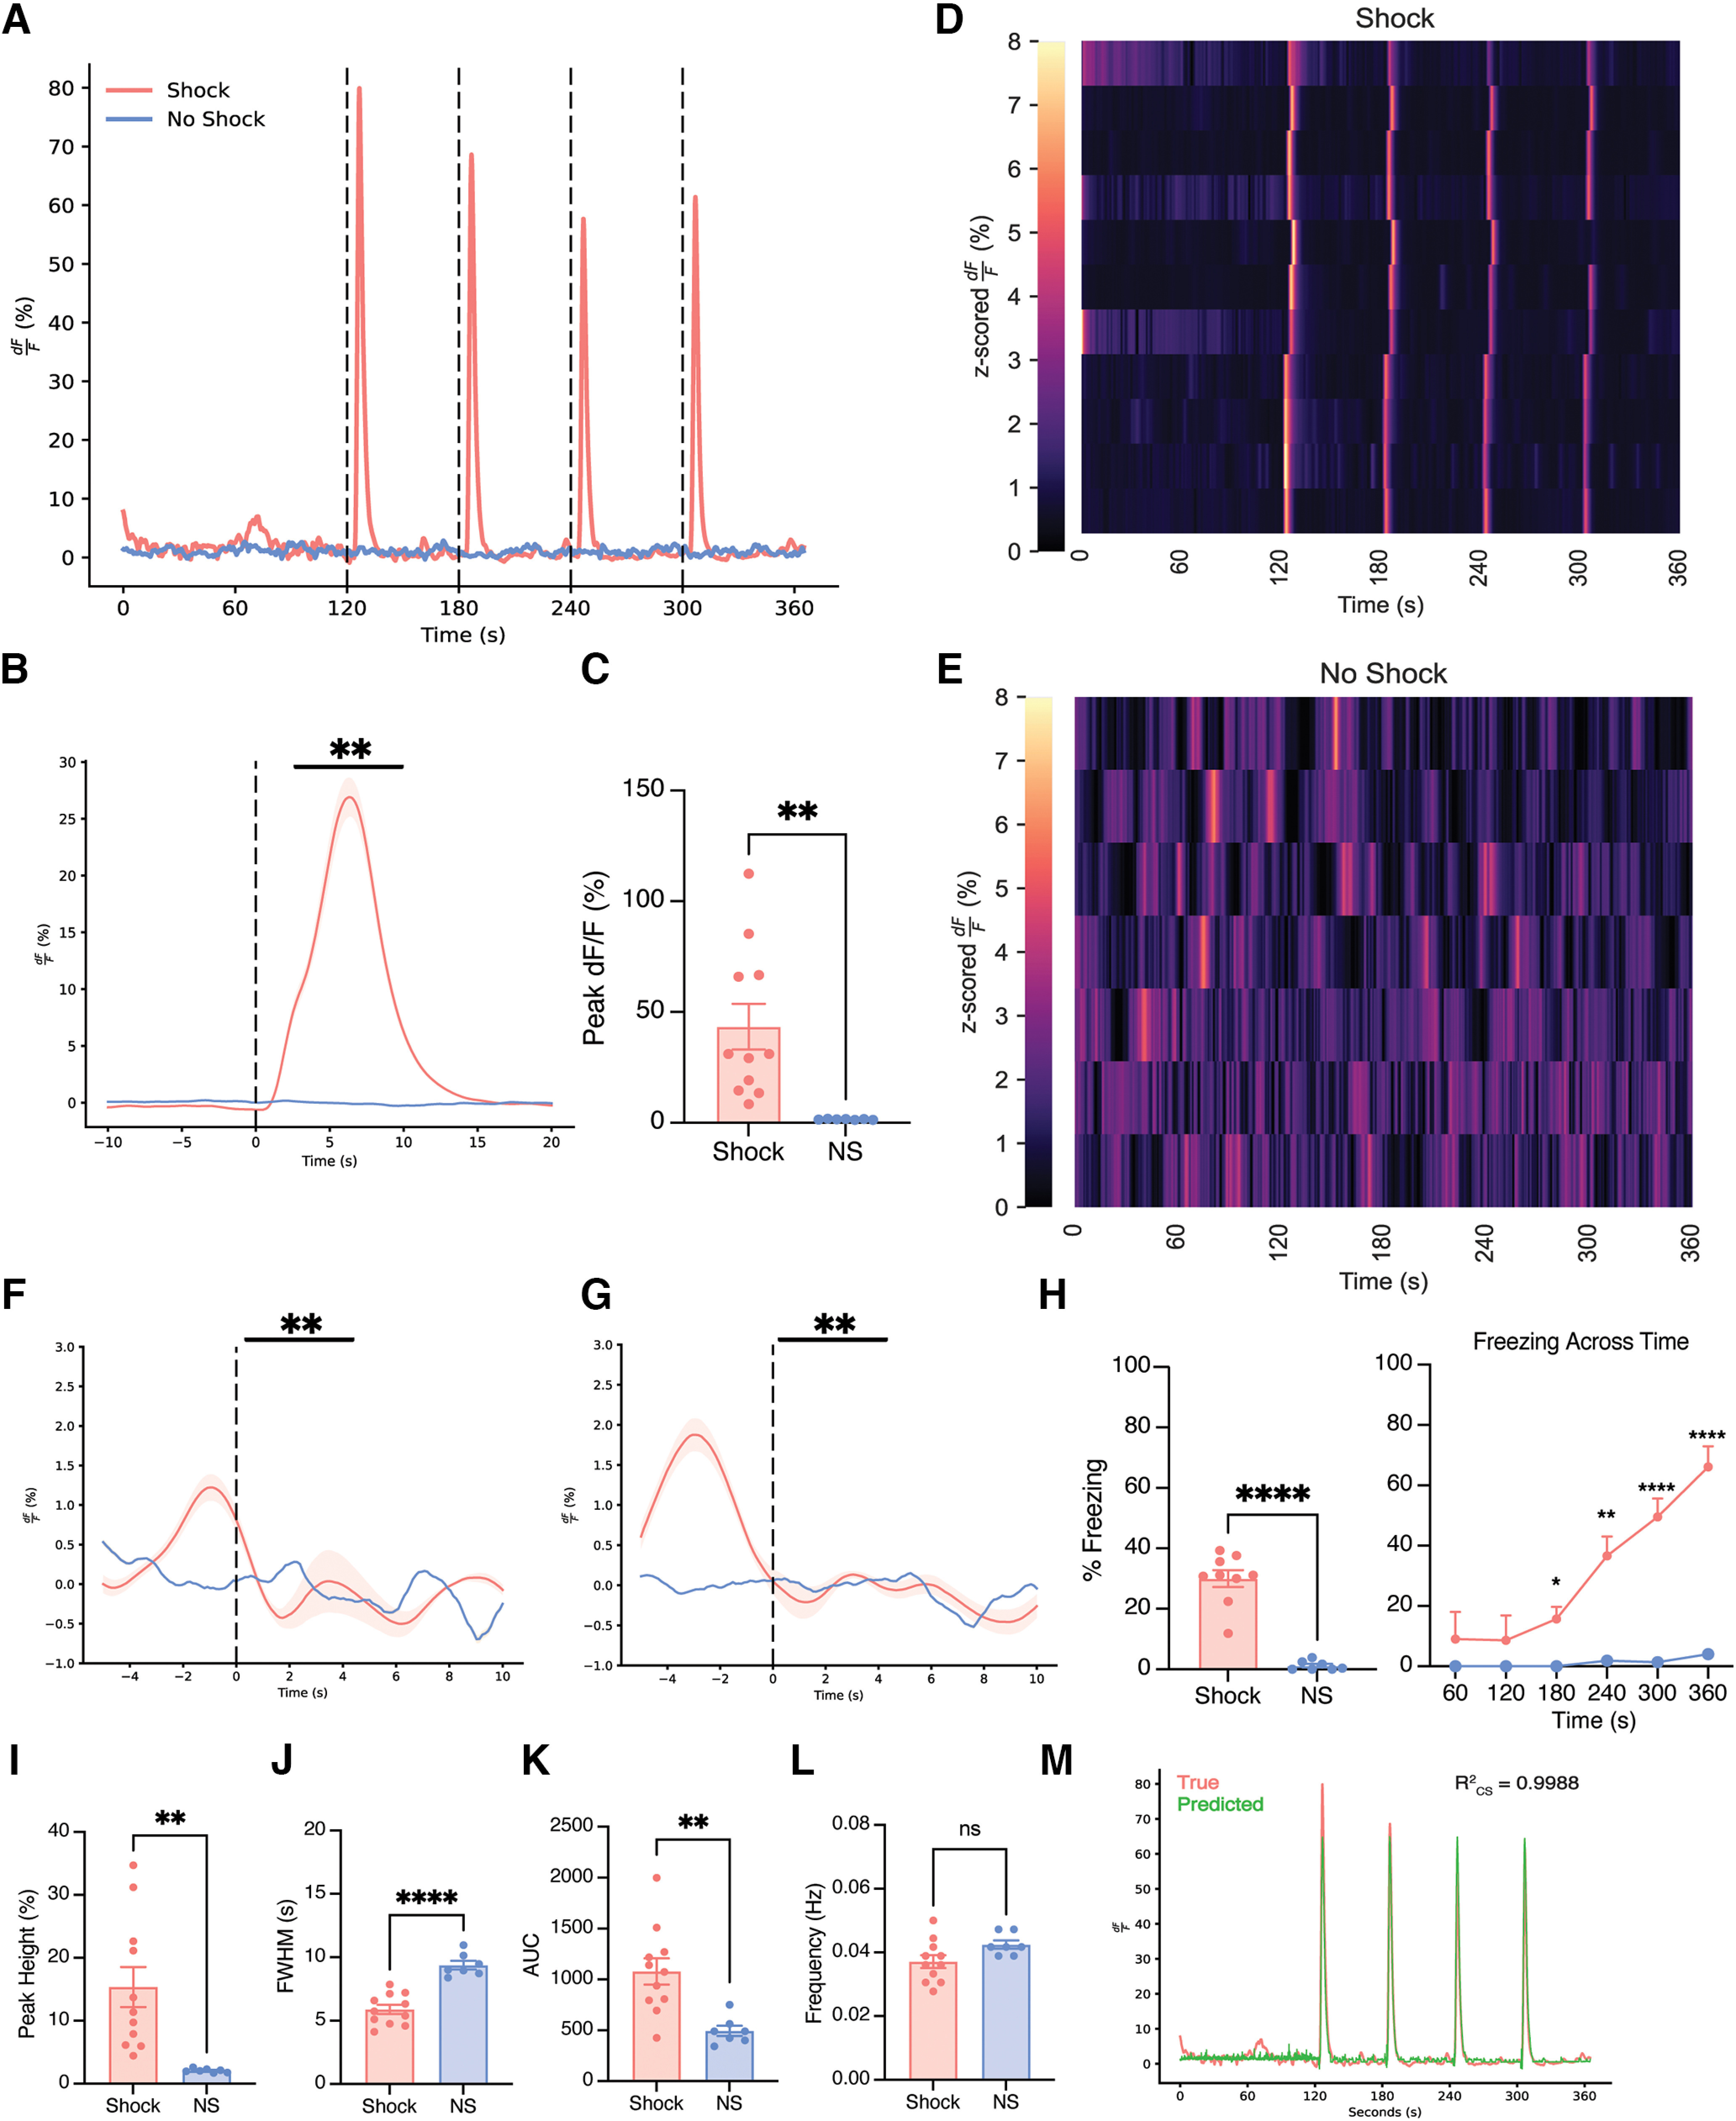
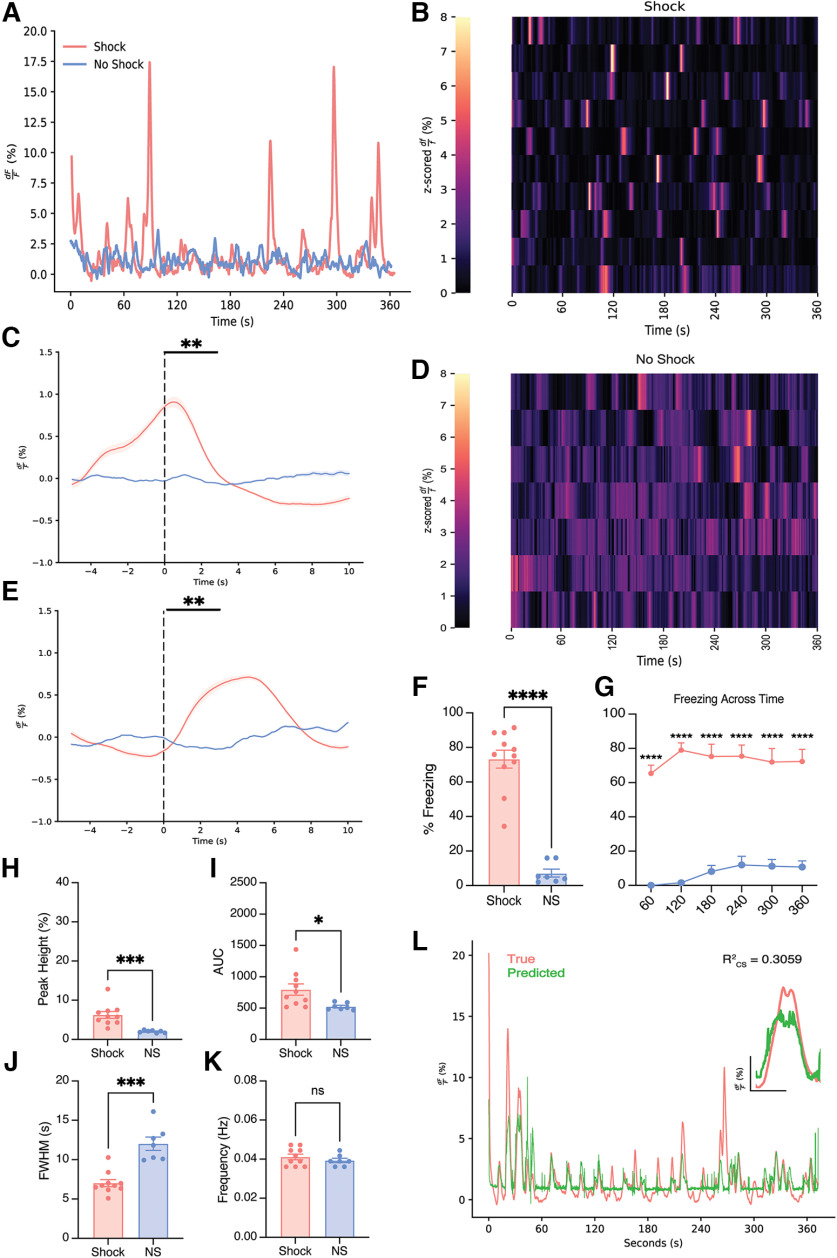
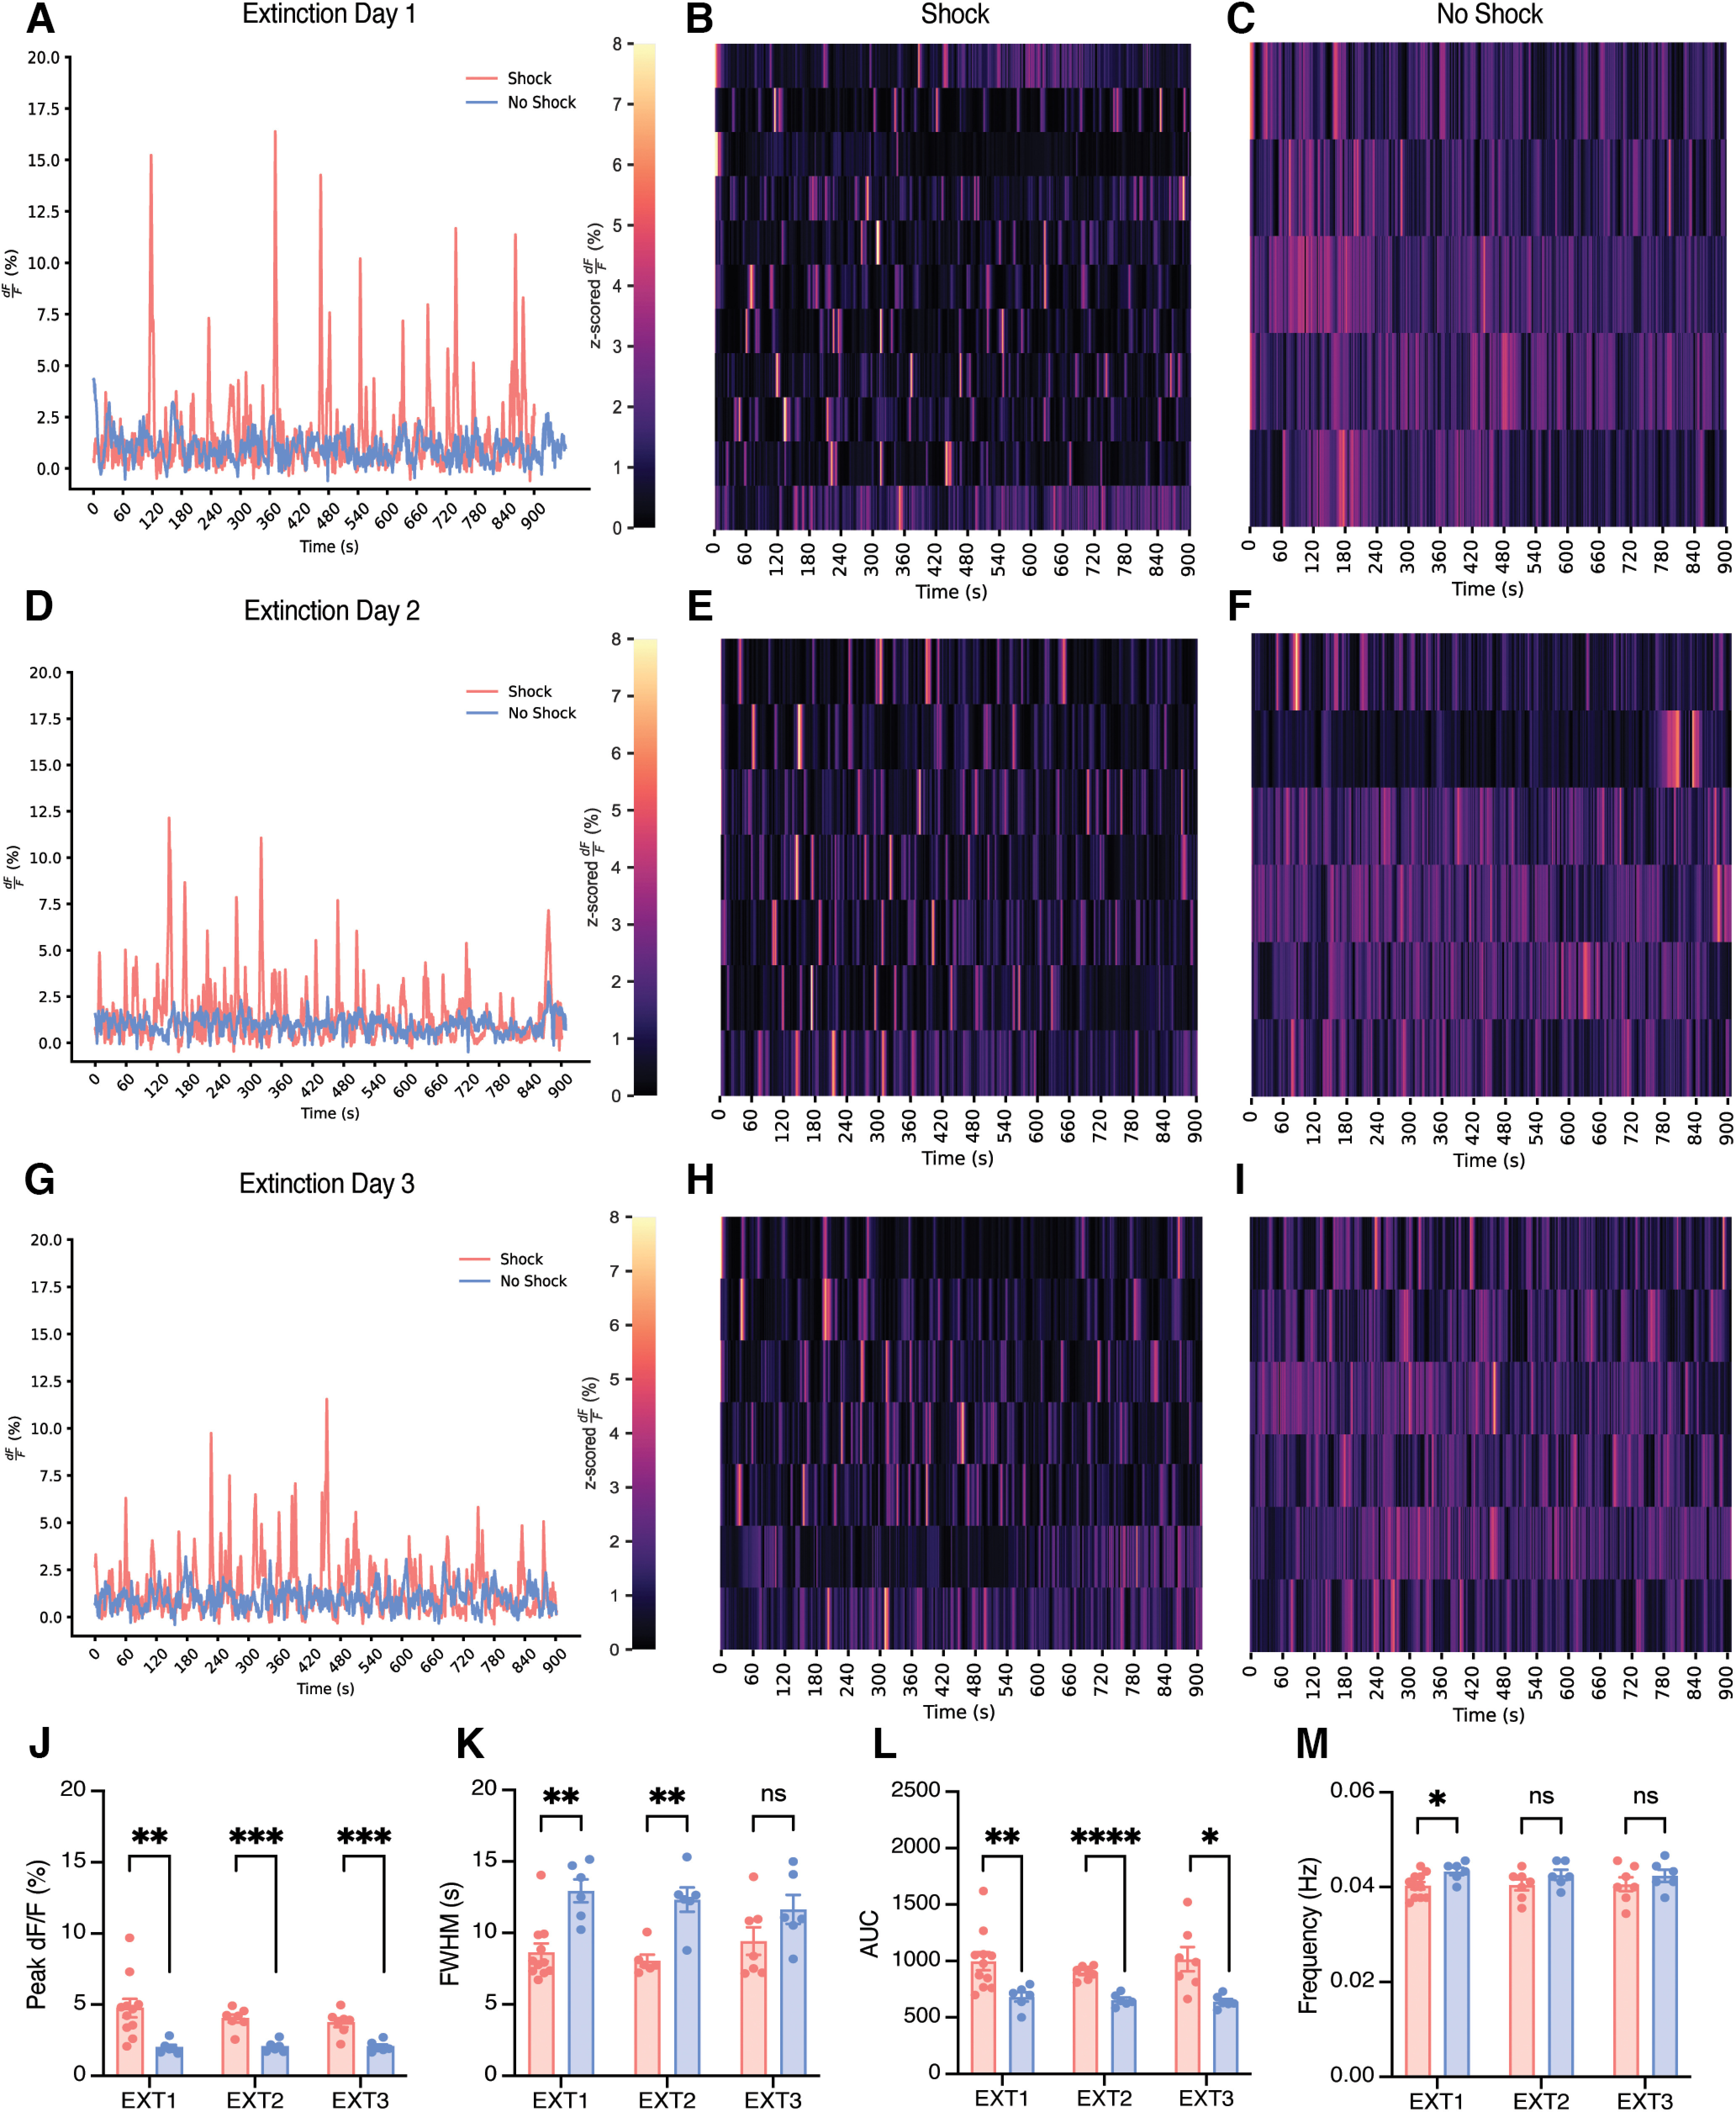
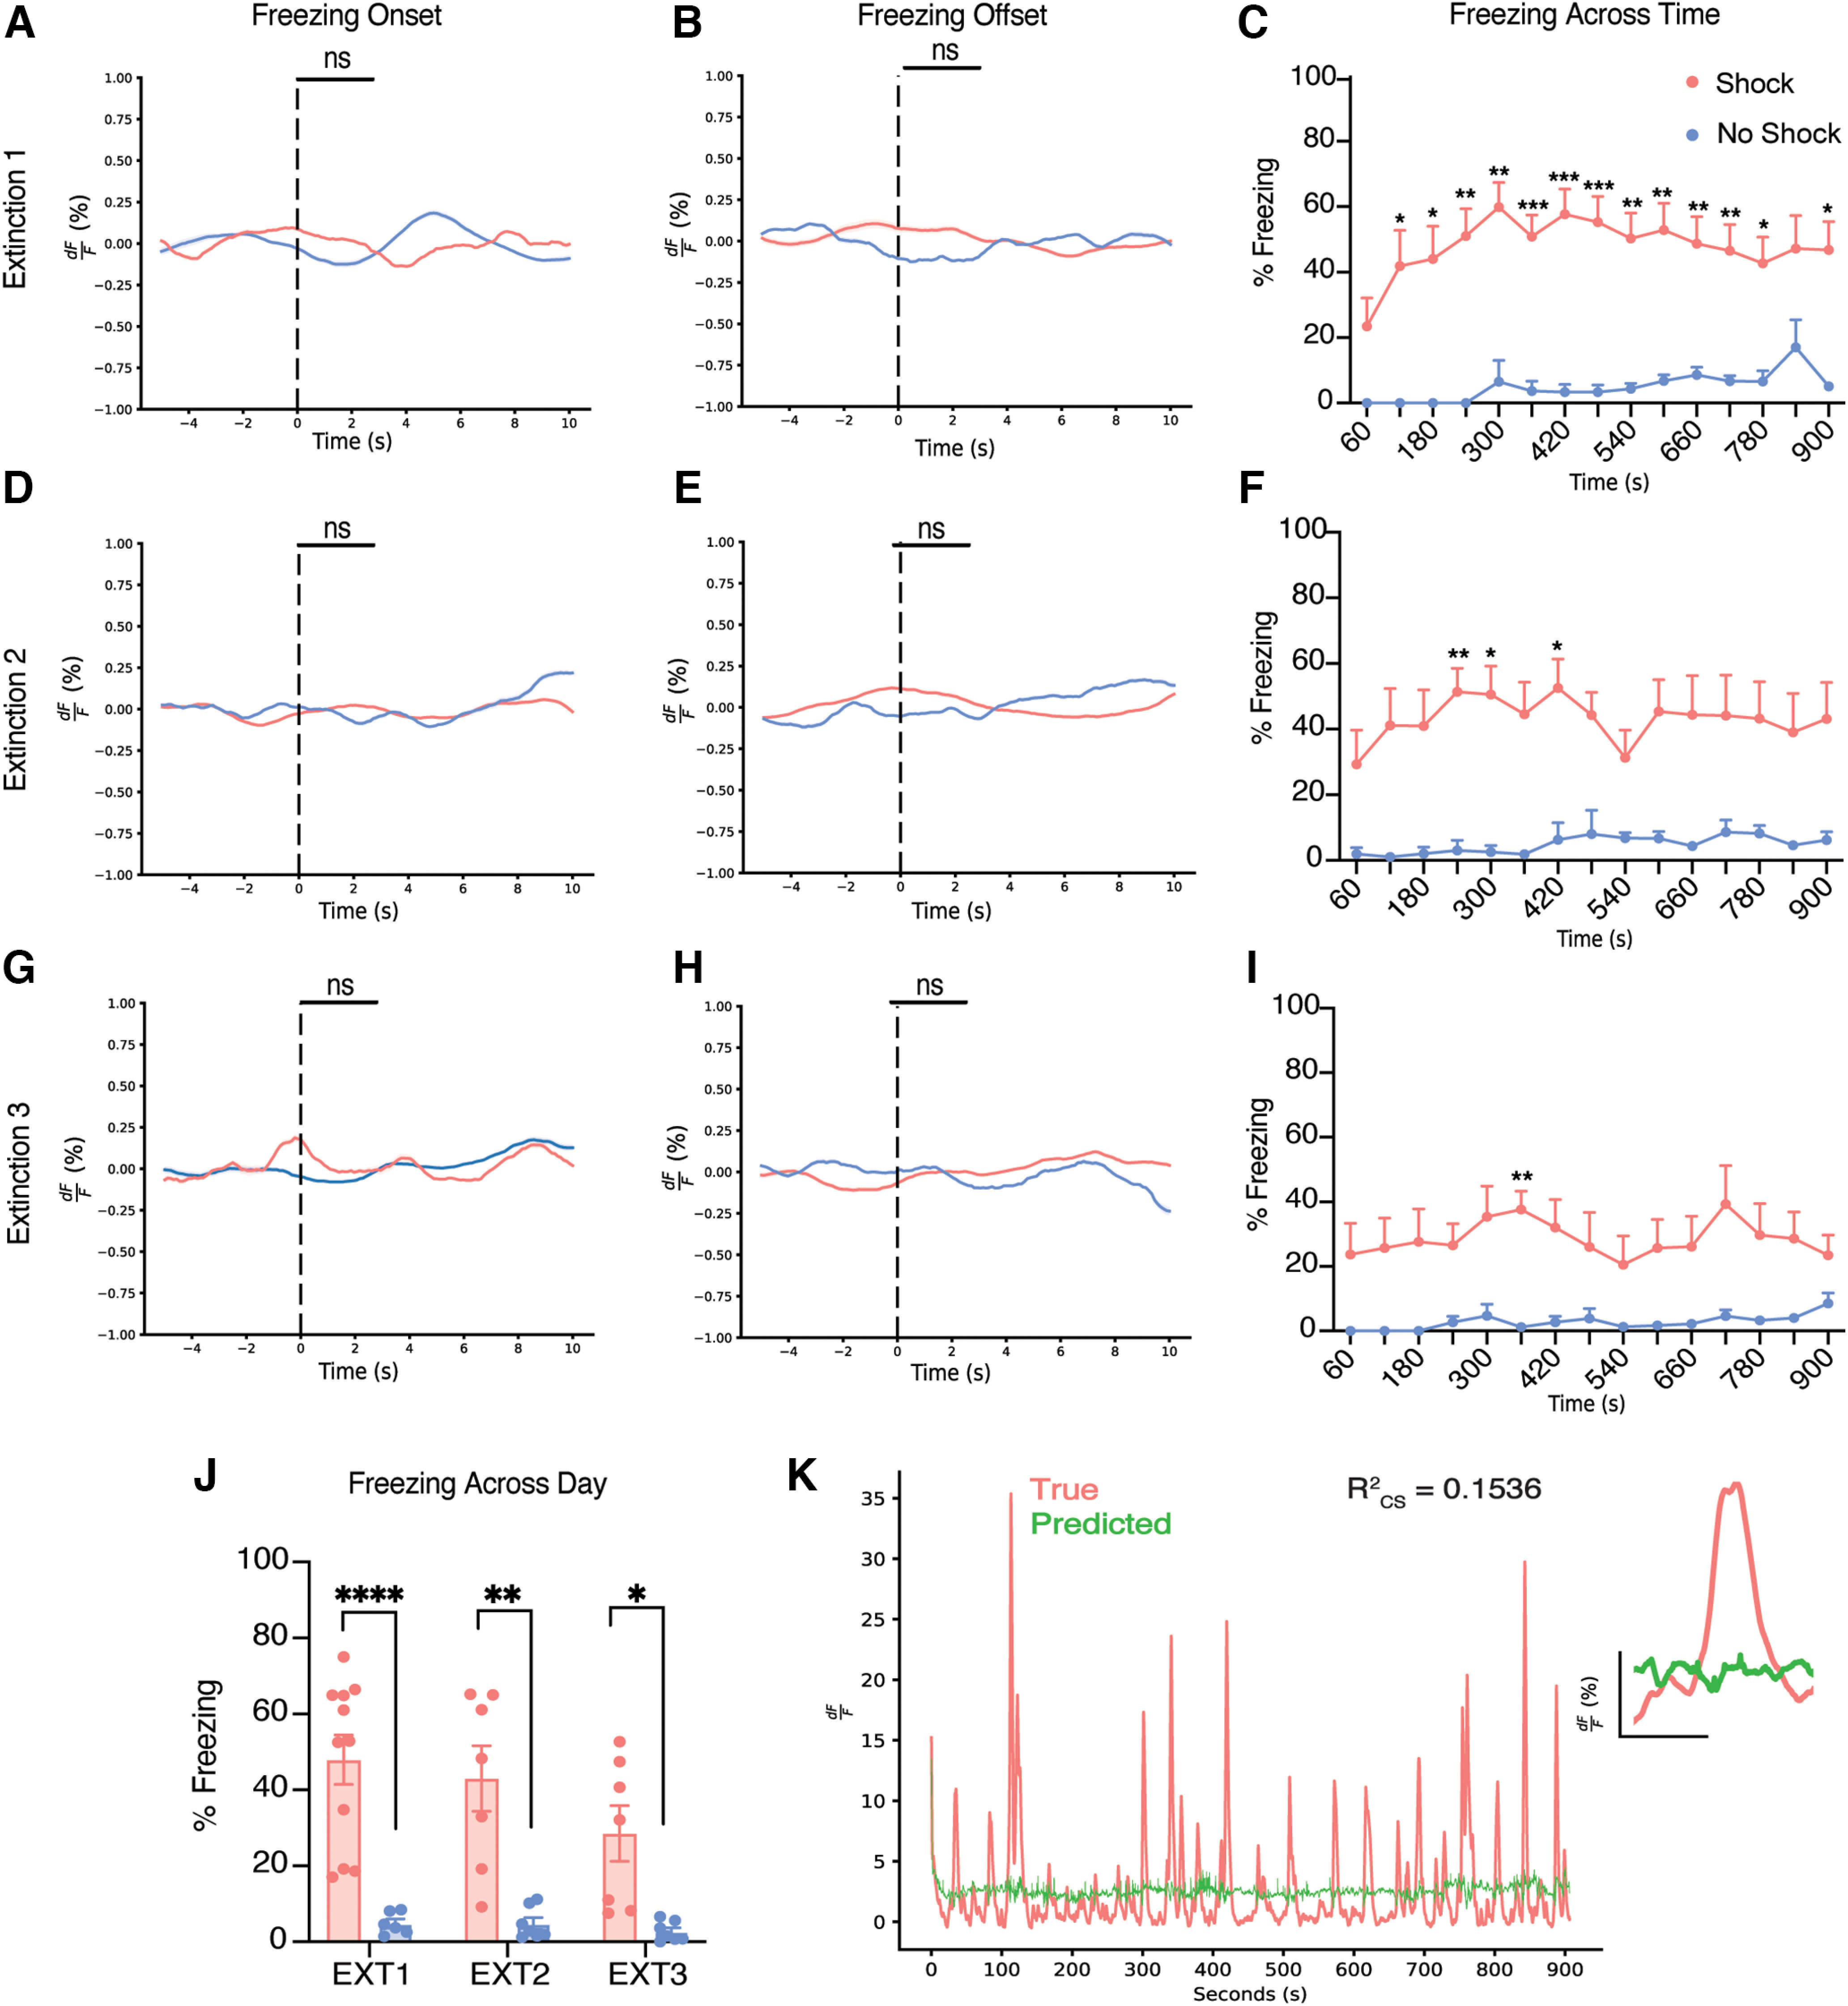
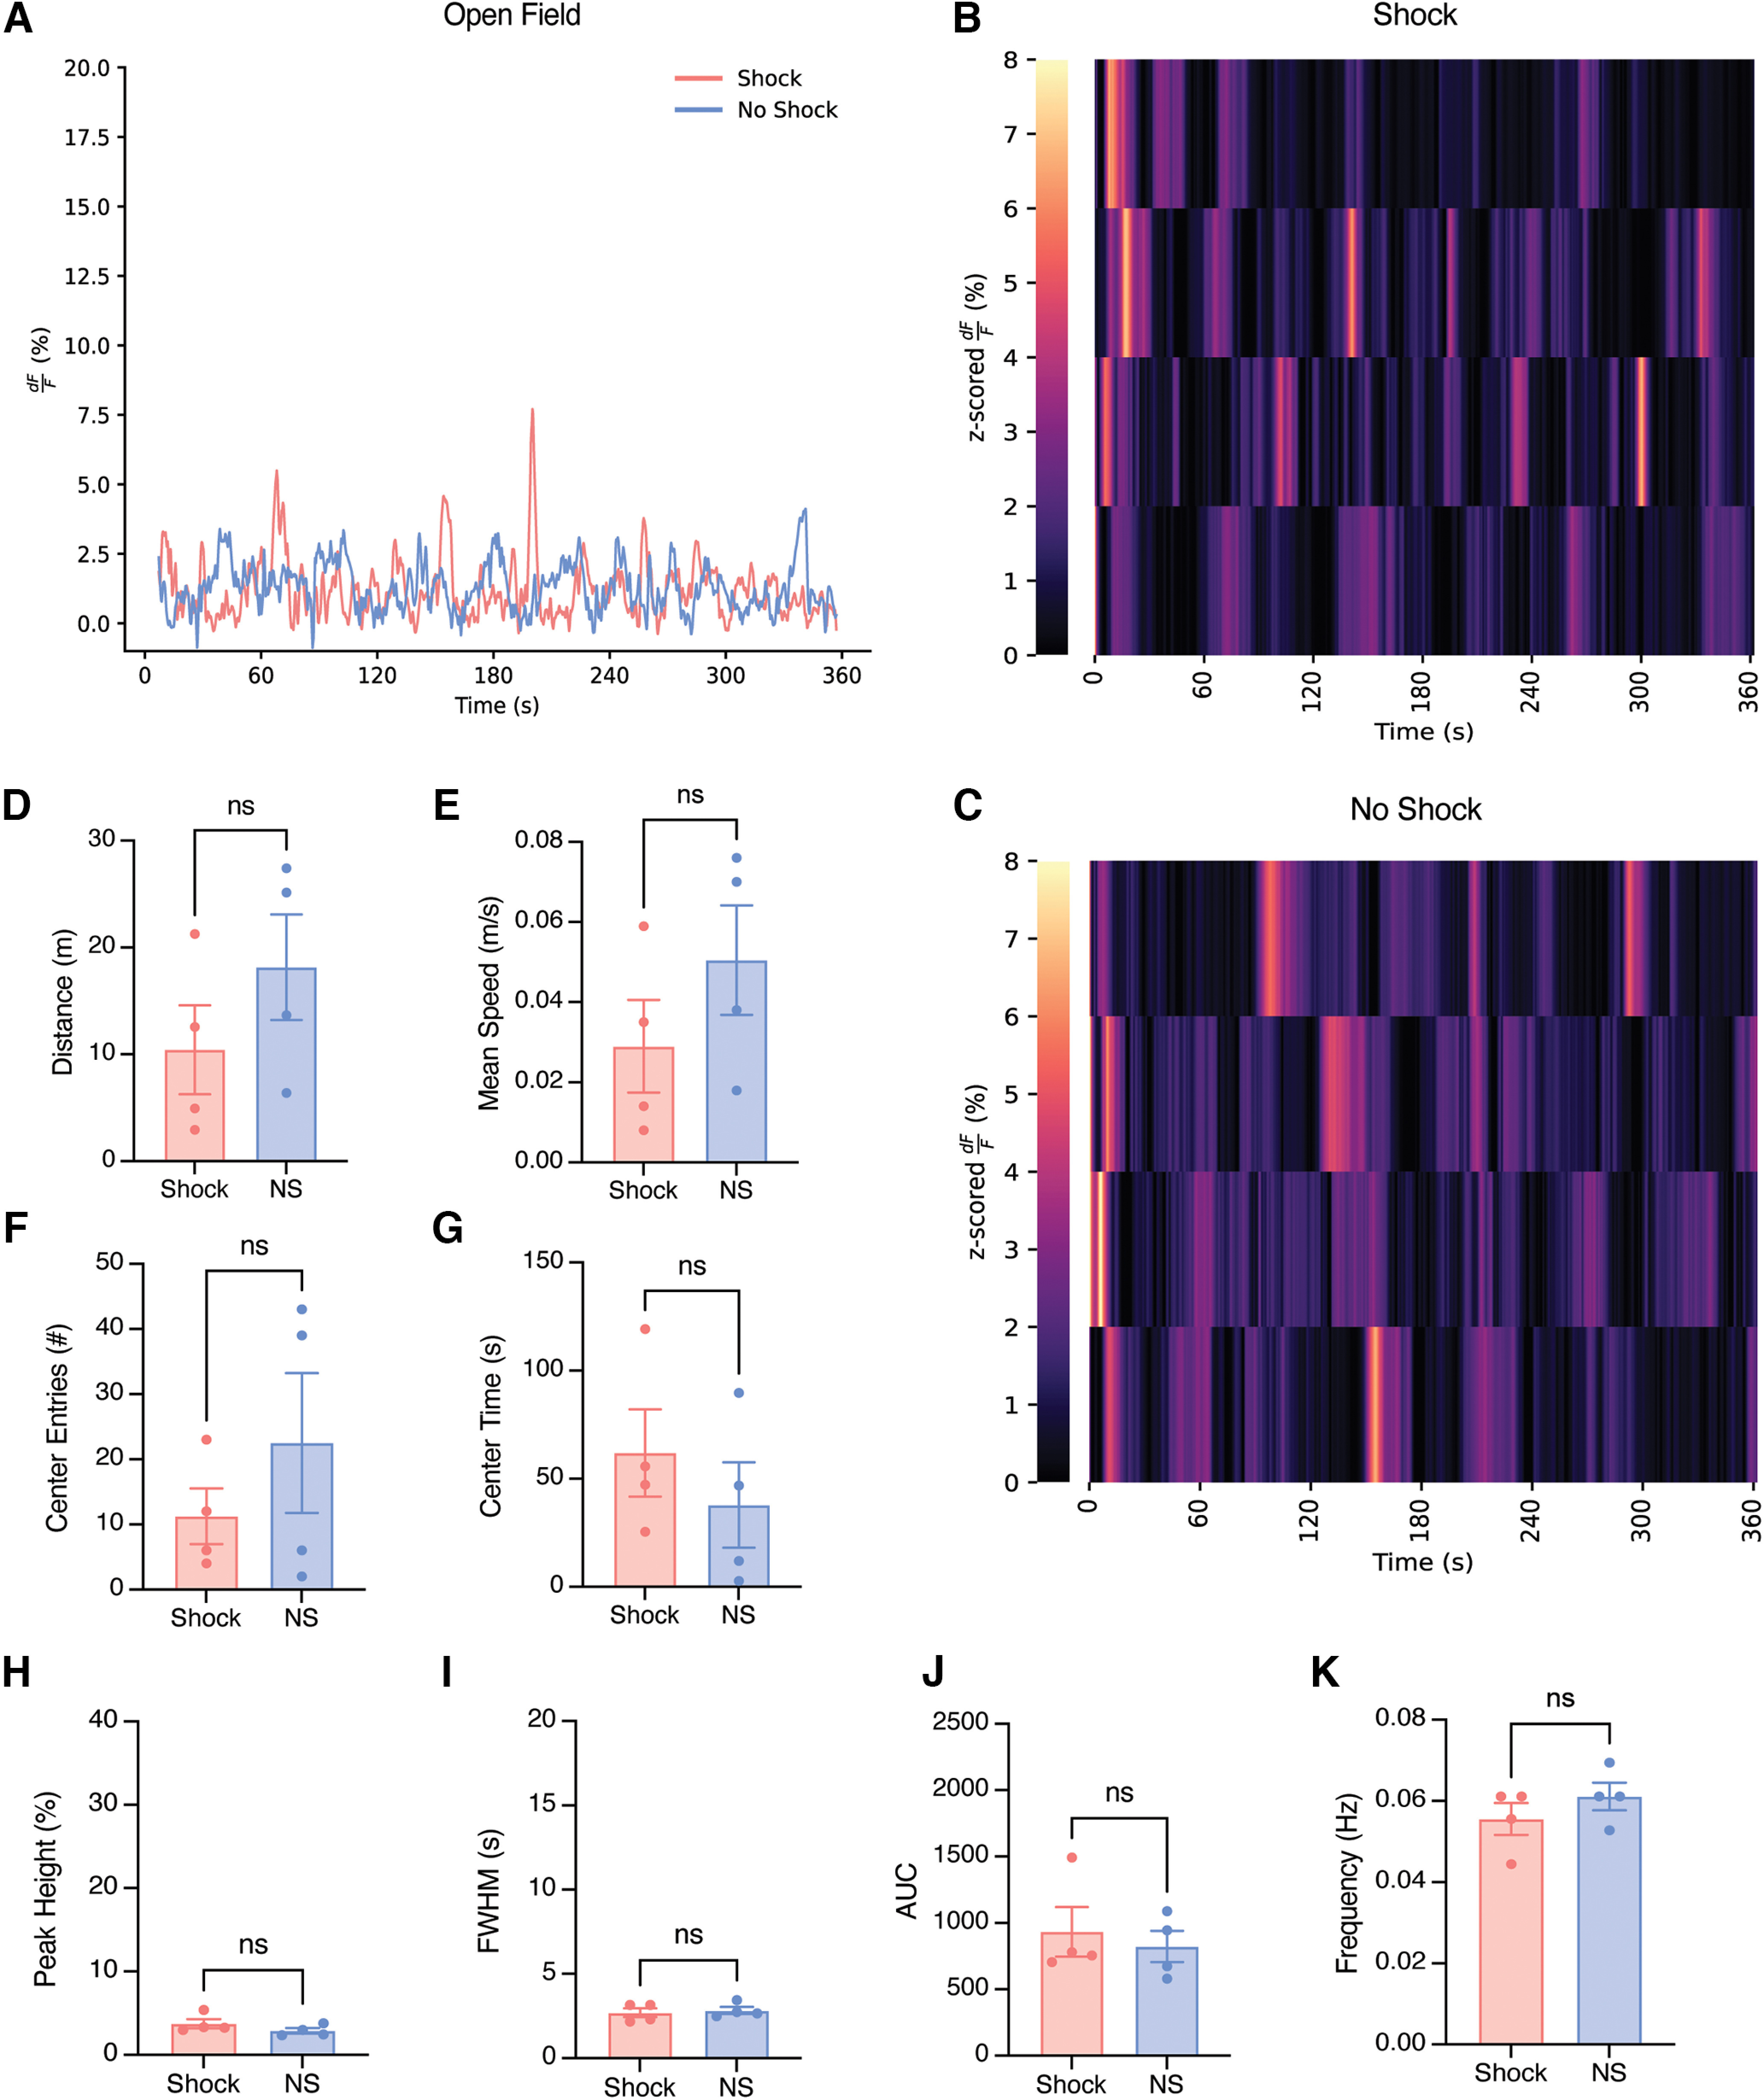
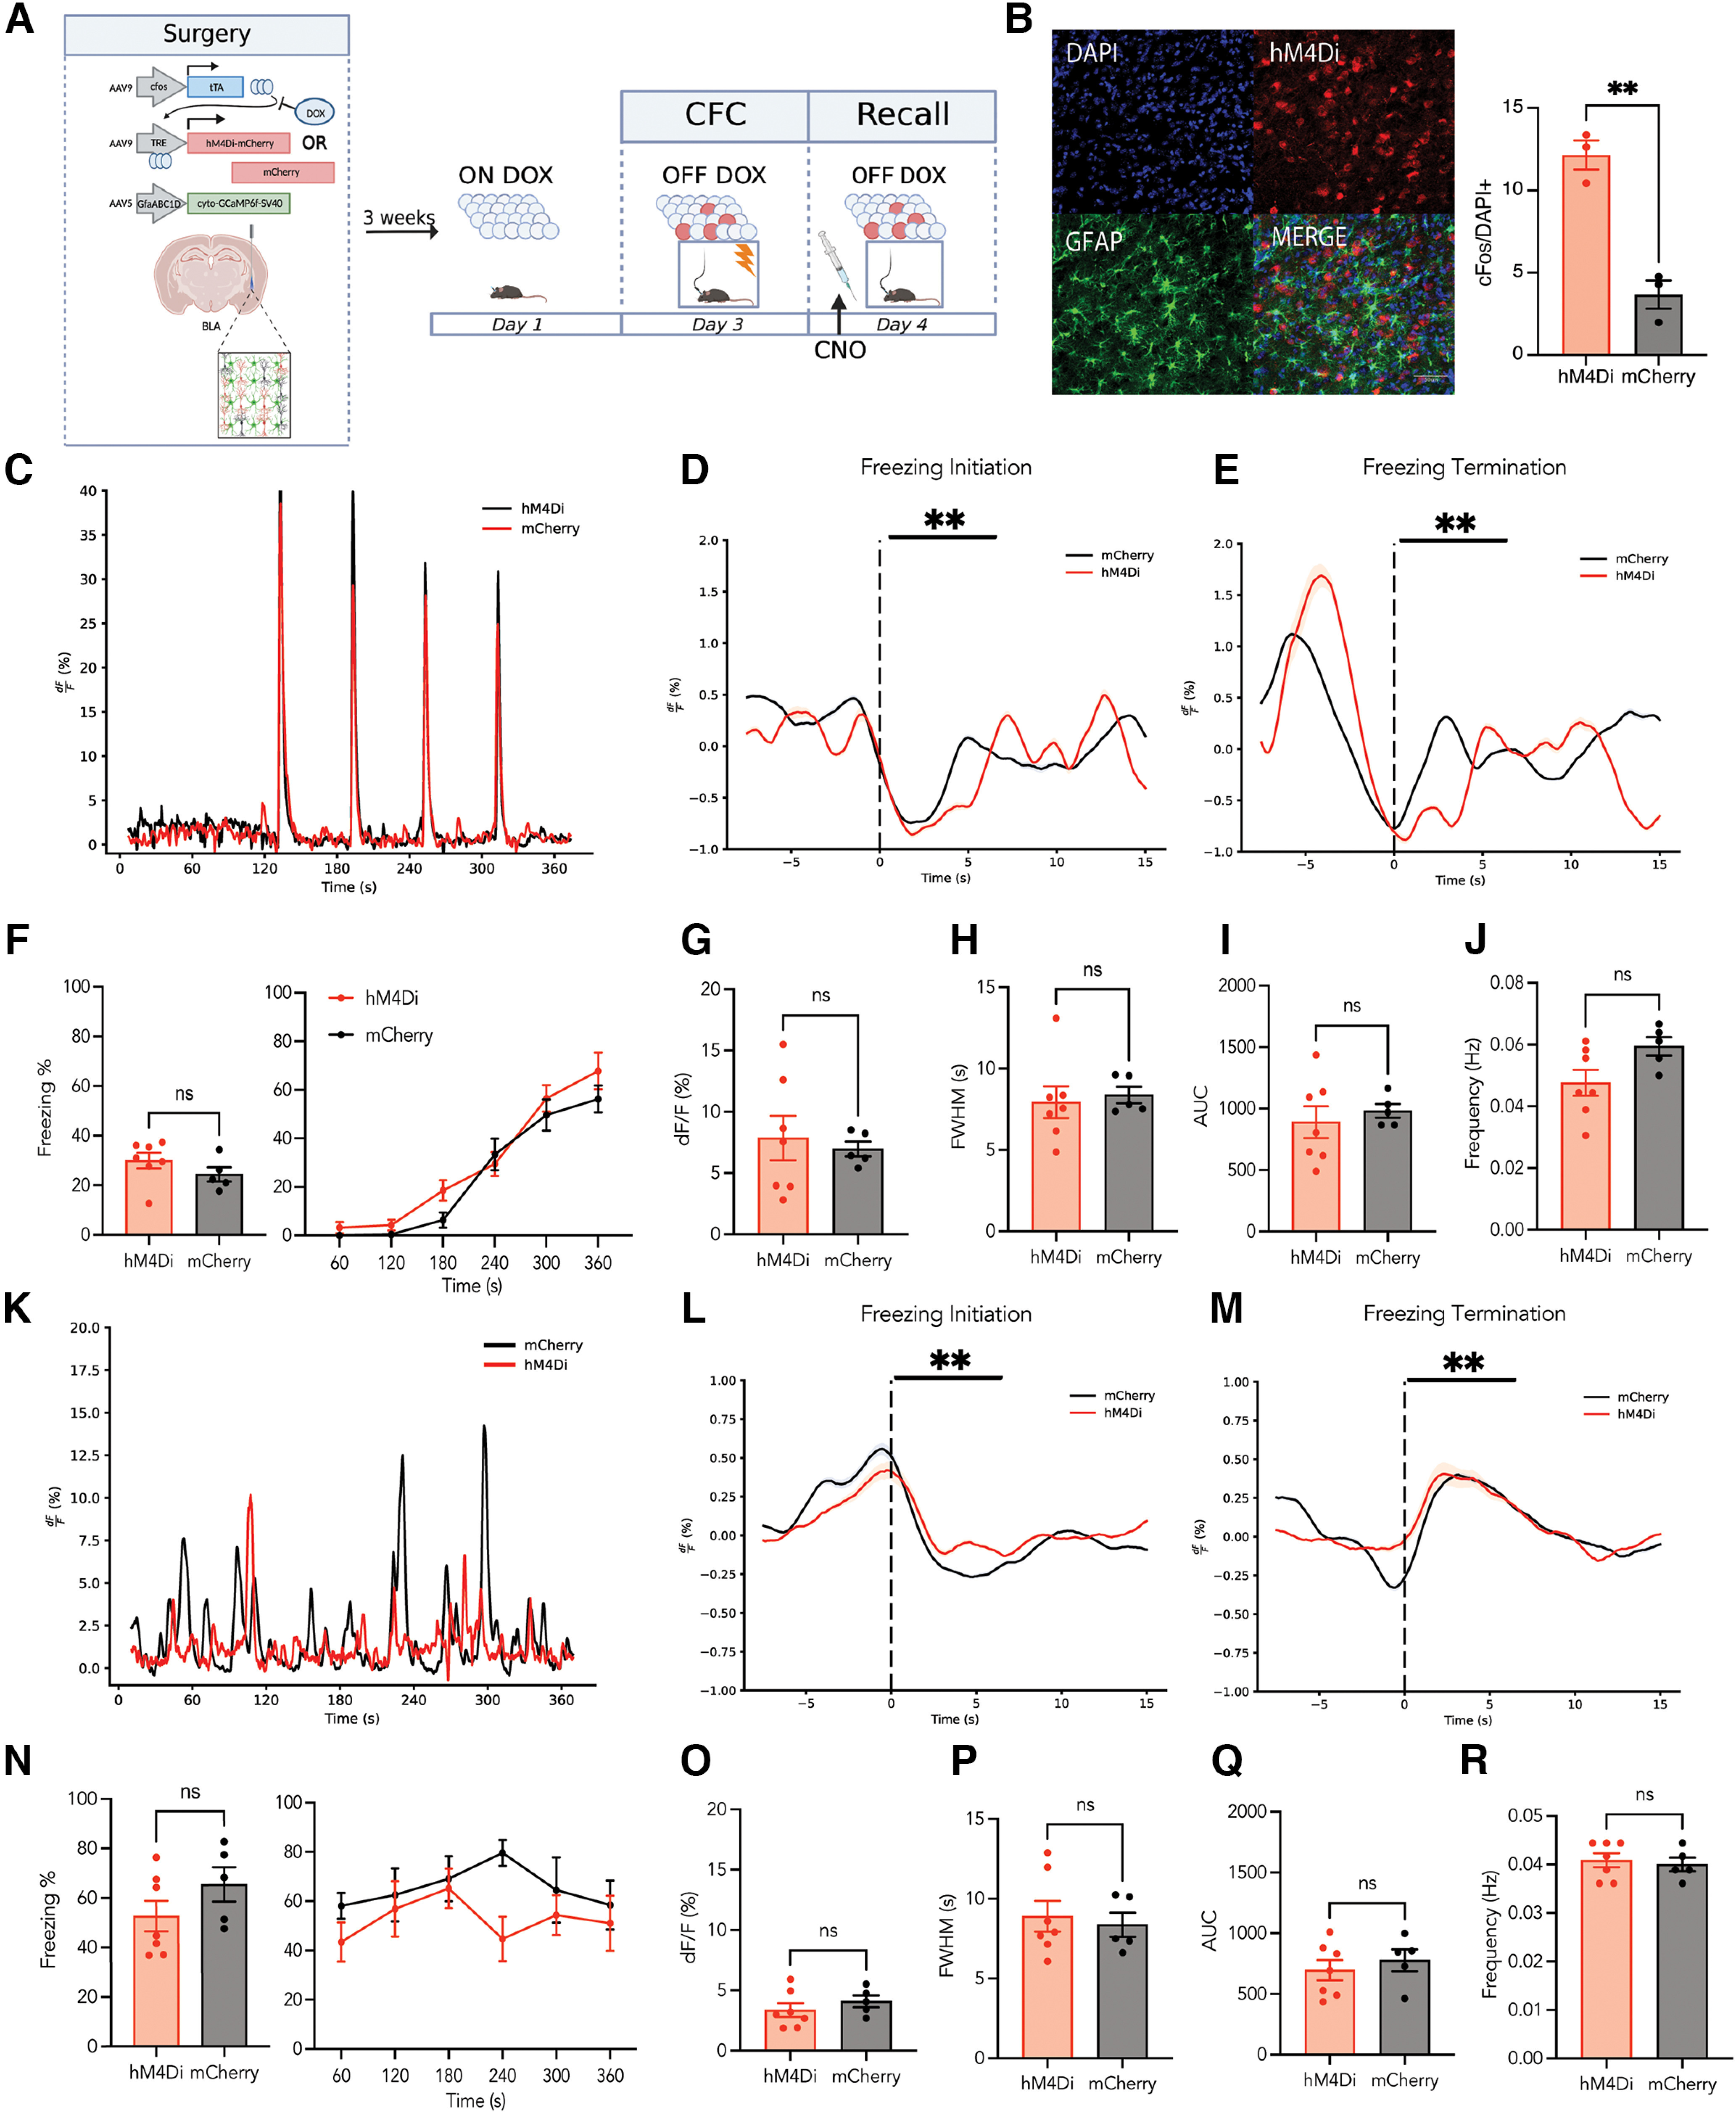
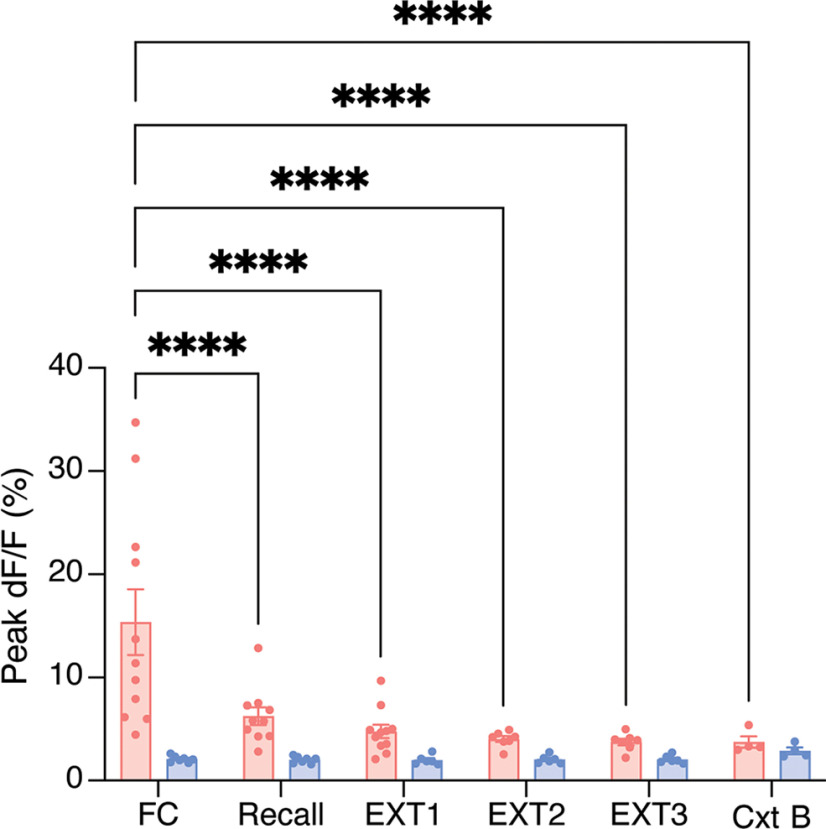
Astrocytes are key cellular regulators within the brain. The basolateral amygdala (BLA) is implicated in fear memory processing, yet most research has entirely focused on neuronal mechanisms, despite a significant body of work implicating astrocytes in learning and memory. In the present study, we used in vivo fiber photometry in C57BL/6J male mice to record from amygdalar astrocytes across fear learning, recall, and three separate periods of extinction. We found that BLA astrocytes robustly responded to foot shock during acquisition, their activity remained remarkably elevated across days in comparison to unshocked control animals, and their increased activity persisted throughout extinction. Further, we found that astrocytes responded to the initiation and termination of freezing bouts during contextual fear conditioning and recall, and this behavior-locked pattern of activity did not persist throughout the extinction sessions. Importantly, astrocytes do not display these changes while exploring a novel context, suggesting that these observations are specific to the original fear-associated environment. Chemogenetic inhibition of fear ensembles in the BLA did not affect freezing behavior or astrocytic calcium dynamics. Overall, our work presents a real-time role for amygdalar astrocytes in fear processing and provides new insight into the emerging role of these cells in cognition and behavior.SIGNIFICANCE STATEMENT We show that basolateral amygdala astrocytes are robustly responsive to negative experiences, like shock, and display changed calcium activity patterns through fear learning and memory. Additionally, astrocytic calcium responses become time locked to the initiation and termination of freezing behavior during fear learning and recall. We find that astrocytes display calcium dynamics unique to a fear-conditioned context, and chemogenetic inhibition of BLA fear ensembles does not have an impact on freezing behavior or calcium dynamics. These findings show that astrocytes play a key real-time role in fear learning and memory.

Keywords: amygdala; astrocytes; calcium; fear; learning; memory.


Figures

Figure 1.
Figure 1.
Population-level calcium recordings of basolateral amygdala astrocytes across contextual fear conditioning, recall, and extinction. A, Viral strategy and fiber implantation strategy for shock and no-shock conditions. The GECI AAV5-GfaABC1D-cyto-GCaMP6f-SV40 was unilaterally injected into the BLA region of wild-type mice. B, C, Representative image of GFAP-GCaMP6f+ (green) and DAPI+ (blue) cell expression within the BLA at 20× magnification (B) and 10× magnification (C). Scale bar, 500 μm. Dashed white lines indicate the approximate location of the unilateral fiber implantation. D, Penetrance of GCaMP6f (2251 GCaMP6f+/2381 GFAP+ = 98.49%; n = 3; 4 slices/mouse). E, Specificity of GCaMP6f (4 Iba-1+/662 GCaMP6f+ = 0.604% microglia; 0 NeuN+/1064 GCaMP6f+ = 0.00% neurons; 2242 GFAP+/2256 GCaMP6f+ = 99.4% astrocyte; n = 3; 4 slices/mouse). F, Representative expression of GCaMP6f expression and overlap with microglial (Iba-1), astrocytic (GFAP), and neuronal (NeuN) markers. Scale bar, 50 μm. G, In vivo fiber photometry setup. A 470 nm LED delivered an excitation wavelength to GCaMP6f-expressing astrocytes via a patch cord and single fiber optic implant in freely moving mice. The emitted 530 nm signal from the indicator was collected via the same patch cord and fiber, spectrally separated using a dichroic mirror, passed through a series of filters and focused on a scientific camera. A representative calcium time series trace is shown for astrocytic calcium. Calcium-independent isosbestic signal was recorded simultaneously to account for motion, tissue autofluorescence, and photobleaching across time. H, Behavioral paradigm; mice underwent CFC on day 1 in Cxt A for 360 s where they received four 1.5 mA foot shocks. On day 2, mice were placed back into Cxt A for contextual recall for 360 s in the absence of foot shock. On days 3–5, mice underwent three contextual extinction sessions for 900 s each. On day 6, mice were placed in Cxt B for 360 s. Mice were perfused and brains extracted for histologic assessment.
Figure 2.
Figure 2.
Basolateral amygdala astrocytes robustly respond to foot shock during contextual fear conditioning and exhibit unique calcium event dynamics compared with no-shock controls. A, Representative calcium time series (dF/F percentage) for shock and no-shock conditions during the 360 s CFC session; 1.5 mA foot shocks occurred at the 120, 180, 240 and 300 s time points, as indicated by vertical dashed lines. B, Perievent analysis for 1.5 mA foot shock, with the onset of foot shock occurring at the dashed line (time = 0). C, Quantification of the average percentage change in peak dF/F at the onset of foot shock. D, E, The z-scored dF/F (percentage) across CFC for shock (D) and no-shock conditions (E); each row represents a single subject across time within the session. F, G, Perievent analysis for the initiation (C) and termination (E) of freezing behavior, with each event occurring at the dashed line (time = 0). H, Average percentage freezing (left) and freezing across time within the CFC session (right). I–L, Calcium event metrics; peak height (I), full-width half-maximum (J), area under the curve (K), and frequency (L). M, True (pink) and predicted (green) produced from a generalized linear model. All error bars and bands indicate standard error of the mean (SEM). For t tests and ANOVAs, p ≤ 0.05, **p ≤ 0.01, ***p ≤ 0.001, ****p ≤ 0.0001; ns, Not significant. For perievent metrics, *95% CI, **99% CI; ns. For t tests and ANOVAs, shock n = 11, no shock n = 7. For foot shock perievents, shock n = 11, no shock n = 7. For freezing perievents, shock n = 11, no shock n = 2 because of mice not freezing during this session.
Figure 3.
Figure 3.
BLA astrocytes respond reliably to the initiation and termination of freezing behavior during contextual recall. A, Representative calcium time series (dF/F percentage) for shock and no-shock conditions during the 360 s recall session in the absence of foot shock. B–E, The z-scored dF/F (percentage) across recall for (B) shock and (D) no-shock conditions; each row represents a single subject across time within the session. Perievent analysis for the initiation (C) and termination (E) of freezing behavior, with each event occurring at the dashed line (time = 0). F, G, Behavioral analysis; average percentage freezing (F) and freezing across time within the recall session (G). H–K, Calcium event metrics; peak height (H), area under the curve (I), full-width half-maximum (J), and frequency (K). L, True and predicted traces produced from a generalized linear model. Error bars indicate SEM. For t tests and ANOVAs, p ≤ 0.05, **p ≤ 0.01, ***p ≤ 0.001, ****p ≤ 0.0001; ns, Not significant. For perievent metrics, *95% CI, **99% CI; ns. For t tests and ANOVAs, shock n = 11, no shock n = 7. For freezing perievents, shock n = 11, no shock n = 6 because of a mouse not freezing during the recall session.
Figure 4.
Figure 4.
BLA astrocytes in the shock condition exhibit increased peak height, decreased duration, and increased total fluorescence of events compared with no shock, but these do not change across extinction days. A–I, Representative calcium time series (dF/F percentage) for shock and no-shock conditions during the 900 s contextual extinction sessions; extinction day 1 (EXT1) (A), extinction day 2 (EXT2) (D), extinction day 3 (EXT3) (G). B, E, H, The z-scored dF/F (percentage) across extinction for shock condition; each row represents a single subject across time within the session. C, F, I, The z-scored dF/F (percentage) across extinction for the no-shock condition; each row represents a single subject across time within the session. J–M, Calcium event metrics; peak height (J), full-width half-maximum (K), area under the curve (L), and frequency across all three d of extinction (M). Error bars indicate SEM. For t tests, p ≤ 0.05, **p ≤ 0.01, ***p ≤ 0.001, ****p ≤ 0.0001; ns, Not significant. Extinction 1, shock n = 11, no shock n = 6 (For the no-shock group, recording for one animal was ∼90 s short. This animal was excluded from the raster plot and behavioral analysis but still used for event metric calculations). Extinction 2, shock n = 7, no shock n = 6. Extinction 3, shock n = 7, no shock n = 6.
Figure 5.
Figure 5.
BLA astrocytic calcium does not respond to the initiation or termination of freezing behavior during extinction sessions. A–I, Perievent analysis for the initiation (A) and termination (B) of freezing behavior, with each event occurring at the dashed line (time = 0) for extinction day 1. Perievent analysis for the initiation (D) and termination (E) of freezing behavior, with each event occurring at the dashed line (time = 0) for extinction day 2. Perievent analysis for the initiation (G) and termination (H) of freezing behavior, with each event occurring at the dashed line (time = 0) for extinction day 3. Percentage freezing across time within extinction day 1 (C), extinction day 2 (F), and extinction day 3 (I). J, Average percentage freezing across 3 d of extinction for shock and no-shock conditions. K, True and predicted traces produced from a generalized linear model. Error bars indicate SEM. For t tests and ANOVAs, p ≤ 0.05, **p ≤ 0.01, ***p ≤ 0.001, ****p ≤ 0.0001; ns, Not significant. For perievent metrics, *95% CI, **99% CI; ***99.9; ns. Extinction 1, shock n = 11, no shock n = 6. (For the no-shock group, the recording for one animal was ∼90 s short. This animal was excluded from the raster plot and behavioral analysis but still used for event metric calculations). Extinction 2, shock n = 7, no shock = 6. Extinction 3, shock n = 7, no shock n = 6.
Figure 6.
Figure 6.
Astrocytic calcium event characteristics and behavior in a novel open field environment do not differ between shock and no-shock groups. A, Representative calcium time series (dF/F percentage) for shock (coral) and no-shock (blue) conditions during the 360 s novel open field Cxt B session. B, C, The z-scored dF/F (percentage) in Cxt B for shock and no-shock conditions; each row represents a single subject across time within the session. DG, Behavioral measures; distance traveled (m; D), mean speed (m/s; E), number of center entries (F), and time spent in the center (G). H–K, Calcium event metrics; peak height (%; H), full-width half-maximum (s; I), AUC (J), and frequency (Hz; K). Error bars indicate SEM. For t tests, p ≤ 0.05, **p ≤ 0.01, ***p ≤ 0.001, ****p ≤ 0.0001; ns, Not significant. Open field Cxt B, shock n = 4, no shock n = 4.
Figure 7.
Figure 7.
Neuronal fear engram inhibition in the BLA during recall does not modify freezing behavior or astrocytic calcium event characteristics. A, Surgical and behavioral schematic. The genetically encoded calcium indicator, AAV5-GfaABC1D-cyto-GCaMP6f-SV40, was unilaterally injected into the BLA in combination with bilateral injection of either AAV9-c-fos-tTA-TRE-hM4Di-mCherry (hM4Di) or AAV9-c-fos-tTA-TRE-mCherry (mCherry) control virus to allow chemogenetic control of labeled cells while recording astrocytic calcium dynamics. On day 1, mice were taken off of their Dox diet to allow for the opening of the labeling window 48 h in advance of behavioral testing. On day 3, mice underwent CFC on day 1 in Cxt A for 360 s where they received four 1.5 mA foot shocks. They were immediately placed back on their Dox diet, thus closing the labeling window. On day 4, mice were placed back into Cxt A for contextual recall for 360 s in the absence of foot shock. Thirty minutes before this session, CNO was administered at 3 mg/kg to inhibit the labeled engram during recall. Ninety minutes after the start of the behavioral session, mice were perfused to capture peak endogenous c-fos protein levels. B, Left, Representative images of hM4Di-mCherry/GFAP costaining (red and green, respectively) and DAPI+ cells (blue). Scale bar indicates 50 μm. Right, The percentage of c-fos/DAPI counts in the hM4Di and mCherry groups. C, Representative calcium time series (dF/F percentage) for hM4Di (red) and mCherry (black) conditions during the 360 s CFC session. D, E, Peri-event analysis for the initiation (D) and termination (E) of freezing behavior during CFC, with each event occurring at the dashed line (time = 0). F, Behavioral analysis for CFC. Left, Average percentage freezing. Right, Freezing across time within the recall session. G–J, Calcium event metrics for CFC, peak height (G), full-width half-maximum (H), area under the curve (I), and frequency (J). K, Representative calcium time series (dF/F percentage) for hM4Di (red) and mCherry (black) conditions during the 360 s recall session. L, M, Perievent analysis for the initiation (L) and termination (M) of freezing behavior during recall, with each event occurring at the dashed line (time = 0). N, Behavioral analysis for recall. Left, Average percentage freezing. Right, Freezing across time within the recall session. O–R, Calcium event metrics for recall, peak height (O), full-width half-maximum (P), area under the curve (Q), and frequency (R). All error bars and bands indicate SEM. For t tests and ANOVAs, p ≤ 0.05, **p ≤ 0.01, ***p ≤ 0.001, ****p ≤ 0.0001; ns, Not significant. For perievent metrics, *95% CI, **99% CI; ns; hM4Di = 7, mCherry = 5.
Figure 8.
Figure 8.
Astrocytic calcium dF/F does not change after contextual fear conditioning. dF/F (percentage) across FC, recall, extinction (EXT1–3), and exposure to the novel open field context (Cxt B). All error bars and bands indicate SEM. For ANOVA, p ≤ 0.05, **p ≤ 0.01, ***p ≤ 0.001, ****p ≤ 0.0001; ns, Not significant. Shock n = 4–11, no shock n = 4–7.

References

    1. Adamsky A, Goshen I (2018) Astrocytes in memory function: pioneering findings and future directions. Neuroscience 370:14–26. 10.1016/j.neuroscience.2017.05.033 - DOI - PubMed
    1. Adamsky A, Kol A, Kreisel T, Doron A, Ozeri-Engelhard N, Melcer T, Refaeli R, Horn H, Regev L, Groysman M, London M, Goshen I (2018) Astrocytic activation generates de novo neuronal potentiation and memory enhancement. Cell 174:59–71.e14. 10.1016/j.cell.2018.05.002 - DOI - PubMed
    1. Agulhon C, Petravicz J, McMullen AB, Sweger EJ, Minton SK, Taves SR, Casper KB, Fiacco TA, McCarthy KD (2008) What is the role of astrocyte calcium in neurophysiology? Neuron 59:932–946. 10.1016/j.neuron.2008.09.004 - DOI - PMC - PubMed
    1. Akther S, Hirase H (2022) Assessment of astrocytes as a mediator of memory and learning in rodents. Glia 70:1484–1505. 10.1002/glia.24099 - DOI - PubMed
    1. Alberini CM, Cruz E, Descalzi G, Bessières B, Gao V (2018) Astrocyte glycogen and lactate: new insights into learning and memory mechanisms. Glia 66:1244–1262. 10.1002/glia.23250 - DOI - PMC - PubMed

Publication types

LinkOut - more resources