

The Nature and Origin of Synaptic Inputs to Vestibulospinal Neurons in the Larval Zebrafish
- PMID: 37268420
- PMCID: PMC10241381
- DOI: 10.1523/ENEURO.0090-23.2023
The Nature and Origin of Synaptic Inputs to Vestibulospinal Neurons in the Larval Zebrafish
Abstract
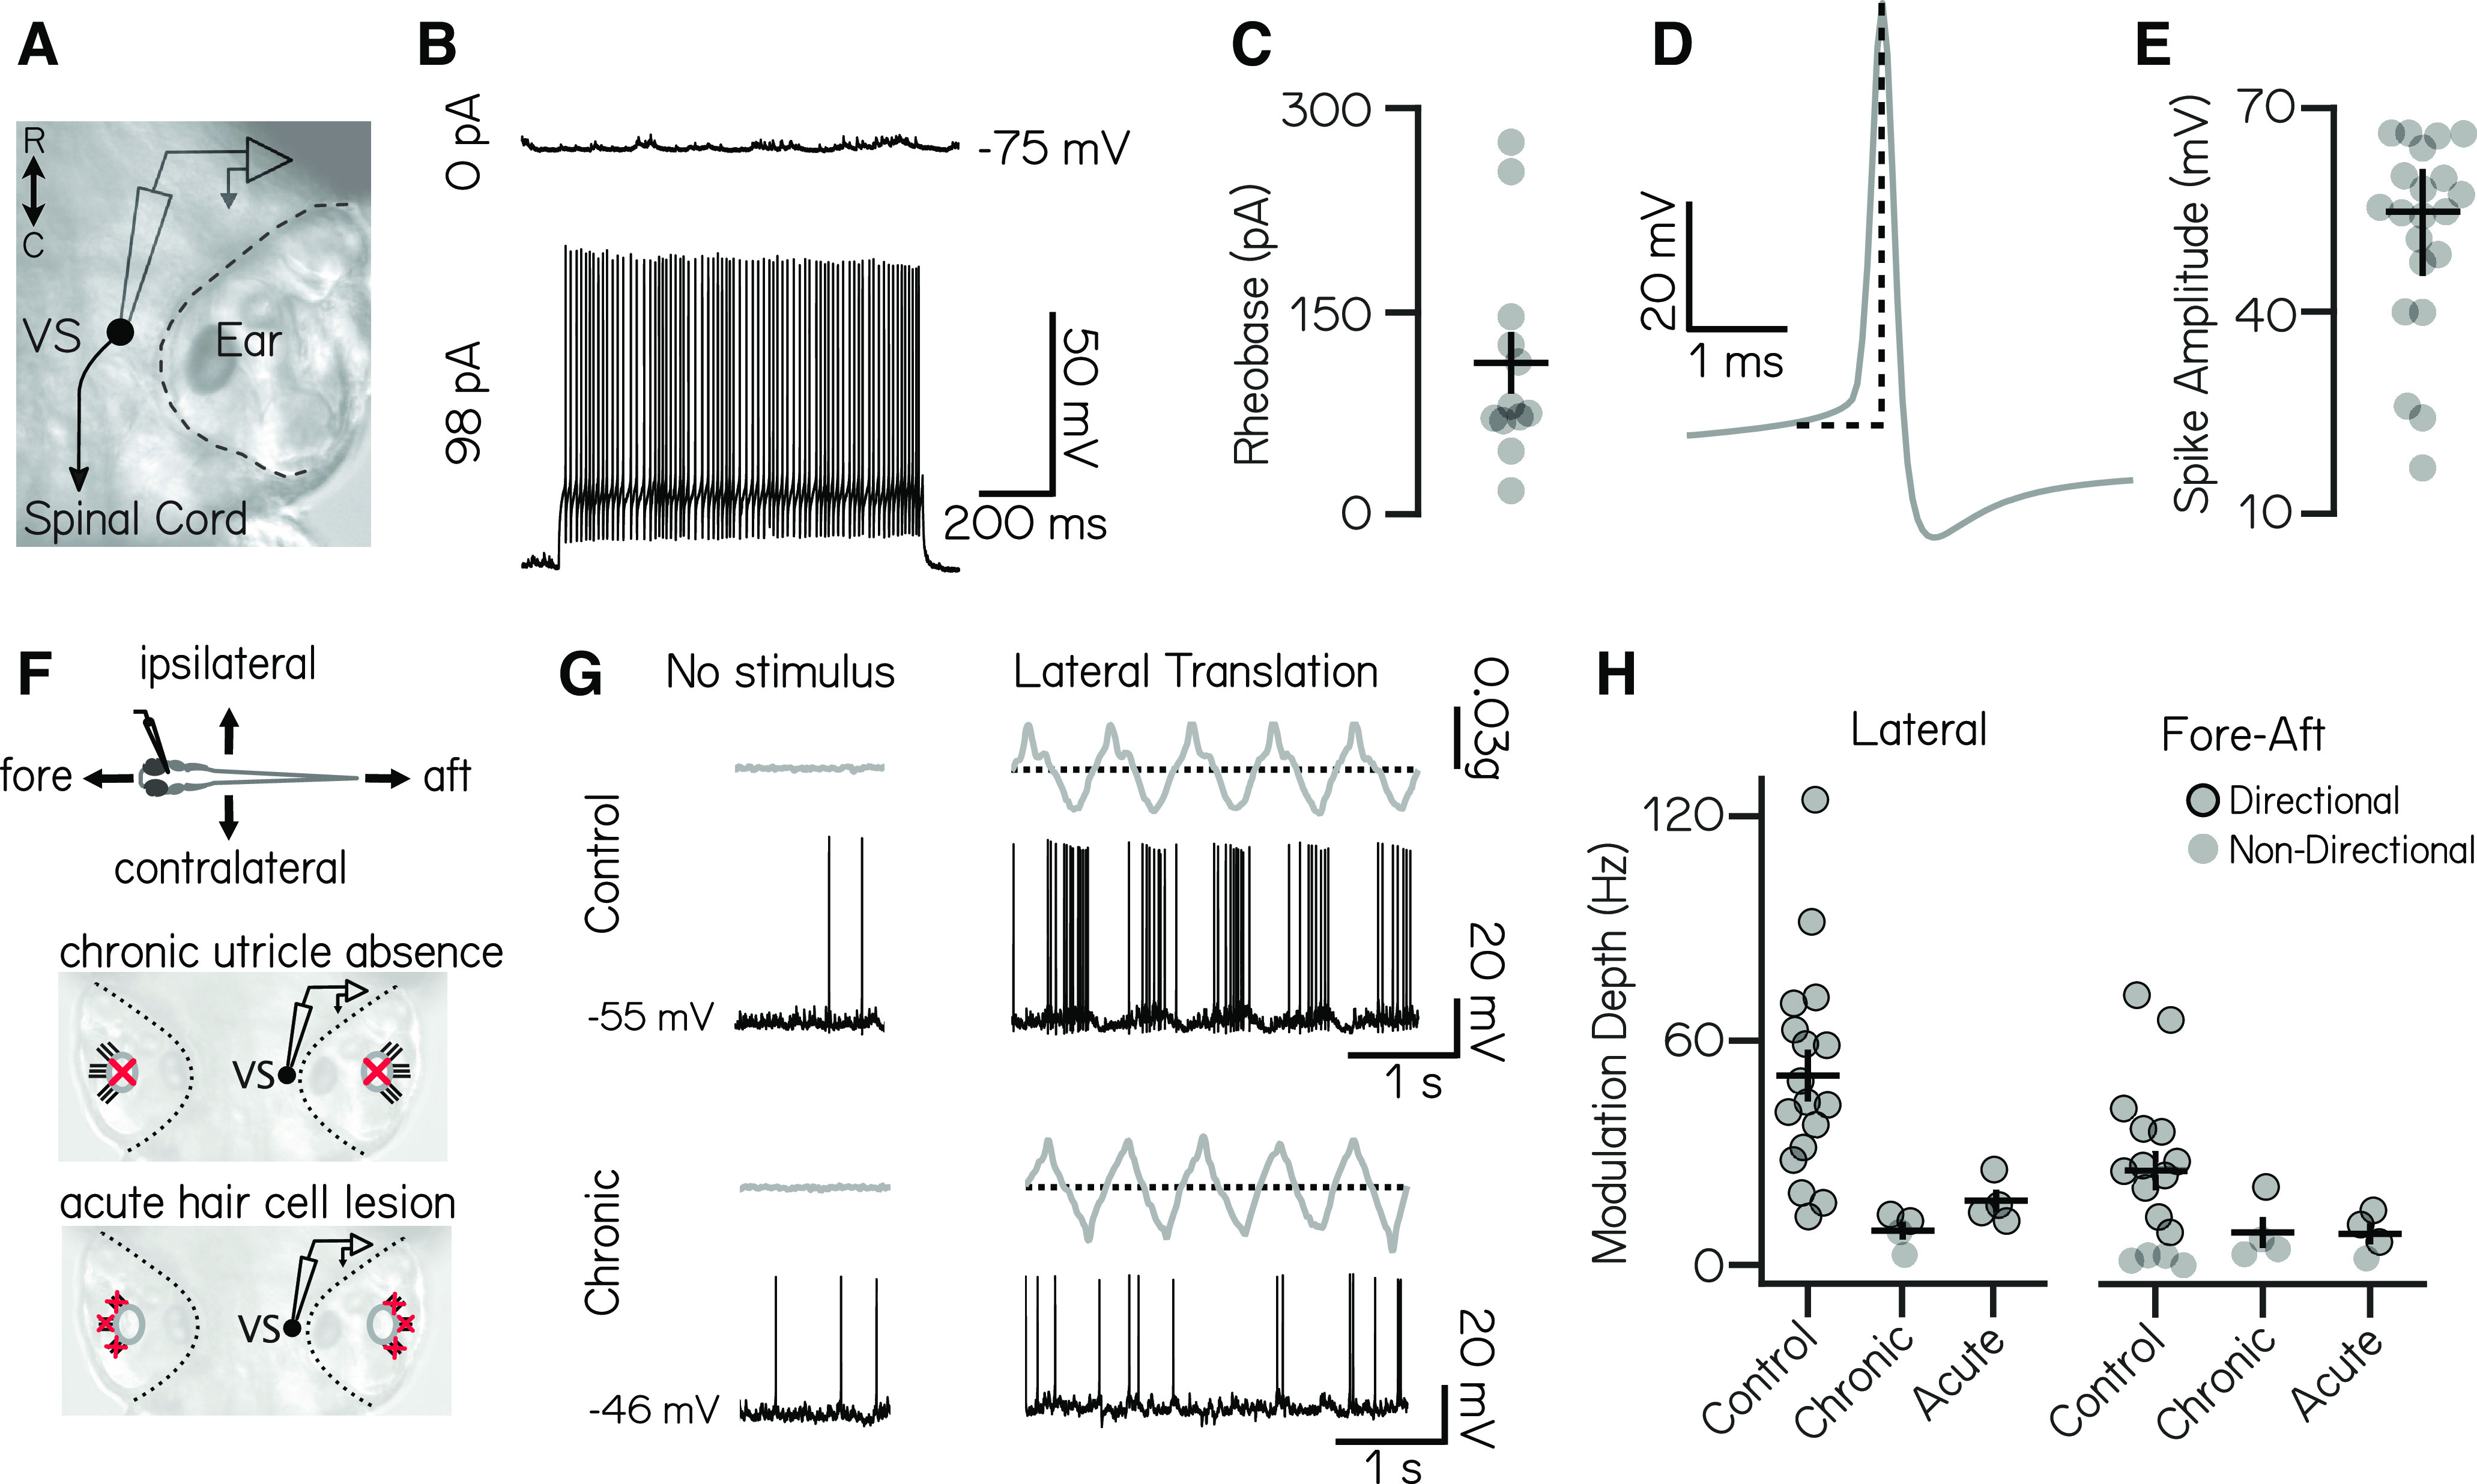
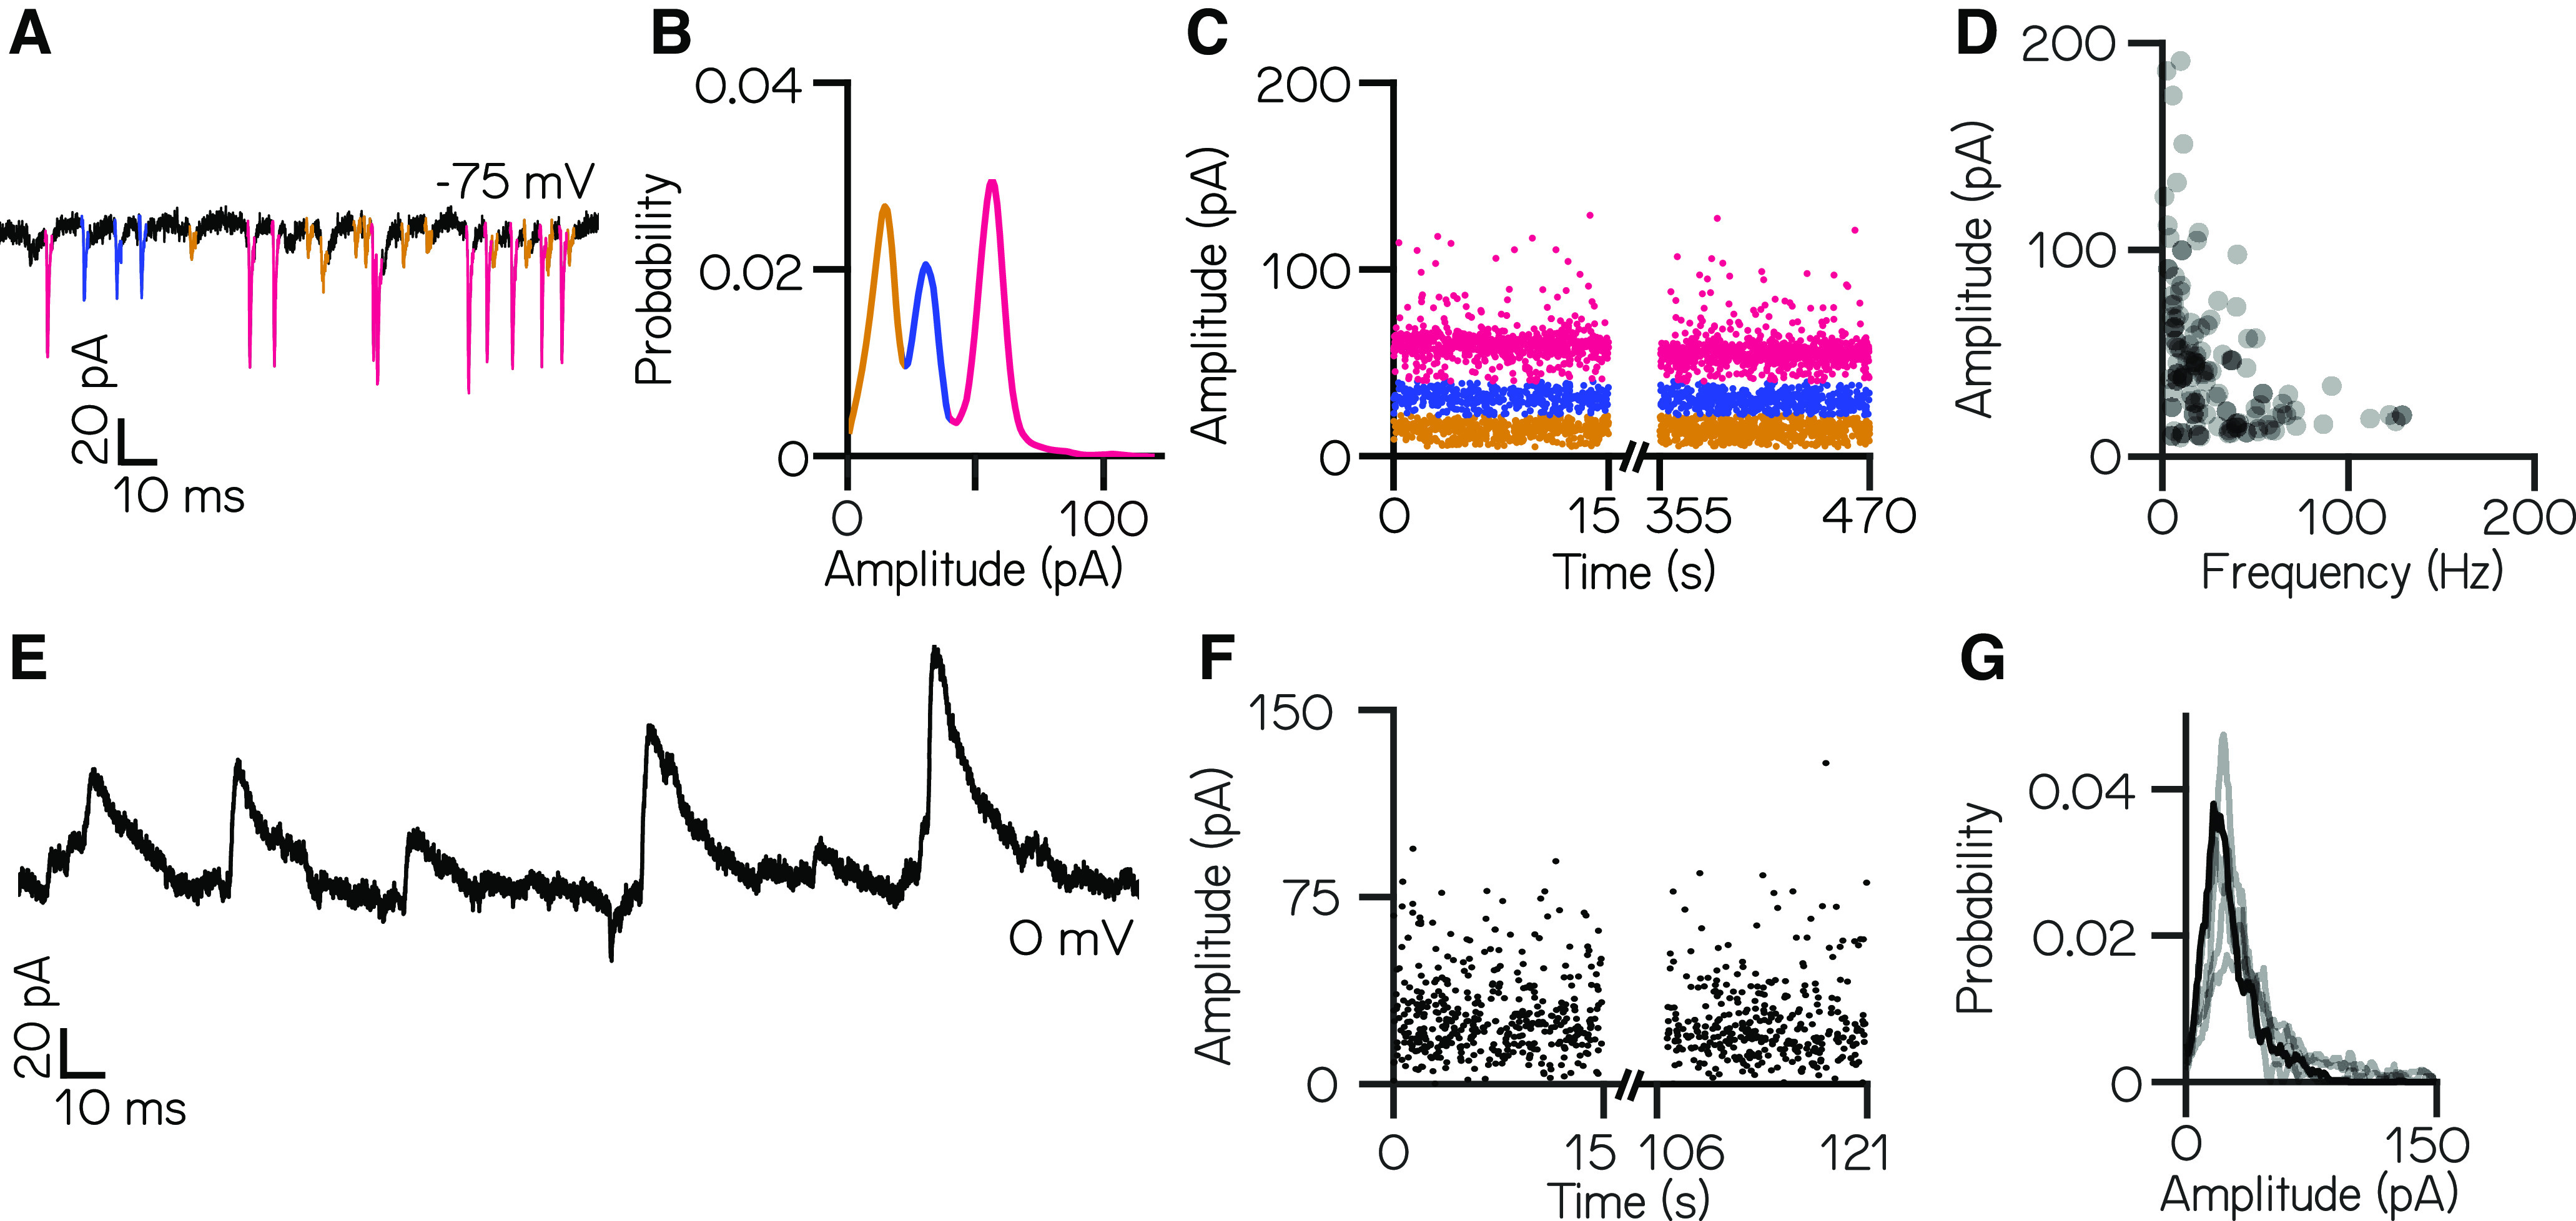
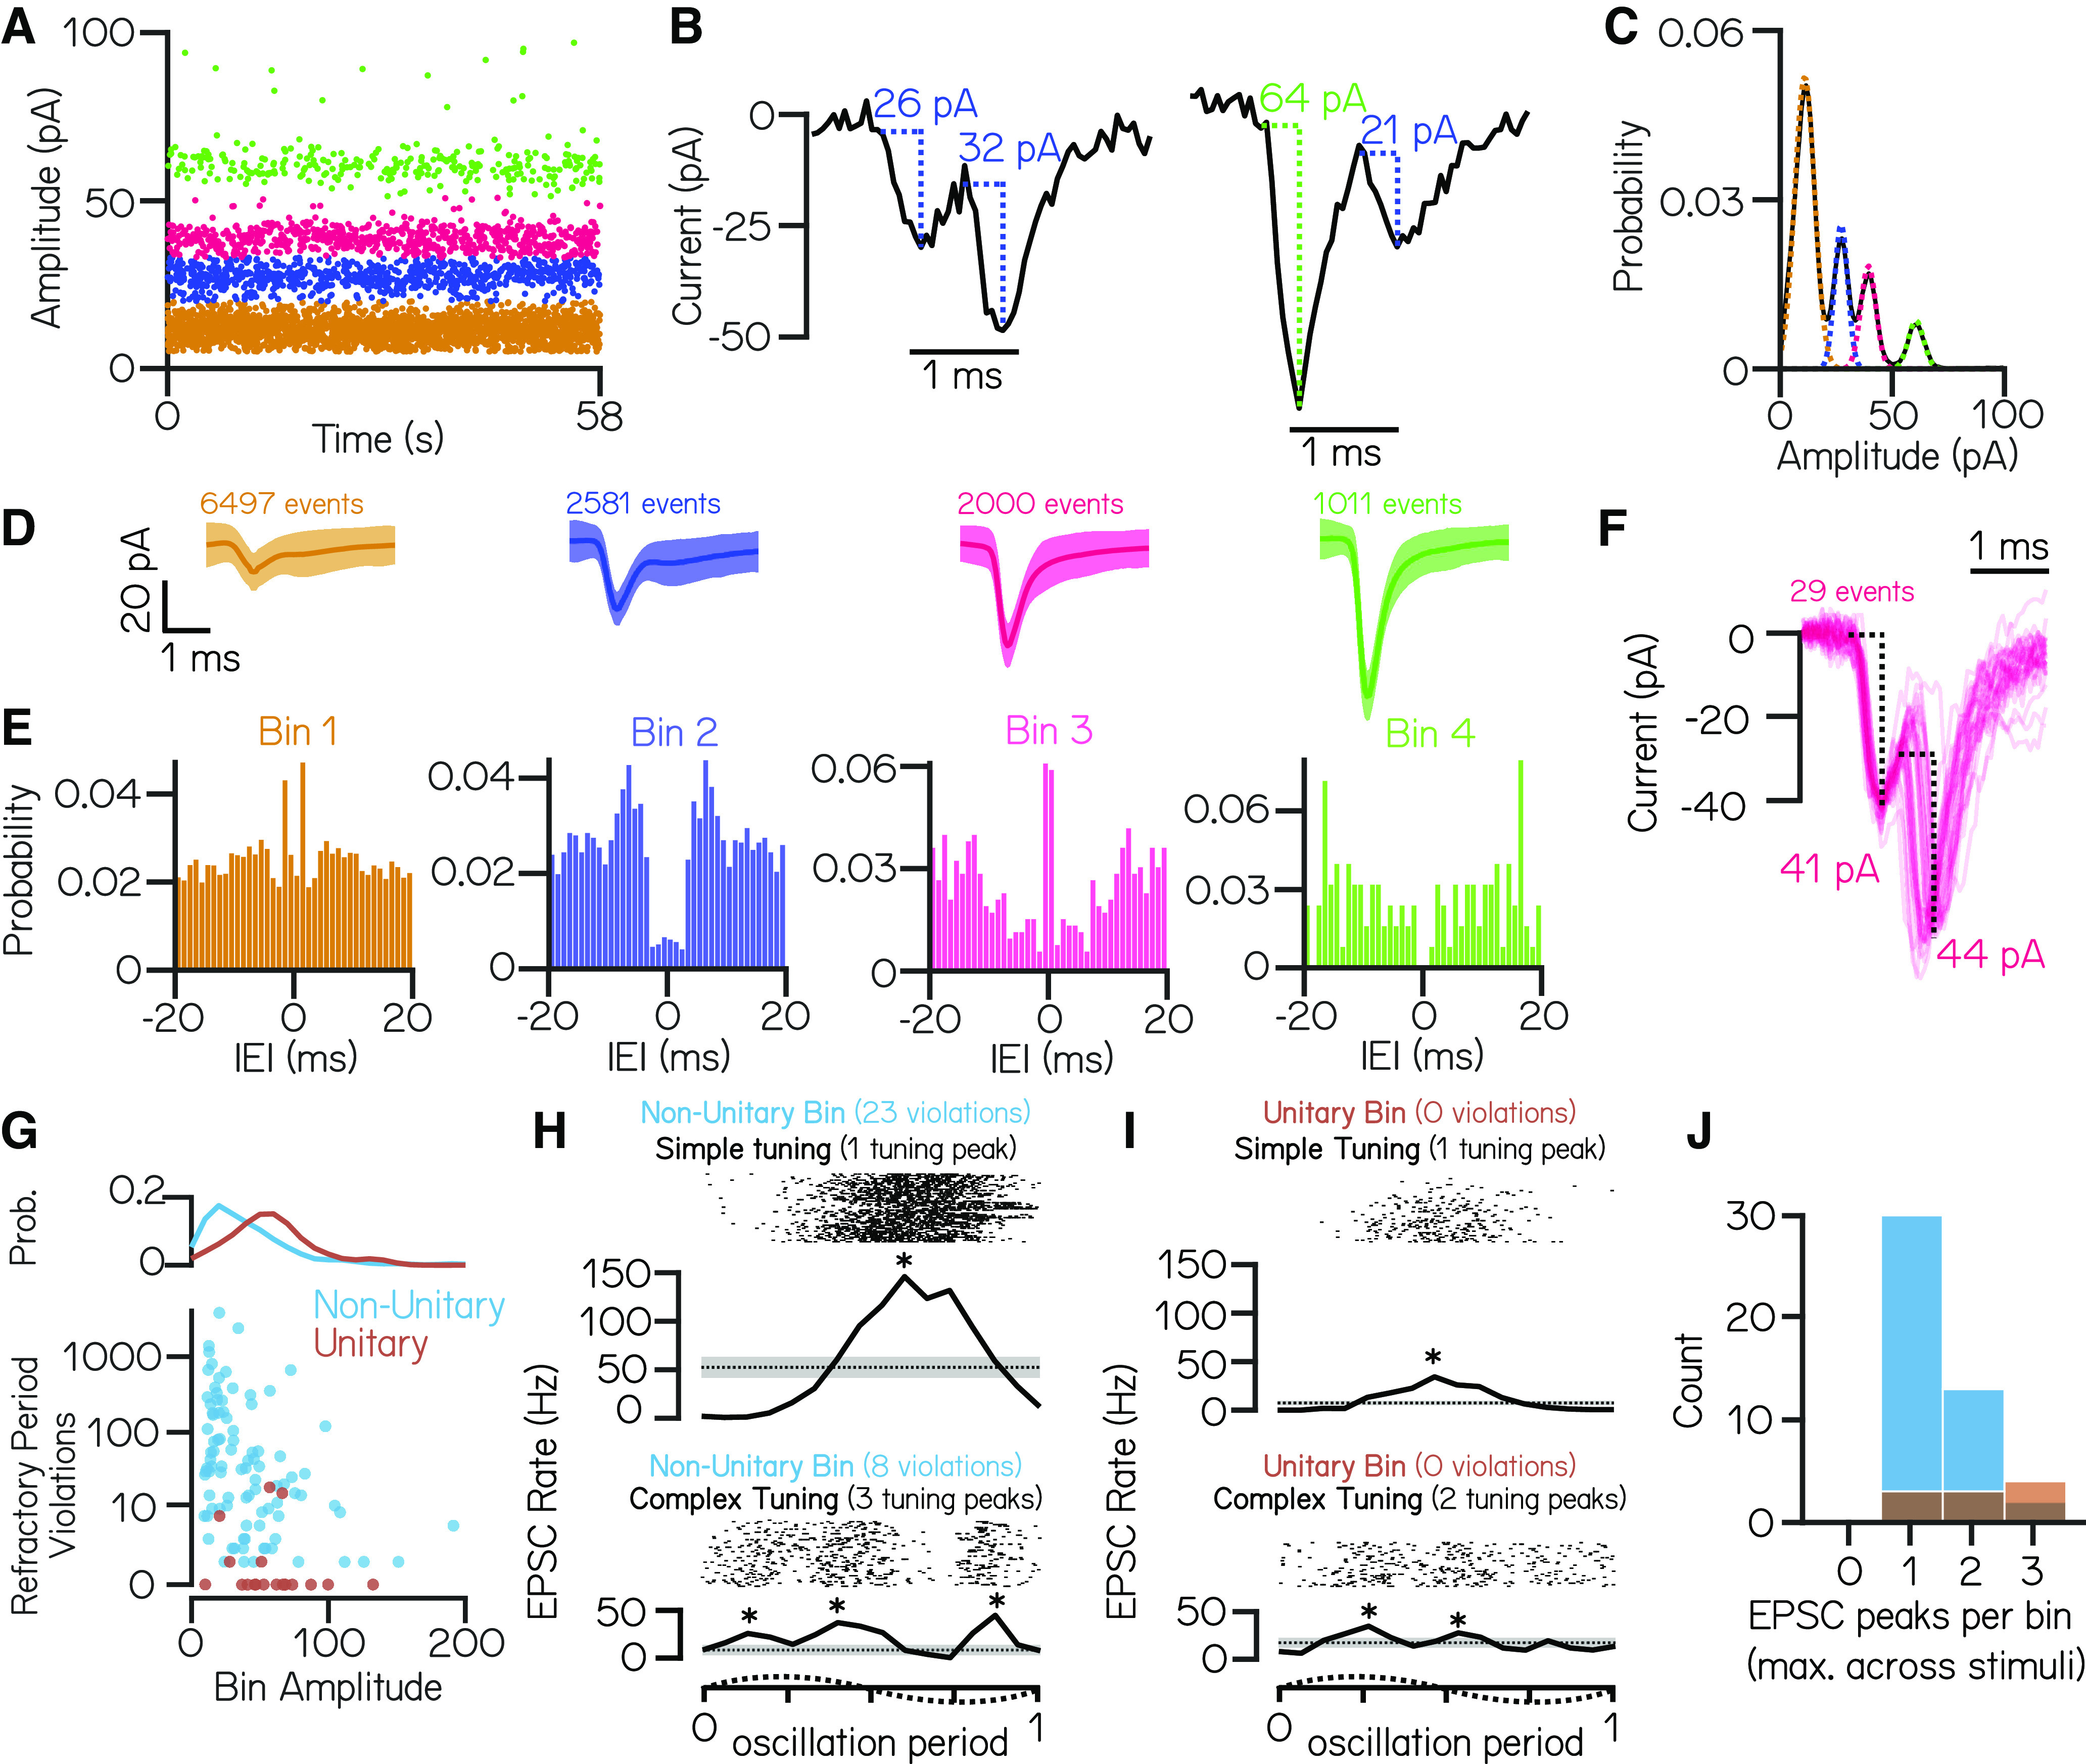
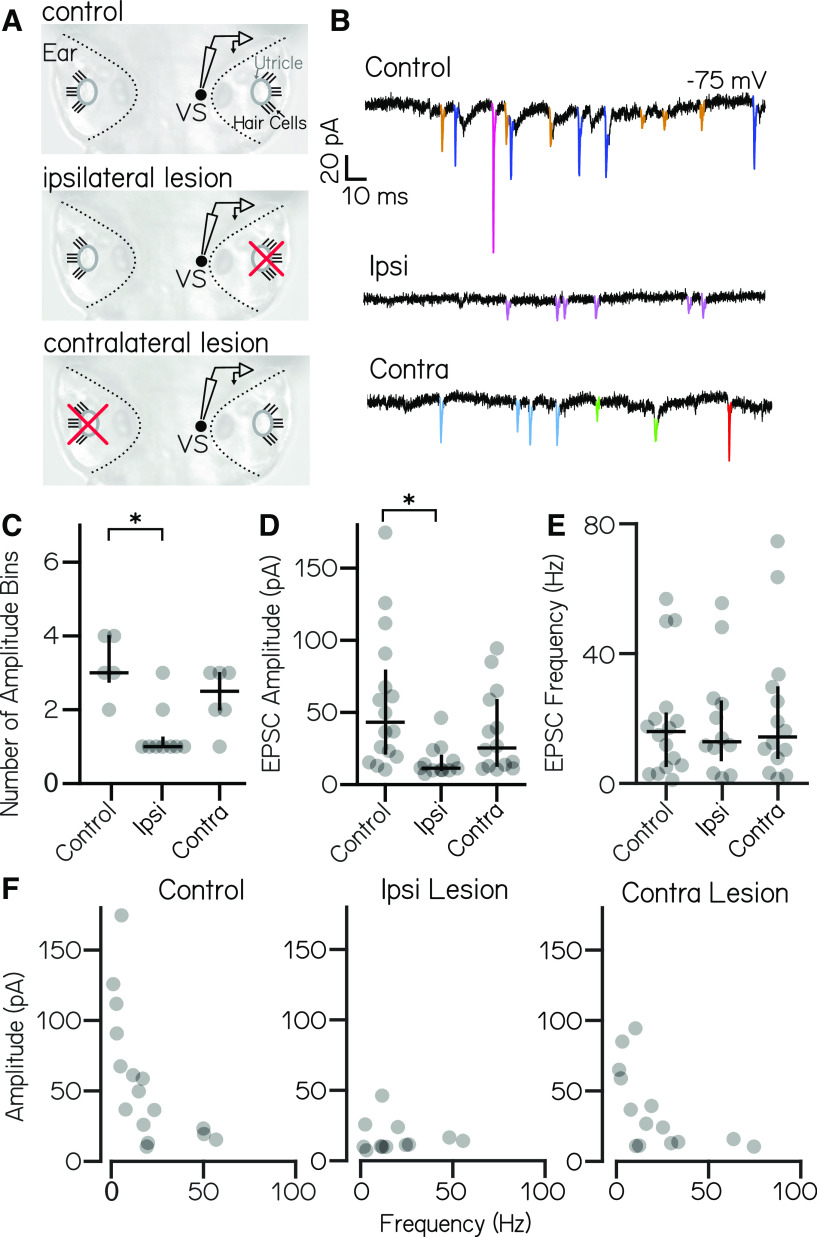
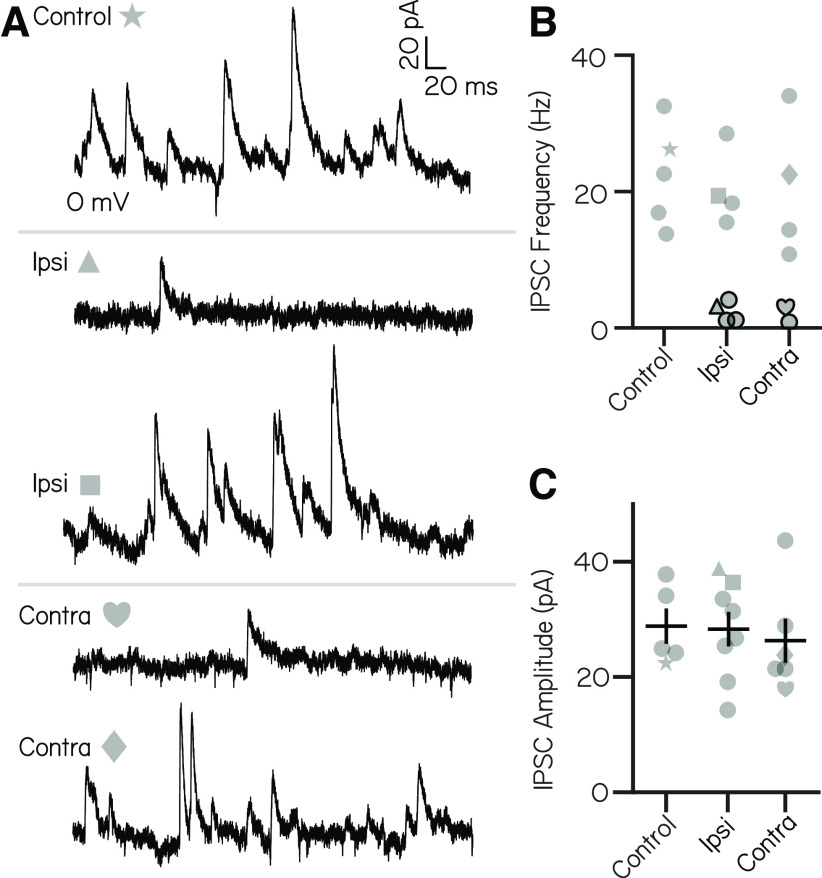
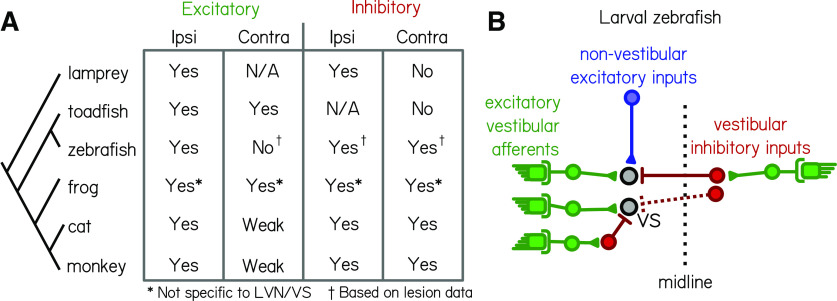
Vestibulospinal neurons integrate sensed imbalance to regulate postural reflexes. As an evolutionarily conserved neural population, understanding their synaptic and circuit-level properties can offer insight into vertebrate antigravity reflexes. Motivated by recent work, we set out to verify and extend the characterization of vestibulospinal neurons in the larval zebrafish. Using current-clamp recordings together with stimulation, we observed that larval zebrafish vestibulospinal neurons are silent at rest, yet capable of sustained spiking following depolarization. Neurons responded systematically to a vestibular stimulus (translation in the dark); responses were abolished after chronic or acute loss of the utricular otolith. Voltage-clamp recordings at rest revealed strong excitatory inputs with a characteristic multimodal distribution of amplitudes, as well as strong inhibitory inputs. Excitatory inputs within a particular mode (amplitude range) routinely violated refractory period criteria and exhibited complex sensory tuning, suggesting a nonunitary origin. Next, using a unilateral loss-of-function approach, we characterized the source of vestibular inputs to vestibulospinal neurons from each ear. We observed systematic loss of high-amplitude excitatory inputs after utricular lesions ipsilateral, but not contralateral, to the recorded vestibulospinal neuron. In contrast, while some neurons had decreased inhibitory inputs after either ipsilateral or contralateral lesions, there were no systematic changes across the population of recorded neurons. We conclude that imbalance sensed by the utricular otolith shapes the responses of larval zebrafish vestibulospinal neurons through both excitatory and inhibitory inputs. Our findings expand our understanding of how a vertebrate model, the larval zebrafish, might use vestibulospinal input to stabilize posture. More broadly, when compared with recordings in other vertebrates, our data speak to conserved origins of vestibulospinal synaptic input.
Keywords: balance; electrophysiology; evolution; vestibulospinal.
Copyright © 2023 Hamling et al.
Conflict of interest statement
The authors declare no competing financial interests.
Figures
Update of
-
The nature and origin of synaptic inputs to vestibulospinal neurons in the larval zebrafish.bioRxiv [Preprint]. 2023 Mar 16:2023.03.15.532859. doi: 10.1101/2023.03.15.532859. bioRxiv. 2023. Update in: eNeuro. 2023 Jun 2;10(6):ENEURO.0090-23.2023. doi: 10.1523/ENEURO.0090-23.2023. PMID: 36993365 Free PMC article. Updated. Preprint.
Similar articles
-
The nature and origin of synaptic inputs to vestibulospinal neurons in the larval zebrafish.bioRxiv [Preprint]. 2023 Mar 16:2023.03.15.532859. doi: 10.1101/2023.03.15.532859. bioRxiv. 2023. Update in: eNeuro. 2023 Jun 2;10(6):ENEURO.0090-23.2023. doi: 10.1523/ENEURO.0090-23.2023. PMID: 36993365 Free PMC article. Updated. Preprint.
-
The Vestibulospinal Nucleus Is a Locus of Balance Development.J Neurosci. 2024 Jul 24;44(30):e2315232024. doi: 10.1523/JNEUROSCI.2315-23.2024. J Neurosci. 2024. PMID: 38777599 Free PMC article.
-
Convergence of the anterior semicircular canal and otolith afferents on cat single vestibular neurons.Exp Brain Res. 2002 Dec;147(3):407-17. doi: 10.1007/s00221-002-1273-8. Epub 2002 Oct 12. Exp Brain Res. 2002. PMID: 12428148
-
Otolith and canal integration on single vestibular neurons in cats.Exp Brain Res. 2005 Jul;164(3):271-85. doi: 10.1007/s00221-005-2341-7. Epub 2005 Jul 1. Exp Brain Res. 2005. PMID: 15991028 Review.
-
Vasopressin in the locus coeruleus and dorsal pontine tegmentum affects posture and vestibulospinal reflexes.Prog Brain Res. 1998;119:537-54. doi: 10.1016/s0079-6123(08)61592-7. Prog Brain Res. 1998. PMID: 10074811 Review.
Cited by
-
Diving into the zebrafish brain: exploring neuroscience frontiers with genetic tools, imaging techniques, and behavioral insights.Front Mol Neurosci. 2024 Mar 12;17:1358844. doi: 10.3389/fnmol.2024.1358844. eCollection 2024. Front Mol Neurosci. 2024. PMID: 38533456 Free PMC article. Review.
-
Larval zebrafish maintain elevation with multisensory control of posture and locomotion.bioRxiv [Preprint]. 2025 Aug 2:2024.01.23.576760. doi: 10.1101/2024.01.23.576760. bioRxiv. 2025. Update in: J Exp Biol. 2025 Aug 07:jeb.250087. doi: 10.1242/jeb.250087. PMID: 38328242 Free PMC article. Updated. Preprint.
-
Defects in Exosome Biogenesis Are Associated with Sensorimotor Defects in Zebrafish vps4a Mutants.J Neurosci. 2024 Dec 11;44(50):e0680242024. doi: 10.1523/JNEUROSCI.0680-24.2024. J Neurosci. 2024. PMID: 39455257 Free PMC article.
-
Medial and lateral vestibulospinal projections to the cervical spinal cord of the squirrel monkey.Front Neurol. 2025 Jan 3;15:1513132. doi: 10.3389/fneur.2024.1513132. eCollection 2024. Front Neurol. 2025. PMID: 39830204 Free PMC article.
-
Cerebellar Purkinje Cells Control Posture in Larval Zebrafish (Danio rerio).bioRxiv [Preprint]. 2024 Nov 9:2023.09.12.557469. doi: 10.1101/2023.09.12.557469. bioRxiv. 2024. Update in: Elife. 2025 Apr 24;13:RP97614. doi: 10.7554/eLife.97614. PMID: 37745506 Free PMC article. Updated. Preprint.
References
Publication types
MeSH terms
Grants and funding
LinkOut - more resources
Full Text Sources
Research Materials