. 2023 Jun 2;14(1):3205.
doi: 10.1038/s41467-023-39016-0.

Spatiotemporal transcriptomic atlas reveals the dynamic characteristics and key regulators of planarian regeneration

Affiliations

Spatiotemporal transcriptomic atlas reveals the dynamic characteristics and key regulators of planarian regeneration

Guanshen Cui et al. Nat Commun. .

Abstract

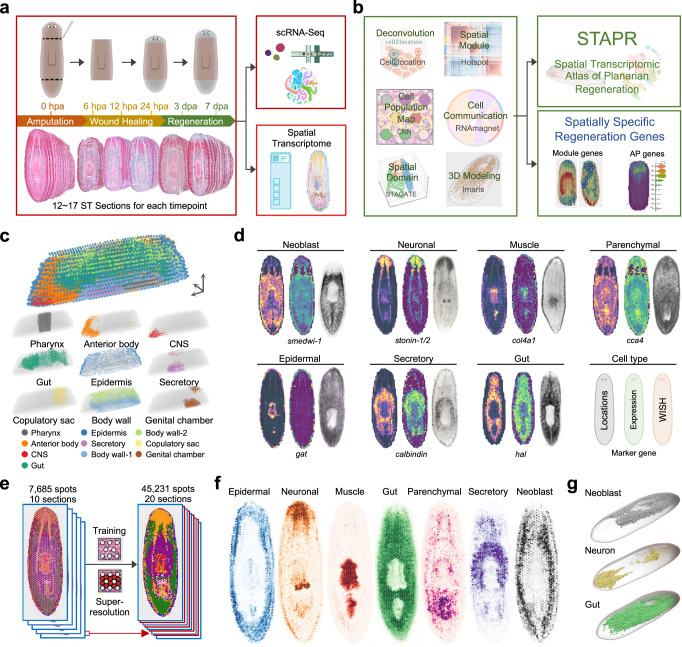
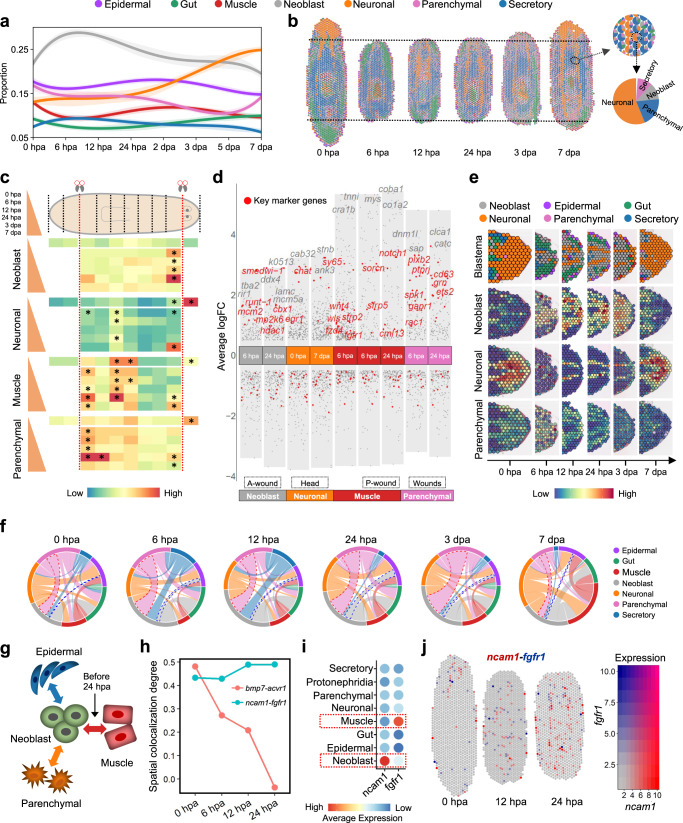
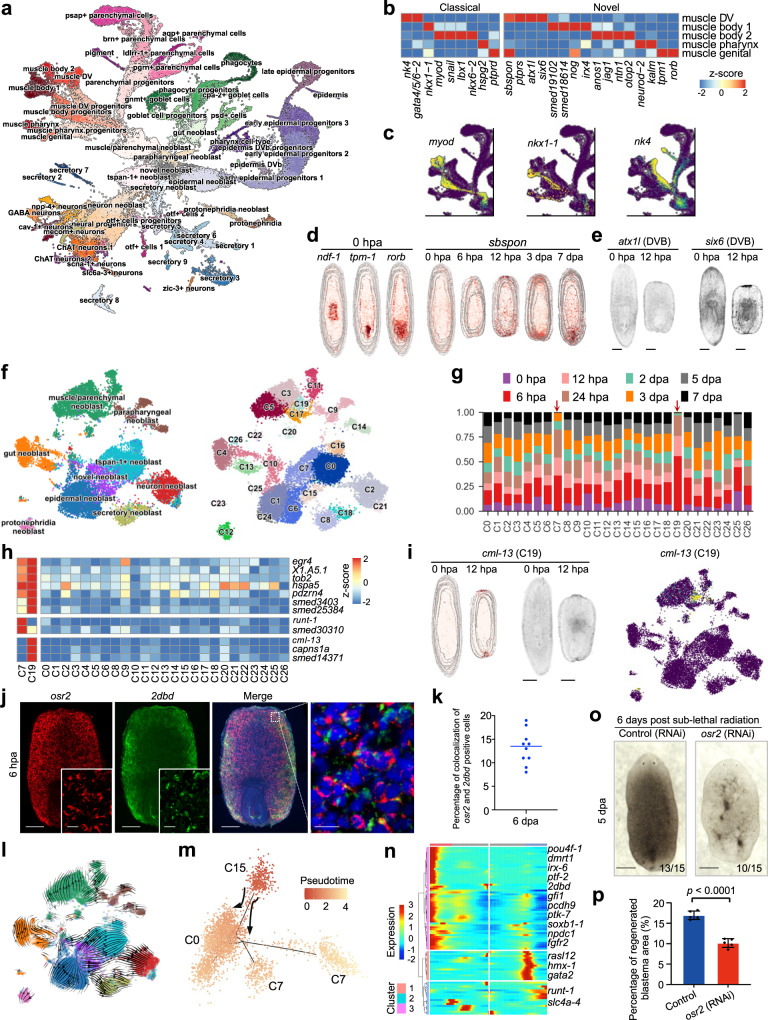
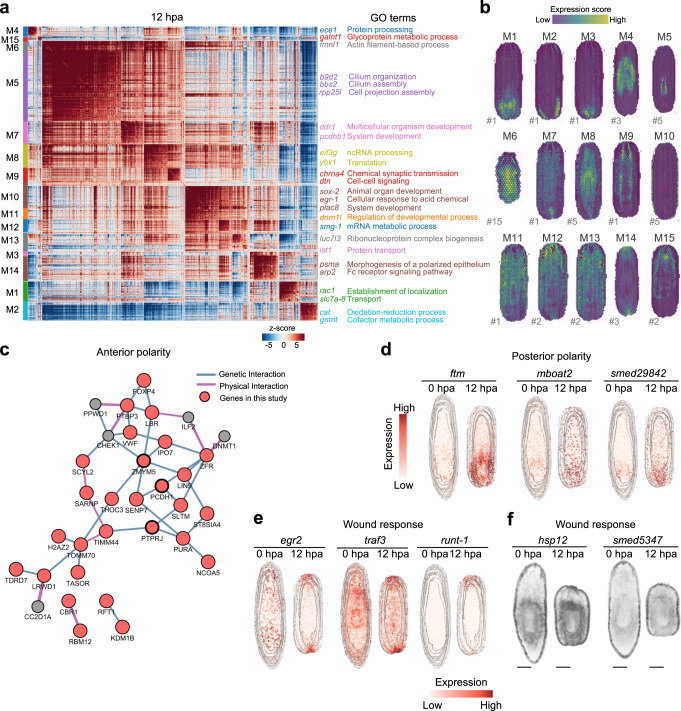
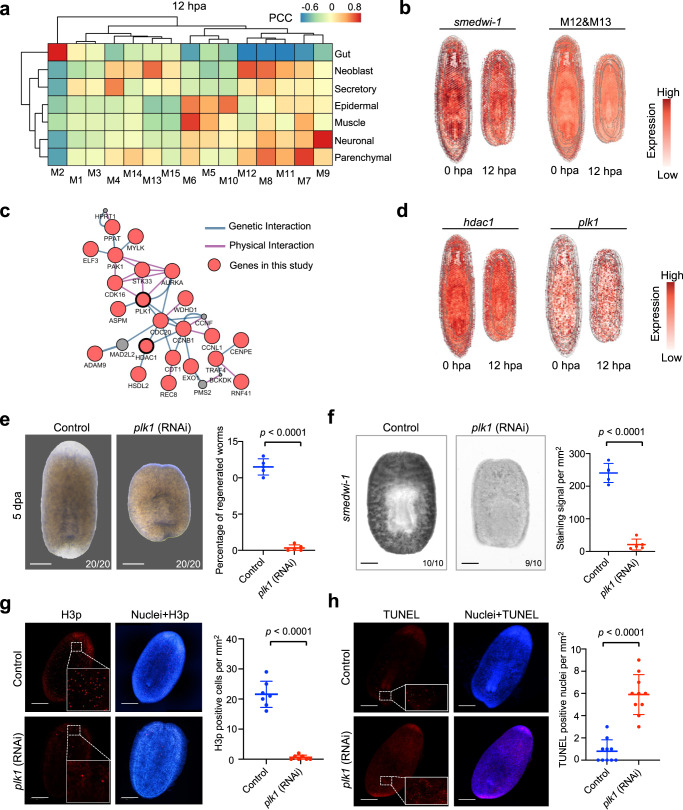
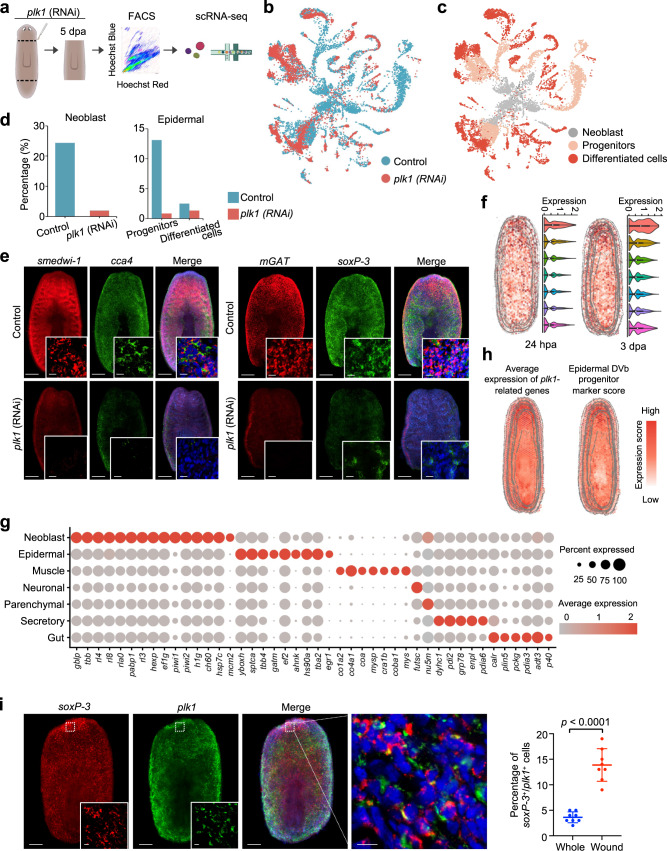
Whole-body regeneration of planarians is a natural wonder but how it occurs remains elusive. It requires coordinated responses from each cell in the remaining tissue with spatial awareness to regenerate new cells and missing body parts. While previous studies identified new genes essential to regeneration, a more efficient screening approach that can identify regeneration-associated genes in the spatial context is needed. Here, we present a comprehensive three-dimensional spatiotemporal transcriptomic landscape of planarian regeneration. We describe a pluripotent neoblast subtype, and show that depletion of its marker gene makes planarians more susceptible to sub-lethal radiation. Furthermore, we identified spatial gene expression modules essential for tissue development. Functional analysis of hub genes in spatial modules, such as plk1, shows their important roles in regeneration. Our three-dimensional transcriptomic atlas provides a powerful tool for deciphering regeneration and identifying homeostasis-related genes, and provides a publicly available online spatiotemporal analysis resource for planarian regeneration research.


Conflict of interest statement

The authors declare no competing interests.

Figures

Fig. 1
Fig. 1. The four-dimension spatiotemporal transcriptomic cell atlas of planarian Schmidtea mediterranea.
a Overview of the study design for multi-omics atlas of planarian regeneration. b Workflow depicting processing and content of analysis. c ST spots clustering using STAGATE according to spatial expression similarity and named by distribution characteristics. d Overlay of hematoxylin and eosin (H&E) staining of tissue sections and ST spots of each major cell type predicted by cell2location, in comparison to whole-mount in situ hybridization (WISH) staining of each cell marker. Scale bar, 500 µm. e High-resolution ST spots imputed by the deep learning procedure-based cell annotation, overlaying with H&E staining, and stacked to form a three-dimensional atlas. f Spatial distribution of major cell types with tiled spots from 20 consecutive sections. g Planarian virtual model illustrating major cell types reconstructed by Imaris. See also Supplementary Figs. 1–4.
Fig. 2
Fig. 2. Spatial dynamics of cell types during regeneration.
a Dynamic change of each cell population over the scRNA-seq of whole-body regeneration time courses. Dynamic change of each cell population over the scRNA-seq of whole-body regeneration time courses. We performed five times of 20% downsampling, and the standard deviation was shown as the error bands. Source data are provided as a Source Data file. b Spatial change of major cell types during the regeneration time courses. ST spot is illustrated as a pie chart of major cell types. c Average prediction scores and spatial enrichment test of major cell types along the anterior-posterior axis of planarian during the regeneration. Hypergeometric test (one-sided), p value <0.05*. Source data are provided as a Source Data file. d Volcano plot showing spatial differential genes that are up- and down-regulated in neoblast, neuronal, muscle, and parenchymal clusters in wound region at the A-wound and P-wound, anterior wound and posterior wound. Key regulatory genes are indicated in red, while other genes are indicated in gray. Source data are provided as a Source Data file. e Tissue sections of the anterior wound area showing the cell type with the maximum prediction score of ST spots, and prediction scores of neoblast, neuronal, and parenchymal of ST spots. f Chord diagram showing predicted signal correlation of pairwise cell types in ST spots in all regeneration time points. g Schematic representation showing the communication between neoblast and other cell types in planarian. h Spatial colocalization degree of ligand-receptor pairs bmp7-acvr1 and ncam1-fgfr1 before 24 hpa. Source data are provided as a Source Data file. i Dotplot of ligand-receptor pair NCAM1-FGFR1 showing the average expression in major cell types. j Co-expression pattern of ligand-receptor pair ncam1-fgfr1 at 0, 12, and 24 hpa respectively. See also Supplementary Fig. 5.
Fig. 3
Fig. 3. A neoblast sub-cluster identified as the most potent stem cell for planarian regeneration.
a UMAP demonstrates sub-cell types. b The classical and identified markers for muscle sub-cell types. c The expression pattern of classical marker genes for muscle sub-cell types. d The expression pattern of ndf-1, tpm-1, and rorb at 0 hpa ST data (left) and sbspon during regeneration (right). e The WISH staining of muscle DV markers, atx1l, and six6, at 0 and 12 hpa. Scale bar, 500 μm. f UMAP demonstrates neoblast subpopulations (left) and neoblast sub-cluster (right). g Cell proportions of neoblast subpopulations during regeneration. Source data are provided as a Source Data file. h The identification of marker genes for C7 and C19. i The expression of C19 marker gene, cml-13, in 0 and 12 hpa ST data (left). The WISH staining of cml-13 at 0 and 12 hpa (middle). Scale bar, 500 μm. The expression of cml-13 in scRNA-seq data (right). j Fluorescent in situ hybridization (FISH) showing expressions of C15 markers, osr2, and 2dbd, in 6 hpa samples. Scale bar, 300 and 20 µm for the enlarged field. k The percentage of colocalization of osr2 and 2dbd positive cells. Data were mean ± S.D. and n = 10 animals. Source data are provided as a Source Data file. l Velocity force field showing the average differentiation trajectories (velocity) for cells located in different parts of the UMAP plot. m Pseudo-time of neoblast cells inferred by Monocle2. n Three clusters of branch-dependent genes identified by BEAM. o Bright-field image showing control and osr2 RNAi planarians at 5 dpa, with 6 days post sublethal radiation. Scale bar, 500 μm. Bottom left number, planarians with the phenotype of total tested. p The percentage of regenerated blastema area to the whole body of the control and osr2 RNAi planarians. Error bars represent standard deviation. Data were mean ± S.D. and n = 5 animals in each group. The p values were determined using a two-sided unpaired Student’s t-test (right). Source data are provided as a Source Data file. See also Supplementary Figs. 6, 7.
Fig. 4
Fig. 4. Spatial module can help to screen for regeneration-related genes.
a Correlation heatmap of functional gene modules identified by Hotspot analysis in 12 hpa sample. Each row and each column represent a module marker gene, and Z-score indicates the correlation between module marker genes. Right panel: GO analysis showing the top function terms of each module. b The expression pattern of each module identified in (a). The “#number” next to the sections represents the number of each section. c The gene-regulated network of anterior polarity gene modules. d The expression levels of posterior polarity genes, ftm, mboat2, and smed29842, in 0 and 12 hpa ST data. e Spatial distribution of wound-induced genes egr2, traf3, and runt-1 at 0 and 12 hpa. f WISH staining of polar genes, hsp12 and smed5347, identified through the polarity gene module. Scale bar, 500 μm. See also Supplementary Fig. 8.
Fig. 5
Fig. 5. Spatial modules identify key regulatory genes that are essential for regeneration.
a Heatmap showing the correlation between modules (Fig. 4a) and cell types (predicted by cell2location). Source data are provided as a Source Data file. b Spatial distribution of smedwi-1 and neoblast-related modules genes expression score. c Gene network of neoblast-related module reveals hub genes. d Spatial expression of key regulatory genes hdac1 and plk1 in 0 and 12 hpa ST data. e Bright-field image showing control and plk1 knockdown planarians at 5 dpa. Scale bar, 500 μm. Bottom right number, planarians with the phenotype of total tested. Error bars represent standard deviation. Data were mean ± S.D. and n = 5 animals in each group. The p values were determined using a two-sided unpaired Student’s t-test (right). Source data are provided as a Source Data file. f WISH staining of smedwi-1 in control and plk1 knockdown planarians at 3 dpa. Scatter plot of smedwi-1 positive cells in each group. Scale bar, 300 µm. Bottom right number, planarians with the staining pattern of total tested. Error bars represent standard deviation. Data were mean ± S.D. and n = 5 animals in each group. The p values were determined using a two-sided unpaired Student’s t-test (right). Source data are provided as a Source Data file. g Immunofluorescence of H3p in control and plk1 knockdown planarians at 5 dpa. Scale bar, 500 μm (left). Statistical analysis for H3p immunostaining. Error bars represent standard deviation. Data were mean ± SD and n = 7 animals in each group. The p values were determined using a two-sided unpaired Student’s t-test (right). Source data are provided as a Source Data file. h Whole-mount TUNEL assay of control and plk1 knockdown planarians at 5 dpa. Scale bar, 500 µm (left). Quantification of TUNEL+ nuclei/mm2 at 5 dpa. Error bars represent standard deviation. Data were mean ± SD and n = 10 animals in each group. The p values were determined using a two-sided unpaired Student’s t-test (right). Source data are provided as a Source Data file. See also Supplementary Fig. 9.
Fig. 6
Fig. 6. plk1 is essential for planarian regeneration.
a Overview of study design for plk1 (RNAi) single-cell atlas of the planarian. b UMAP visualization of control and plk1 knockdown scRNA-seq samples at 5 dpa. c The location of neoblasts, progenitor, and differentiated cell clusters was shown on the UAMP plot. d Percentage of cells allocated to different cell types in control and plk1 knockdown planarians at 5 dpa. Source data are provided as a Source Data file. e FISH showing the expressions of smedwi-1, cca4, mGAT, and soxP-3 in the control and plk1 knockdown planarian at 5 dpa. Scale bar, 300 μm and 20 µm in the enlarged field. f The expression pattern of plk1 at 24 hpa and 3 dpa during regeneration. n (24 hpa from top to bottom) = 463, 1426, 1885, 1999, 1940, 1719, 481; n (3 dpa from top to bottom) = 373, 1084, 1418, 1867, 2069, 1671, 740. The middle lines of the boxes represent the medians of datasets (50th percentile). The upper and bottom lines of the boxes are, respectively, the upper quantile (25th percentile) and the lower quantile (75th percentile) of the data. The whiskers mark the upper and lower limits of these datasets. g Dotplot showing the expression of differentially expressed genes and the expression of genes with expression patterns similar to plk1, in different cell types. h The gene expression score and cell type distribution at 3 dpa. The genes with a expression pattern similar to plk1 was detected by Hotspot, and the cell type distribution were predicted by markers. i FISH showing co-expressions of soxP-3 and plk1 at 5 dpa. Scale bar, 200 μm and 20 µm in the enlarged field. Quantification of the percentage of soxP-3+ / plk1+ cells mm of whole tissue fragment and near-wound area. Error bars represent standard deviation. Data were the mean ± SD. and n = 8 animals in each group. The p values were determined using a two-sided unpaired Student’s t-test (right). Source data are provided as a Source Data file. See also Supplementary Fig. 10.

References

    1. Ivankovic M, et al. Model systems for regeneration: planarians. Development. 2019;146:dev167684. doi: 10.1242/dev.167684. - DOI - PubMed
    1. Reddien PW. The cellular and molecular basis for planarian regeneration. Cell. 2018;175:327–345. doi: 10.1016/j.cell.2018.09.021. - DOI - PMC - PubMed
    1. Scimone ML, et al. Muscle and neuronal guidepost-like cells facilitate planarian visual system regeneration. Science. 2020;368:eaba3203. doi: 10.1126/science.aba3203. - DOI - PMC - PubMed
    1. Bonar NA, Gittin DI, Petersen CP. Src acts with WNT/FGFRL signaling to pattern the planarian anteroposterior axis. Development. 2022;149:dev200125. doi: 10.1242/dev.200125. - DOI - PMC - PubMed
    1. Petersen CP, Reddien PW. A wound-induced Wnt expression program controls planarian regeneration polarity. Proc. Natl Acad. Sci. USA. 2009;106:17061–17066. doi: 10.1073/pnas.0906823106. - DOI - PMC - PubMed

Publication types