. 2023 Jun 2;13(1):8954.
doi: 10.1038/s41598-023-35539-0.

Refining the evolutionary tree of the horse Y chromosome

Affiliations

Refining the evolutionary tree of the horse Y chromosome

Elif Bozlak et al. Sci Rep. .

Abstract

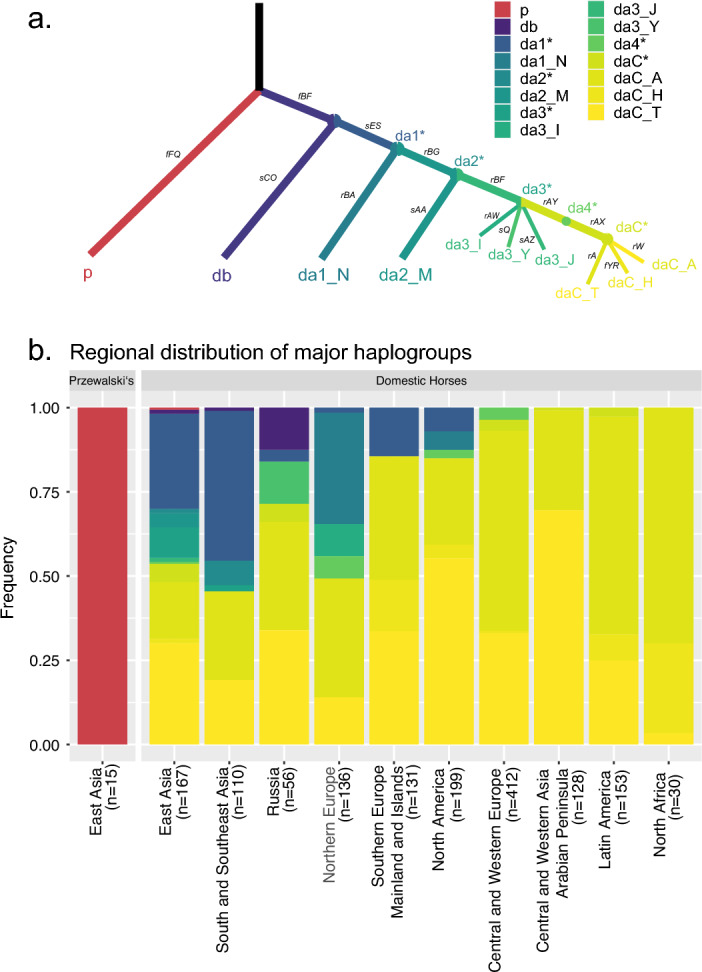
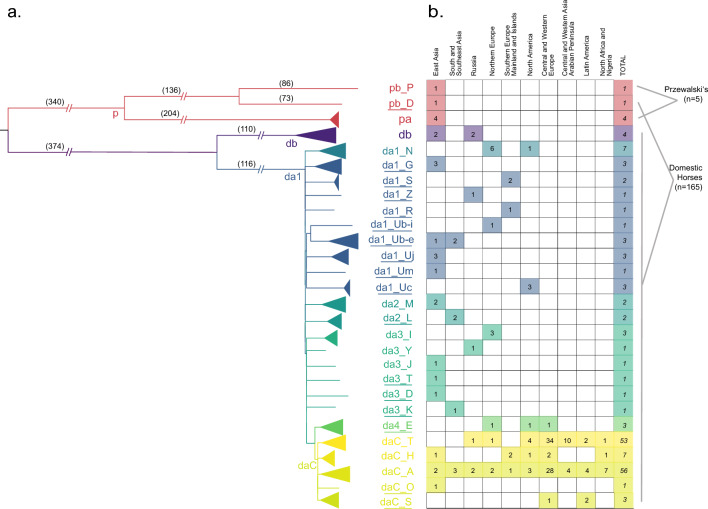
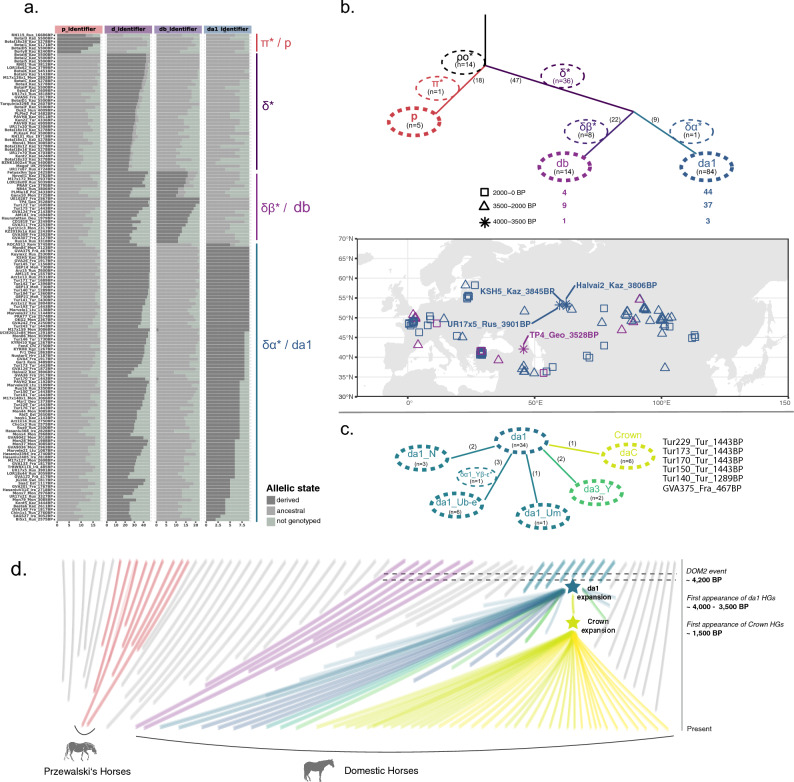
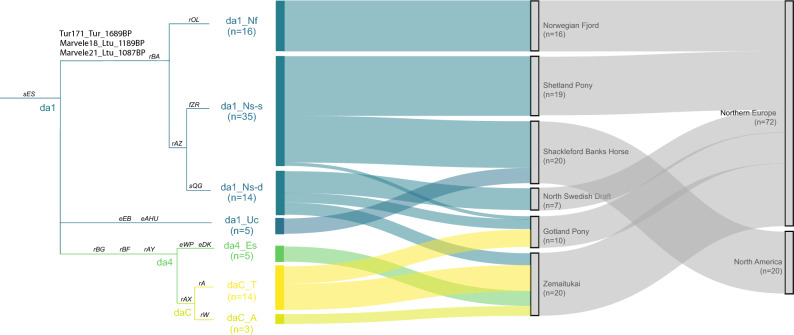
The Y chromosome carries information about the demography of paternal lineages, and thus, can prove invaluable for retracing both the evolutionary trajectory of wild animals and the breeding history of domesticates. In horses, the Y chromosome shows a limited, but highly informative, sequence diversity, supporting the increasing breeding influence of Oriental lineages during the last 1500 years. Here, we augment the primary horse Y-phylogeny, which is currently mainly based on modern horse breeds of economic interest, with haplotypes (HT) segregating in remote horse populations around the world. We analyze target enriched sequencing data of 5 Mb of the Y chromosome from 76 domestic males, together with 89 whole genome sequenced domestic males and five Przewalski's horses from previous studies. The resulting phylogeny comprises 153 HTs defined by 2966 variants and offers unprecedented resolution into the history of horse paternal lineages. It reveals the presence of a remarkable number of previously unknown haplogroups in Mongolian horses and insular populations. Phylogenetic placement of HTs retrieved from 163 archaeological specimens further indicates that most of the present-day Y-chromosomal variation evolved after the domestication process that started around 4200 years ago in the Western Eurasian steppes. Our comprehensive phylogeny significantly reduces ascertainment bias and constitutes a robust evolutionary framework for analyzing horse population dynamics and diversity.


Conflict of interest statement

The authors declare no competing interests.

Figures

Figure 1
Figure 1
Distribution of MSY haplogroups across horse populations. (a) The tree shows the topology of ten mjHGs resulting from the 16 MSY markers (Supplementary Table S1) selected for genotyping. The markers are given on branches. The five observed inner node clustering positions are denoted by a ‘*’ in their nomenclature. (b) MSY HG frequencies from genotyping 15 Przewalski’s horses and 1522 domestic horses representing 135 breeds. Domestic horses were grouped into 10 geographic regions and the number of samples from each region is given in parenthesis. The color code is according to (a) and the full dataset is given in Supplementary Table S2.
Figure 2
Figure 2
Horse Y phylogeny from stringently filtered SNPs. (a) The maximum parsimony tree is based on 2678 SNPs gathered from NGS data analysis of 165 domestic horse and 5 Przewalski’s horse samples. Number of mutations are given on the branches of the tree. Haplogroups newly identified in this study are marked with an underline. Because of the extensive number of samples in Crown haplogroup, it is collapsed into its five major branches. (b) Shows the number of samples in each cluster and their region of origin.
Figure 3
Figure 3
Horse MSY HT topology ‘horseYtree.vs1’. Fine-scaled HT tree from 165 domestic and five Przewalski’s horses tree based on 2966 MSY variants. Variants (‘identifiers’) are given on branches in red. The samples (IDs) are at the tips, and samples carrying HTs first detected in this study are circled with solid lines. mjHGs and breeds are denoted in the outer circle. Breeds are identified by geographic region as indicated in the box. (a) HTs outside the Crown. For long branches the number of identifiers is given in parenthesis (full information in Supplementary Table S4). (b) Crown HTs. In the Crown, the 39 subhaplogroups (sHGs) are separated with black dots and denoted in grey letters. The black lines in the outer circle mark the previously defined Thoroughbred (dac_Tb-d, dac_Tb-oB3b, dac_T3a, dac_Tb-oB1) and Arabian signatures (dac_Ao-aA, daC_Ao-aA1D),. Details on samples, variants and HGs are given in Supplementary Tables S3, S4. The figure is fully readable only in the digital version.
Figure 4
Figure 4
Clustering of ancient samples and emergence of haplogroups. (a) Results from grouping of 149 samples (Y-axis) into four clusters based on number of derived/ancestral states of identifier variants (X-axis). (b) Illustrated summary of the clustering of all ancient samples (according to panel a). The number of identifier SNPs is given on the branches, and the number of samples in each cluster is given in the dashed circles. Groupings that were only detected in ancient samples are given in Greek letters. The spatiotemporal distribution of the 98 samples clustered in db and da1 is shown in the lower panel. The oldest samples in da1 and db, which are dated to the 4000–3500 BP period, are outlined. (c) Clustering of 53 sufficiently sequenced da1 samples into one of the mjHGs. The six samples that clustered to the basal node of the Crown (daC) are given on the right. Full information is given in Supplementary Table S5. (d) Hypothesized emergence and spread of Y haplotypes in domestic and Przewalksi’s horses on the basis of currently available data. Coloured lines represent detected, grey lines uncovered haplotypes.
Figure 5
Figure 5
MSY lineage tracing in breeds carrying mjHG da1_N. On the left the illustrated tree based on 16 identifiers discriminating the HGs detected in six breeds carrying mjHG da1_N is given, with identifier variants on branches. The three ancient samples that clustered into the da1_N are denoted on its basal branch. On the right, the frequencies of each haplogroup in the studied breeds and their geographical region are shown in a Sankey diagram.

References

    1. Jobling MA, Tyler-Smith C. Fathers and sons: The Y chromosome and human evolution. Trends Genet. 1995;11:449–456. doi: 10.1016/S0168-9525(00)89144-1. - DOI - PubMed
    1. Underhill PA, Kivisild T. Use of Y chromosome and mitochondrial DNA population structure in tracing human migrations. Annu. Rev. Genet. 2007;41:539–564. doi: 10.1146/annurev.genet.41.110306.130407. - DOI - PubMed
    1. Jobling MA, Tyler-Smith C. Human Y-chromosome variation in the genome-sequencing era. Nat. Publ. Gr. 2017;18:485–497. doi: 10.1038/nrg.2017.36. - DOI - PubMed
    1. Barbieri C, Hübner A, Macholdt E, Ni S, Lippold S, Schröder R, Mpoloka SW, Purps J, Roewer L, Stoneking M, et al. Refining the Y chromosome phylogeny with southern African sequences. Hum. Genet. 2016;135:541–553. doi: 10.1007/s00439-016-1651-0. - DOI - PMC - PubMed
    1. Calafell F, Larmuseau MH. The Y chromosome as the most popular marker in genetic genealogy benefits interdisciplinary research. Hum. Genet. 2017;136:559–573. doi: 10.1007/s00439-016-1740-0. - DOI - PubMed

Publication types

Substances