. 2023 Jun 2;6(1):596.
doi: 10.1038/s42003-023-04987-9.

NFYA promotes malignant behavior of triple-negative breast cancer in mice through the regulation of lipid metabolism

Affiliations

NFYA promotes malignant behavior of triple-negative breast cancer in mice through the regulation of lipid metabolism

Nobuhiro Okada et al. Commun Biol. .

Abstract

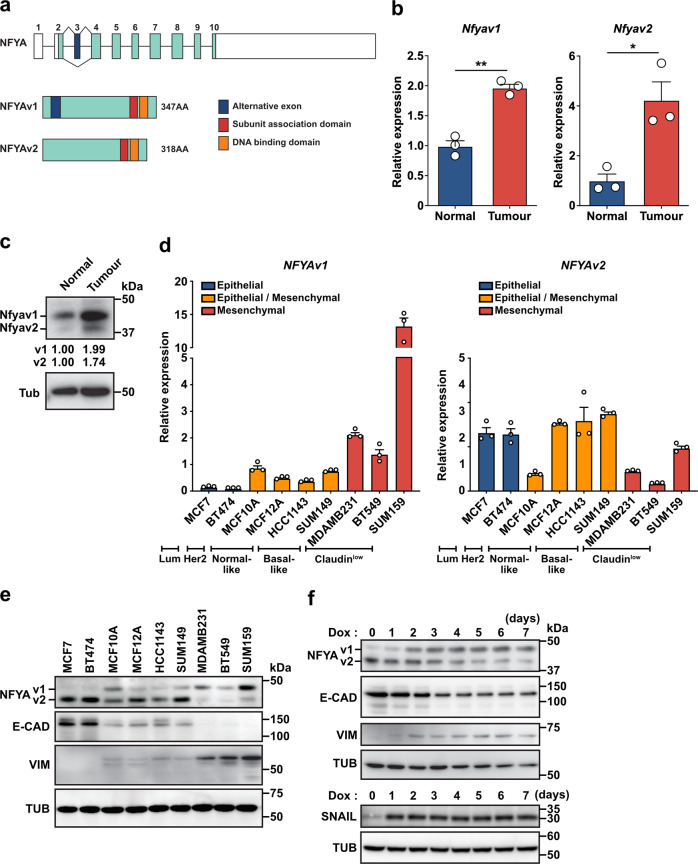
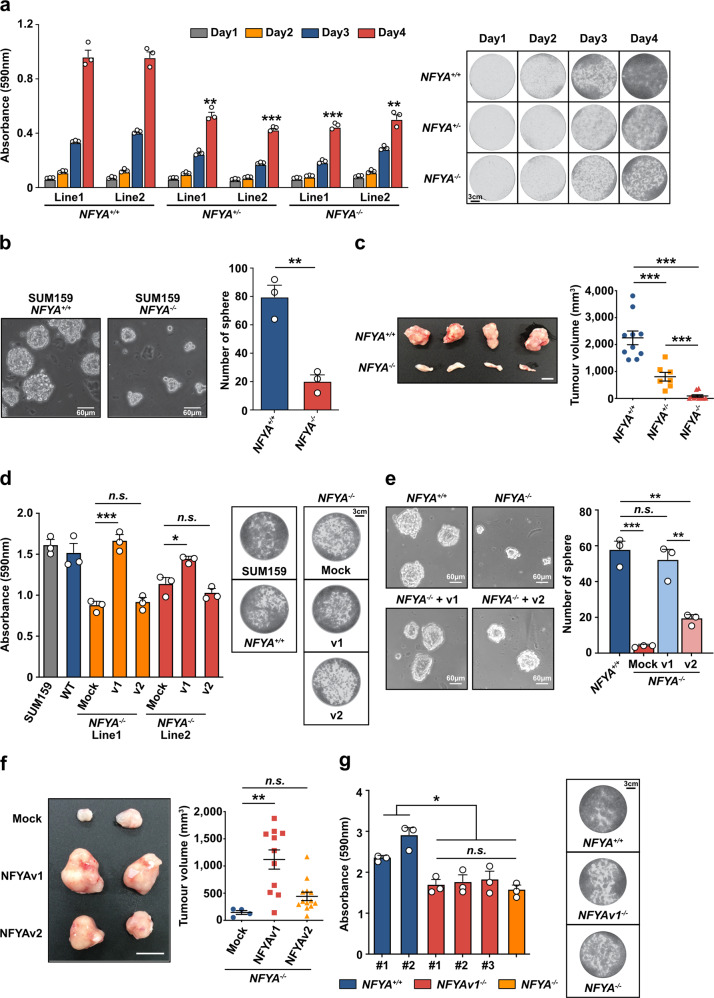
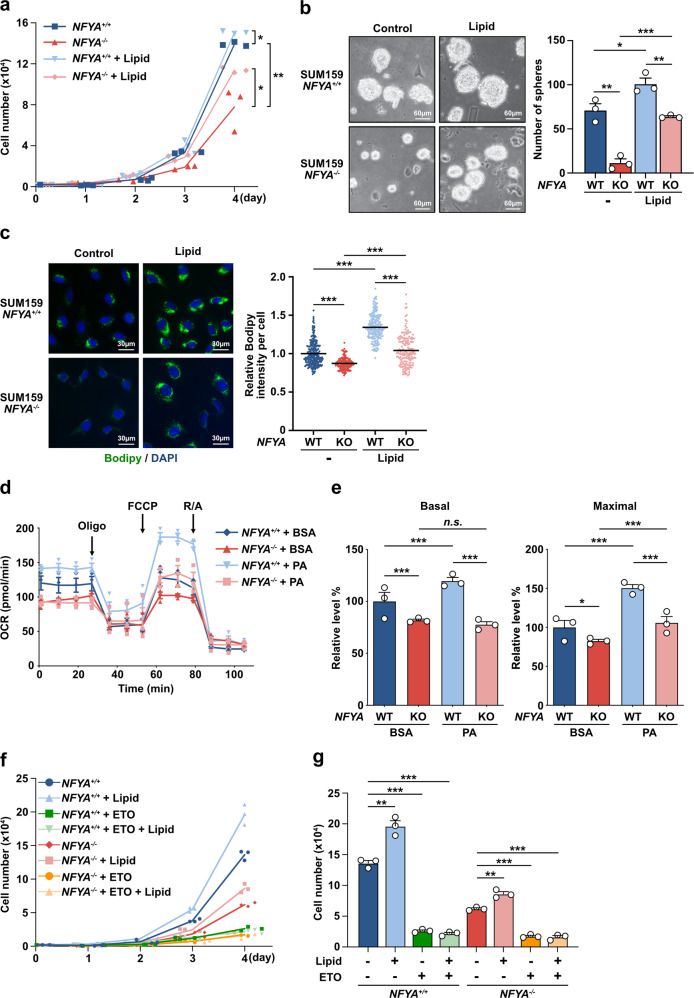
Two splicing variants exist in NFYA that exhibit high expression in many human tumour types. The balance in their expression correlates with prognosis in breast cancer, but functional differences remain unclear. Here, we demonstrate that NFYAv1, a long-form variant, upregulates the transcription of essential lipogenic enzymes ACACA and FASN to enhance the malignant behavior of triple-negative breast cancer (TNBC). Loss of the NFYAv1-lipogenesis axis strongly suppresses malignant behavior in vitro and in vivo, indicating that the NFYAv1-lipogenesis axis is essential for TNBC malignant behavior and that the axis might be a potential therapeutic target for TNBC. Furthermore, mice deficient in lipogenic enzymes, such as Acly, Acaca, and Fasn, exhibit embryonic lethality; however, Nfyav1-deficient mice exhibited no apparent developmental abnormalities. Our results indicate that the NFYAv1-lipogenesis axis has tumour-promoting effects and that NFYAv1 may be a safe therapeutic target for TNBC.


Conflict of interest statement

The authors declare no competing interests.

Figures

Fig. 1
Fig. 1. NFYA switches the expression of alternative splicing variants during EMT progression.
a Schematic diagram of the intron-exon structure of the NFYA gene. Alternative splicing of the third exon generates two different variants, long-form (v1) and short-form (v2). b, c qRT-PCR (b) and western blot analysis (c) of Nfyav1 and Nfyav2 in breast cancer cells (primary cells isolated from mouse breast cancer tissue) compared with non-transformed mouse mammary epithelial cells (NMuMG cells). N = 3 biologically independent experiments for qRT-PCR. d qRT-PCR analysis of NFYAv1 (left panel) and NFYAv2 (right panel) mRNA levels in various breast cancer cell lines. N = 3 biologically independent experiments. e Western blot analysis of NFYA, epithelial marker (E-CAD), and mesenchymal marker (VIM) protein levels in various breast cancer cell lines. f MDA-MB-468 cells were infected with lentivirus to express tet-on SNAIL and induced SNAIL expression by 1 µg/ml of doxycycline (Dox). Western blot analysis of NFYA protein level in the cells from day 0 to day 7 post-induction. E-CAD and VIM are markers for epithelial and mesenchymal cells, respectively. All error bars represent SEM; *P < 0.05; **P < 0.01.
Fig. 2
Fig. 2. NFYAv1 deficiency inhibits tumour cell growth and tumorigenesis in TNBC.
a Quantification and representative pictures of 0.5 % crystal violet staining of NFYA+/+, NFYA+/−, and NFYA−/− SUM159 cells between days 1 and 4. N = 3 biologically independent experiments. Scale bar indicates 3 cm. b Representative images of sphere formation by NFYA+/+ and NFYA−/− SUM159 cells. A bar graph shows the number of spheres larger than 60 µm in each group. N = 3 biologically independent experiments. Scale bars indicate 60 µm. c Representative image of tumours formed in mammary fat pads of NOD/SCID mice 50 days after implanted with NFYA+/+ and NFYA−/− SUM159 cells. Dot plots show the volume of tumours from each experimental group. N = 10 for NFYA+/+ and NFYA−/−, N = 7 for NFYA+/− biologically independent experiments. Scale bar indicates 10 mm. d Representative images of 0.5 % crystal violet staining of NFYA−/− SUM159 cells overexpressed each variant of NFYA on day 4. A bar graph shows the quantification of the staining. N = 3 biologically independent experiments. Scale bar indicates 3 cm. e Representative images of sphere formation by NFYA−/− SUM159 cells overexpressed each variant of NFYA. A bar graph shows the number of spheres larger than 60 µm in each group. N = 3 biologically independent experiments. Scale bars indicate 60 µm. f Representative image of tumours formed in mammary fat pads of NOD/SCID mice 50 days after implanted with NFYA−/− SUM159 cells overexpressed each variant of NFYA. Dot plots show the volume of tumours from each experimental group. N = 4 for Mock, N = 11 for NFYAv1, N = 13 for NFYAv2 biologically independent experiments. Scale bar indicates 10 mm. g Representative images of 0.5 % crystal violet staining of two lines of NFYA+/+, three NFYAv1−/−, and NFYA−/− SUM159 cells on day 4. A bar graph shows the quantification of the staining. N = 3 biologically independent experiments. Scale bar indicates 3 cm. All error bars represent SEM; n.s. not significant; *P < 0.05; **P < 0.01; ***P < 0.001.
Fig. 3
Fig. 3. NFYA regulates lipid metabolism for malignant behavior of TNBC.
a Cumulative population of cells was measured for 4 consecutive days in NFYA+/+ and NFYA−/− SUM159 cells with or without the addition of lipid mixture. N = 3 biologically independent experiments. b Representative images of sphere formation by NFYA+/+ and NFYA−/− SUM159 cells with or without adding a lipid mixture. A bar graph shows the number of spheres larger than 60 µm in each group. N = 3 biologically independent experiments. Scale bars indicate 60 µm. c Representative fluorescence images of lipid droplet (green) detected with Bodipy 493/503 and nucleus (blue) detected with DAPI in NFYA+/+ and NFYA−/− SUM159 cells with or without the addition of lipid mixture for 2 days. The dot plot shows the bodipy intensity per cell. N = 247 for NFYA+/+, N = 157 for NFYA−/−, N = 192 for NFYA+/+ with lipid, N = 166 for NFYA−/− with lipid, from three biologically independent experiments. Scale bars indicate 30 µm. Means represent SEM. d Oxygen consumption rate (OCR) (mean ± SEM) in NFYA+/+ and NFYA−/− SUM159 cells treated with the long-chain fatty acid palmitate (PA) or BSA. N = 3 biologically independent experiments. Oligo; oligomycin, FCCP; carbonyl cyanide-4-trifluoro methoxy phenyl hydrazone, R/A; Rotenone/antimycin A. e Experiments shown in Fig. 3d were quantified, and the relative levels of OCR associated with basal FAO and maximal FAO were calculated. f Cumulative population of cells was measured for 4 consecutive days in NFYA+/+ and NFYA−/− SUM159 cells treated with or without lipid mixture, Etomoxir (ETO), and both. N = 3 biologically independent experiments. g A bar graph shows the cell number on day 4 shown in Fig. 3f. All error bars represent SEM; n.s. not significant; *P < 0.05; **P < 0.01; ***P < 0.001.
Fig. 4
Fig. 4. NFYA enhances lipogenesis by transcriptional activation of ACACA and FASN.
a A diagram illustrating the reaction of lipogenesis and FAO. bd qRT-PCR (b, c) and western blot analysis (d) of the expression levels of differentially expressed genes (b; Lipogenesis-related genes, c; FAO-related genes) in NFYA+/+ and NFYA−/− SUM159 cells treated with or without lipid mixture. N = 3 biologically independent experiments for qRT-PCR. e CUT&RUN assay to evaluate the association of NFYA with the promoter of ACACA and FASN in NFYA+/+ and NFYA−/− SUM159 cells treated with or without lipid mixture. Input or eluted chromatin was subjected to qRT-PCR analysis using promoter-specific primers. Data represents the % input of the immunoprecipitated chromatin for each gene. N = 3 biologically independent experiments. f Western blot analysis of FASN, ACACA, and CPT1A expression in NFYAv1 or NFYAv2 overexpressed NFYA-deficient SUM159 cells. All error bars represent SEM; n.s. not significant; *P < 0.05; **P < 0.01; ***P < 0.001.
Fig. 5
Fig. 5. Nfyav1 enhances tumorigenesis via the regulation of ACACA and Fasn expression in vivo.
a Diagram of endogenous Nfya gene structure and Nfyav1 knockout structure. Using the CRISPR/Cas9 system with two gRNAs targeted intron 2 and 3, we deleted the exon 3 from genome DNA. b, c Confirming loss of Nfyav1 expression in mouse mammary epithelial cells. Littermate-controlled 8-weeksNfyav1+/+, Nfyav1+/−, and Nfyav1−/− mice were analyzed by qRT-PCR (b) and western blot analysis (c) to qualify the expression of Nfyav1. N = 3 biologically independent experiments. All error bars represent SEM; *P < 0.05; ***P < 0.001. d Genotypes of offspring from Nfyav1−/− mouse intercrosses. e Body wight of mice at 8-week-old for Nfyav1+/+, Nfyav1+/, and Nfyav1−/−. N = 5 for Nfyav1+/+ mice, N = 7 for Nfyav1+/− and Nfyav1−/− mice biologically independent animals. f Kaplan–Meier survival curve for Nfyav1+/+, Nfyav1+/−, and Nfyav1−/−. N = 6 for Nfyav1+/+ and Nfyav1+/− mice, N = 10 for Nfyav1−/− mice biologically independent animals. g Kaplan–Meier analysis of tumour-free mice for MMTV-PyMT; Nfyav1+/+ (blue) and MMTV-PyMT; Nfyav1−/− (red). N = 17 biologically independent animals. **P < 0.01. h Representative images of whole-mount carmine alum staining of MMTV-PyMT; Nfyav1+/+ or MMTV-PyMT; Nfyav1−/− mammary gland at 15-week-old. LN, lymph node. A bar graph shows the percentage of tumour area versus the total mammary fat pad in MMTV-PyMT; Nfyav1+/+ or MMTV-PyMT; Nfyav1−/− mice. N = 7 for MMTV-PyMT; Nfyav1+/+ mice, N = 5 for MMTV-PyMT; Nfyav1−/− mice biologically independent animals. Scale bars indicate 5 mm and 1.5 mm. *P < 0.05. i Breast cancer sections from both genotypes were stained with Fasn (panels i–iv) and Acaca (panels v–viii). Scale bars: 10× images, panels i, ii, v, vi, 150 µm; 40× images, panels iii, iv, vii, viii, 50 µm. j Protein expression analysis in PyMT-induced tumours from Nfyav1+/+ or Nfyav1−/− mice.

References

    1. Bianchini G, et al. Triple-negative breast cancer: challenges and opportunities of a heterogeneous disease. Nat. Rev. Clin. Oncol. 2016;13:674–690. doi: 10.1038/nrclinonc.2016.66. - DOI - PMC - PubMed
    1. Burstein MD, et al. Comprehensive genomic analysis identifies novel subtypes and targets of triple-negative breast cancer. Clin. Cancer Res. 2015;21:1688–1698. doi: 10.1158/1078-0432.CCR-14-0432. - DOI - PMC - PubMed
    1. Masuda H, et al. Differential response to neoadjuvant chemotherapy among 7 triple-negative breast cancer molecular subtypes. Clin. Cancer Res. 2013;19:5533–5540. doi: 10.1158/1078-0432.CCR-13-0799. - DOI - PMC - PubMed
    1. Hill BS, et al. Therapeutic potential of a novel αvβ3 antagonist to hamper the aggressiveness of mesenchymal triple negative breast cancer sub-type. Cancers. 2019;11:139. doi: 10.3390/cancers11020139. - DOI - PMC - PubMed
    1. Yu K-D, et al. Identification of prognosis-relevant subgroups in patients with chemoresistant triple-negative breast cancer. Clin. Cancer Res. 2013;19:2723–2733. doi: 10.1158/1078-0432.CCR-12-2986. - DOI - PMC - PubMed

Publication types