. 2023 Jun 2;14(1):3208.
doi: 10.1038/s41467-023-38842-6.

Senescent immune cells accumulation promotes brown adipose tissue dysfunction during aging

Affiliations

Senescent immune cells accumulation promotes brown adipose tissue dysfunction during aging

Xu Feng et al. Nat Commun. .

Abstract

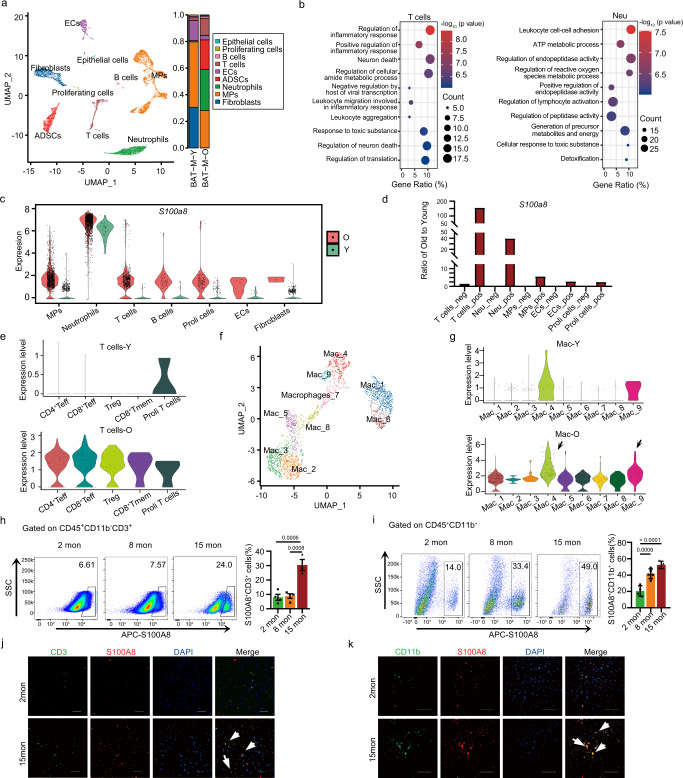
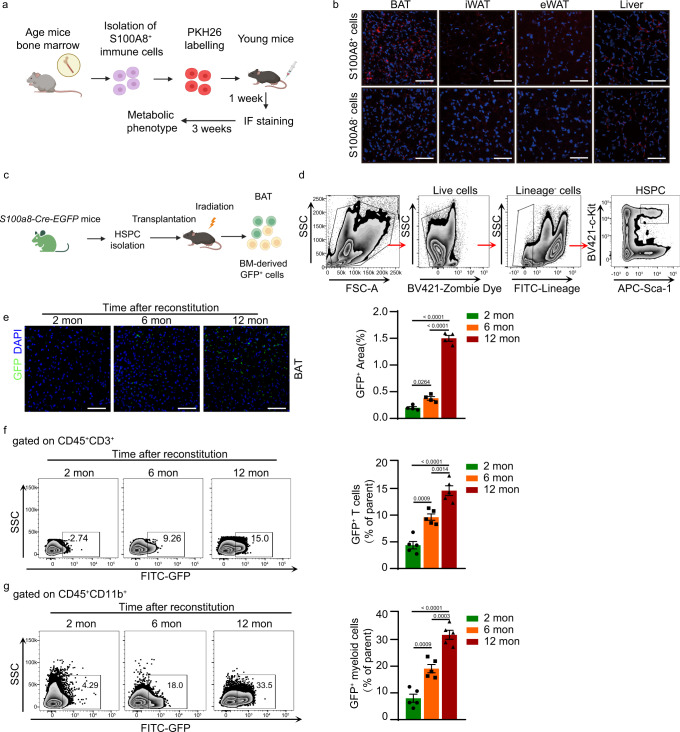
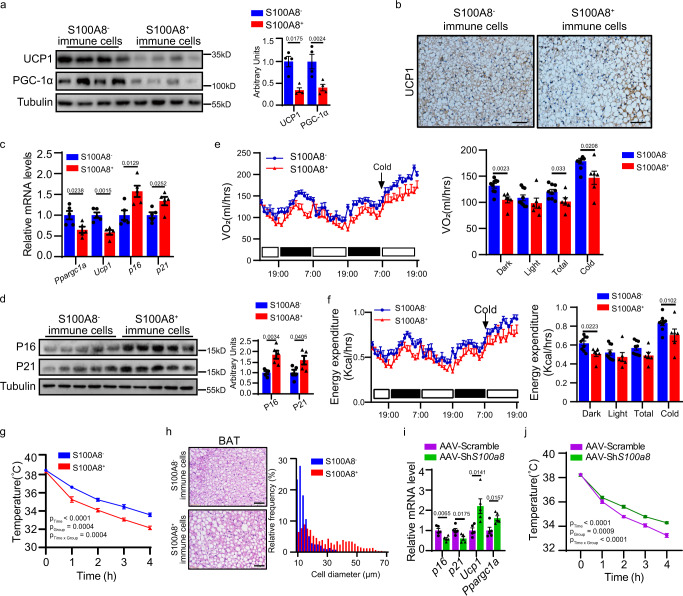
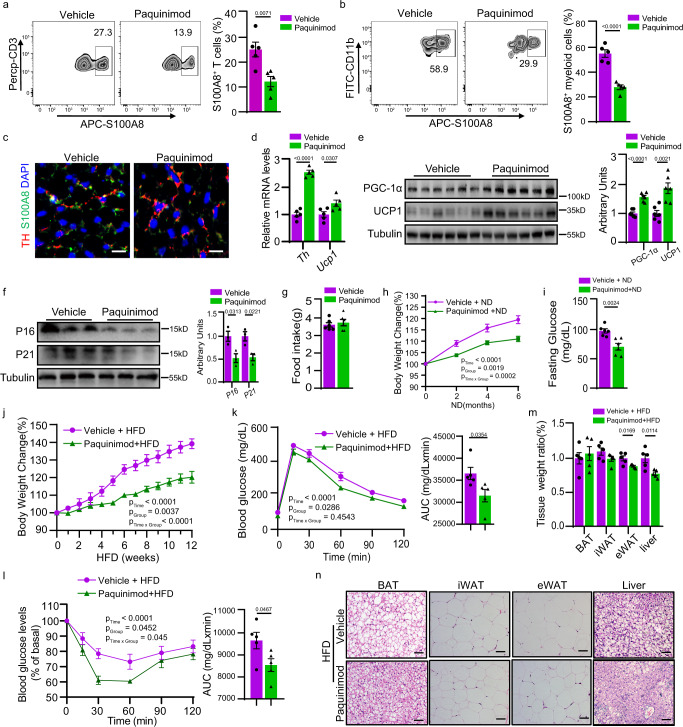
Brown adipose tissue (BAT)-mediated thermogenesis declines with age. However, the underlying mechanism remains unclear. Here we reveal that bone marrow-derived pro-inflammatory and senescent S100A8+ immune cells, mainly T cells and neutrophils, invade the BAT of male rats and mice during aging. These S100A8+ immune cells, coupled with adipocytes and sympathetic nerves, compromise axonal networks. Mechanistically, these senescent immune cells secrete abundant S100A8 to inhibit adipose RNA-binding motif protein 3 expression. This downregulation results in the dysregulation of axon guidance-related genes, leading to impaired sympathetic innervation and thermogenic function. Xenotransplantation experiments show that human S100A8+ immune cells infiltrate mice BAT and are sufficient to induce aging-like BAT dysfunction. Notably, treatment with S100A8 inhibitor paquinimod rejuvenates BAT axon networks and thermogenic function in aged male mice. Our study suggests that targeting the bone marrow-derived senescent immune cells presents an avenue to improve BAT aging and related metabolic disorders.


Conflict of interest statement

The authors declare no competing interests.

Figures

Fig. 1
Fig. 1. Pro-inflammatory and senescent S100A8+ immune cells accumulate in brown adipose tissue with age.
a Bioinformatics analysis of scRNA-seq of BAT from young (5-month-old) and aged (27-month-old) rats. b GO analysis of differentially expressed genes in T cells (left) and neutrophils (right) from aged rats. c Violin plots for gene expression of S100a8 in cell populations of BAT from young and aged rats. d Relative cell proportion of S100A8+ and S100A8 cell populations in the BAT of young and aged rats. e Violin plots for gene expression of S100a8 in T cell subclusters of young and aged rats. f UMAP plot shows clustering of macrophages based on gene expression. g Violin plots for gene expression of S100a8 in macrophage subclusters of young and old. h, i Representative flow cytometry plots and quantification of the frequencies of S100A8+ cells in CD45+ CD3+ T cells (h), and CD45+CD11b+ myeloid cells (i), in the stromal vascular fractions (SVFs) of BAT from 2-, 8- and 15-month-old mice (n = 3–5/group). j Representative images of CD3 (green) and S100A8 (red) and staining in the BAT of young (2 months) and aged (15 months) mice. Scale bar, 50 µm. k Representative images of CD11b (green) and S100A8 (red) staining in the BAT of young (2 months) and aged (15 months) mice. Scale bar, 50 µm. Data shown are representative of three independent experiments with similar results. n indicates the number of biologically independent samples examined. Quantitative data are shown as mean ± SEM. Statistical differences were supposed to be significant when P < 0.05. Statistical analysis was performed by one-way ANOVA with Tukey’s multiple-comparison test (h, i). Source data are provided as a Source Data File.
Fig. 2
Fig. 2. BAT-infiltrating S100A8+ immune cells originate from the bone marrow.
a Schematic diagram for isolation, labeling and transferring bone marrow-derived S100A8+ immune cells into young mice. This diagram was created with BioRender.com. b Representative images of PKH26-labeled S100A8 or S100A8+ immune cells infiltrating BAT, iWAT, eWAT and liver (n = 3). Scale bar, 100 μm. c Schematic diagram for bone marrow reconstitution of mice with HSPCs isolated from S100a8-Cre-EGFP mice. This diagram was created with BioRender.com. d Gating strategy of bone marrow hematopoietic stem/progenitor cells (HSPCs). e Representative images of GFP+ cells in the BAT of bone marrow reconstitution mice during aging (n = 4). Scale bar, 100 μm. f, g Representative flow cytometry plots and quantification of the frequencies of GFP+ cells in CD45+ CD3 + T cells (f) (n = 5/group), and CD45+CD11b+ myeloid cells (g) (n = 5/group), in the SVFs of BAT from bone marrow reconstitution mice during aging. Data shown are representative of three independent experiments with similar results. n indicates the number of biologically independent samples examined. Data are shown as mean ± SEM. Statistical differences were supposed to be significant when P < 0.05. Statistical analysis was performed by one-way ANOVA with Tukey’s multiple-comparison test (eg). Source data are provided as a Source Data File.
Fig. 3
Fig. 3. Senescent S100A8+ immune cells are sufficient to inhibit BAT thermogenic function in young mice.
a Representative immunoblots of thermogenic markers UCP1 and PGC-1α in the BAT of mice transferred with S100A8+ immune cells or S100A8 immune cells (n = 4). b Representative images of UCP1 staining of the BAT from mice transferred with S100A8+ immune cells or S100A8 immune cells. Scale bar, 50 μm. c Relative mRNA levels of Ucp1, Ppargc1α, p16 and p21 in the BAT of mice transferred with S100A8+ immune cells or S100A8 immune cells (n = 4). d Representative immunoblots of P16 and P21 in the BAT of mice transferred with S100A8+ immune cells or S100A8 immune cells (n = 5). e Oxygen consumption of mice transferred with S100A8+ immune cells or S100A8 immune cells (n = 6–9). f Energy expenditure of mice transferred with S100A8+ immune cells or S100A8 immune cells (n = 6–9). g Core body temperature of mice transferred with S100A8+ immune cells or S100A8 immune cells under cold stimulation (n = 5). h Hematoxylin-eosin staining and adipocyte cell-diameter quantification for BAT of mice transferred with S100A8+ immune cells or S100A8- immune cells. Scale bar, 50 μm. i Relative mRNA levels of thermogenic and aging-related genes in the BAT of mice injected with AAV-Scramble and AAV-ShS100a8 (n = 5). j Core body temperature of mice injected with AAV-Scramble and AAV- ShS100a8 under cold stimulation (n = 5). Data shown are representative of three independent experiments with similar results. n indicates the number of biologically independent samples examined. Data are shown as the mean ± SEM. Statistical differences were supposed to be significant when P < 0.05. Statistical analysis was performed by two-way ANOVA (g, j), ANCOVA with body weight as covariant (e, f) or unpaired two-tailed Student’s t test (a, c, d, i). Source data are provided as a Source Data File.
Fig. 4
Fig. 4. S100A8+ immune cells, coupling with sympathetic nerves and adipocytes, form neuroimmune adipose interfaces that inhibit sympathetic innervation.
a Heatmap of differentially expressed genes (DEGs) in differentiated brown adipocytes treated with S100A8 (P < 0.05 and |log2(Fold change)| >0.38). b GO analysis of DEGs in (a). c Representative images of age-associated changes in S100A8+ immune cells and tyrosine hydroxylase positive (TH+) sympathetic nerves in the BAT of 2-month-old and 15-month-old mice. Scale bar, 100 μm. d Representative images of the localization of S100A8+ immune cells and TH+ sympathetic nerves in the BAT of 2- and 15-month-old mice. Scale bar, 10 μm. e Pearson correlation analysis of the fluorescence intensity between S100A8 and TH in the BAT of 2-month-old and 15-month-old mice. f Representative immunoblots of TH, phospho-TH (Ser40) (p-TH) and TUBB3 in the BAT of mice transferred with S100A8+ immune cells or S100A8- immune cells (n = 3). g Schematic diagram of neuroimmune adipose interface in the BAT. This diagram was created with BioRender.com. h Venn diagram of downregulated DEGs in RNA-seq datasets of S100A8-treated brown adipocytes and BAT of aged mice. i Representative immunoblots of RBM3 in the BAT of 2- and 15-month-old mice (n = 3). j Representative immunoblots of RBM3 in the BAT of mice transferred with S100A8+ immune cells or S100A8 immune cells (n = 3). k Representative images of TH staining in the BAT of mice injected with AAV-ShRbm3 or AAV-Scramble. Scale bar, 100 µm. l Representative immunoblots of UCP1, TH, p-TH, TUBB3 and RBM3 in the BAT of mice injected with AAV-ShRbm3 or AAV-Scramble (n = 3). m Core body temperature of mice injected with AAV-ShRbm3 or AAV-Scramble under cold stimulation (n = 5–7). Data shown are representative of three independent experiments with similar results. n indicates the number of biologically independent samples examined. Data are shown as the mean ± SEM. Statistical differences were supposed to be significant when P < 0.05. Statistical analysis was performed by two-way ANOVA (m), or unpaired two-tailed Student’s t test (f, il). Source data are provided as a Source Data File.
Fig. 5
Fig. 5. Adipose RBM3 mediates the action of S100A8+ immune cells in sympathetic innervation.
a Schematic diagram of experimental processes. This diagram was created with BioRender.com. b Representative images of TH staining in the BAT of mice injected with AAV-RBM3 or AAV-NC and transferred with S100A8+ immune cells. Scale bar, 100 µm. c Representative immunoblots of UCP1, TH, p-TH, TUBB3 and RBM3 in the BAT of mice injected with AAV-RBM3 or AAV-NC and transferred with S100A8+ immune cells (n = 3). d Relative mRNA levels of Rbm3, Th Ucp1, Ppargc1α, p16, and p21 in the BAT of mice injected with AAV-RBM3 or AAV-NC and transferred with S100A8+ immune cells (n = 5). e Oxygen consumption of mice injected with AAV-RBM3 or AAV-NC and transferred with S100A8+ immune cells or S100A8- immune cells (n = 6–7). f Core body temperature of mice injected with AAV-RBM3 or AAV-NC were transferred with S100A8+ immune cells and subjected to cold challenge (n = 5). g Venn diagram showing overlapped genes which are RBM3-bounded and differentially expressed upon Rbm3 knockdown. h KEGG analysis of the 909 overlapped genes shown in (g). i Heatmap of axon guidance-related gene expressions based on RNA-seq data of Rbm3 knockdown differentiated brown adipocytes. j Relative mRNA levels of Rbm3 and axon guidance-related genes Nrp1 and Epha7 in differentiated brown adipocytes transfected with si-Rbm3 or si-NC (n = 3). k Representative immunoblots of NRP1 and EPHA7 in differentiated brown adipocytes transfected with si-Rbm3 or si-NC (n = 4). l RNA immunoprecipitation (RIP) assay assessing RBM3 binding on 3´UTR of Nrp1 and Epha7 in differentiated brown adipocytes (n = 4). m Relative mRNA level of Nrp1 and Epha7 in si-Rbm3 or si-NC transfected brown adipocytes upon transcriptional inhibition with actinomycin D at indicated time (n = 3). n Representative images of TUBB3 staining in PC12 cells cocultured with differentiated brown adipocytes overexpressed with RBM3 and transfected with si-Nrp1 or si-Epha7 (n = 4). Scale bar, 100 µm. Data shown are representative of three independent experiments with similar results. n indicates the number of biologically independent samples examined. Data are shown as the mean ± SEM. Statistical differences were supposed to be significant when P < 0.05. Statistical analysis was performed by one-way ANOVA with Tukey’s multiple-comparison test (n) or two-way ANOVA (f, m), ANCOVA with body weight as covariant (e) or unpaired two-tailed Student’s t test (c, d, jl). Source data are provided as a Source Data File.
Fig. 6
Fig. 6. Transplantation of human S100A8+ immune cells induce BAT aging and thermogenic decline in mice.
a, b Representative flow cytometry plots and quantification of frequencies of S100A8+ immune cells (a) and T cells (b) in peripheral blood cells from young and old normal healthy donors (all males; Young: n = 9, Old: n = 13). c Correlation of S100a8 with p21 (Kras) expression in human whole blood cells based on data from the Genotype Tissue Expression (GTEx) database. d Schematic diagram of experimental processes of transplantation of human S100A8+ or S100A8 immune cells into NOD-SCID mice. This diagram was created with BioRender.com. e Serum concentration of TNF and IL-6 in transplanted mice (n = 5). f Representative flow cytometry plots and quantification of frequencies of human CD45+ immune cells in the SVFs of BAT from transplanted mice (n = 5). g Representative images of TH and human CD45 staining in the BAT of transplanted mice. Scale bar, 100 μm. h Representative immunoblots of UCP1, P16, and P21 in the BAT of transplanted mice (n = 5). i SA-β-gal staining of BAT and its frozen sections of transplanted mice. j Representative infrared thermal images of BAT of transplanted mice subjected to cold stimulation for 6 h (n = 5). k Core body temperature of transplanted mice under cold stimulation (n = 5). Data shown are representative of three independent experiments with similar results. n indicates the number of biologically independent samples examined. Data are shown as the mean ± SEM. Statistical differences were supposed to be significant when P < 0.05. Statistical analysis was performed by two-way ANOVA (k), or unpaired two-tailed Student’s t test (a, b, eh). Source data are provided as a Source Data File.
Fig. 7
Fig. 7. Paquinimod disrupts the function of S100A8+ senescent immune cells and ameliorates age-related metabolic dysfunction.
a, b Representative flow cytometry plots and quantification of frequencies of S100A8+ T cells (a) and myeloid cells (b) in SVFs of BAT of 15-month-old mice treated with paquinimod or vehicle (n = 4–5). c Representative images of TH and S100A8 staining in the BAT of 15-month-old mice treated with paquinimod or vehicle. Scale bar, 20 µm. d Relative mRNA levels of Th and Ucp1 in the BAT of 15-month-old mice treated with paquinimod or vehicle (n = 5). e Representative immunoblots of UCP1 and PGC-1α in the BAT of 15-month-old mice treated with paquinimod or vehicle (n = 6). f Representative immunoblots of P16 and P21 in the BAT of 15-month-old mice treated with paquinimod or vehicle (n = 3). g Food intake of mice treated with paquinimod or vehicle (n = 5). h Body weight changes of normal chow diet-fed 15-month-old mice treated with paquinimod or vehicle (n =  5–6). i Fasting glucose levels of normal chow diet-fed mice after treated with paquinimod or vehicle for 6 months (n = 5–6). jn Body weight changes (j), glucose tolerance (k), insulin sensitivity (l), tissue weights ratio (m), HE staining of adipose tissue and liver (n) in HFD-fed mice treated with paquinimod or vehicle (n = 5). Scale bar, 50 µm. Data shown are representative of three independent experiments with similar results. n indicates the number of biologically independent samples examined. Data are shown as the mean ± SEM. Statistical differences were supposed to be significant when P < 0.05. Statistical analysis was performed by two-way ANOVA (h, jl), or unpaired two-tailed Student’s t test (a, b, df, i, m). Source data are provided as a Source Data File.

References

    1. Zoico E, et al. Brown and beige adipose tissue and aging. Front. Endocrinol. 2019;10:368. doi: 10.3389/fendo.2019.00368. - DOI - PMC - PubMed
    1. Zhou H, et al. DsbA-L deficiency in T cells promotes diet-induced thermogenesis through suppressing IFN-gamma production. Nat. Commun. 2021;12:326. doi: 10.1038/s41467-020-20665-4. - DOI - PMC - PubMed
    1. Desdin-Mico G, et al. T cells with dysfunctional mitochondria induce multimorbidity and premature senescence. Science. 2020;368:1371–1376. doi: 10.1126/science.aax0860. - DOI - PMC - PubMed
    1. Yousefzadeh MJ, et al. An aged immune system drives senescence and ageing of solid organs. Nature. 2021;594:100–105. doi: 10.1038/s41586-021-03547-7. - DOI - PMC - PubMed
    1. Luo OJ, et al. Multidimensional single-cell analysis of human peripheral blood reveals characteristic features of the immune system landscape in aging and frailty. Nat. Aging. 2022;2:348–364. doi: 10.1038/s43587-022-00198-9. - DOI - PubMed

Publication types

LinkOut - more resources