. 2023 Jun 2;13(1):8964.
doi: 10.1038/s41598-023-35679-3.

The evolution of atmospheric particulate matter in an urban landscape since the Industrial Revolution

Affiliations

The evolution of atmospheric particulate matter in an urban landscape since the Industrial Revolution

Ann L Power et al. Sci Rep. .

Abstract

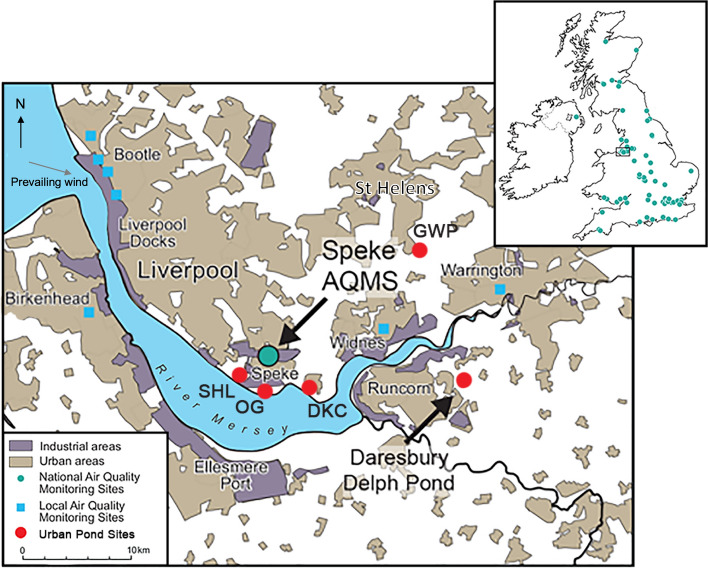
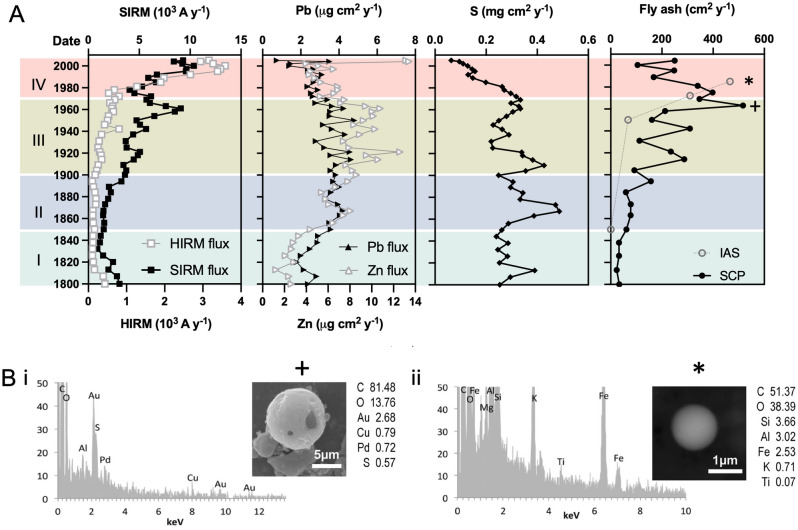
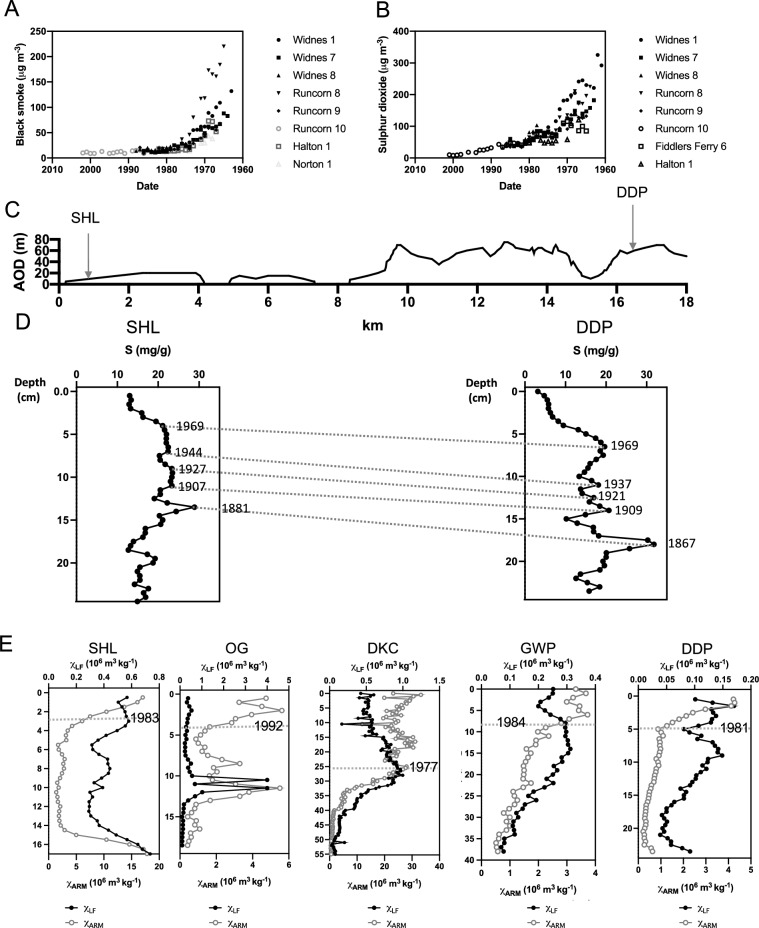
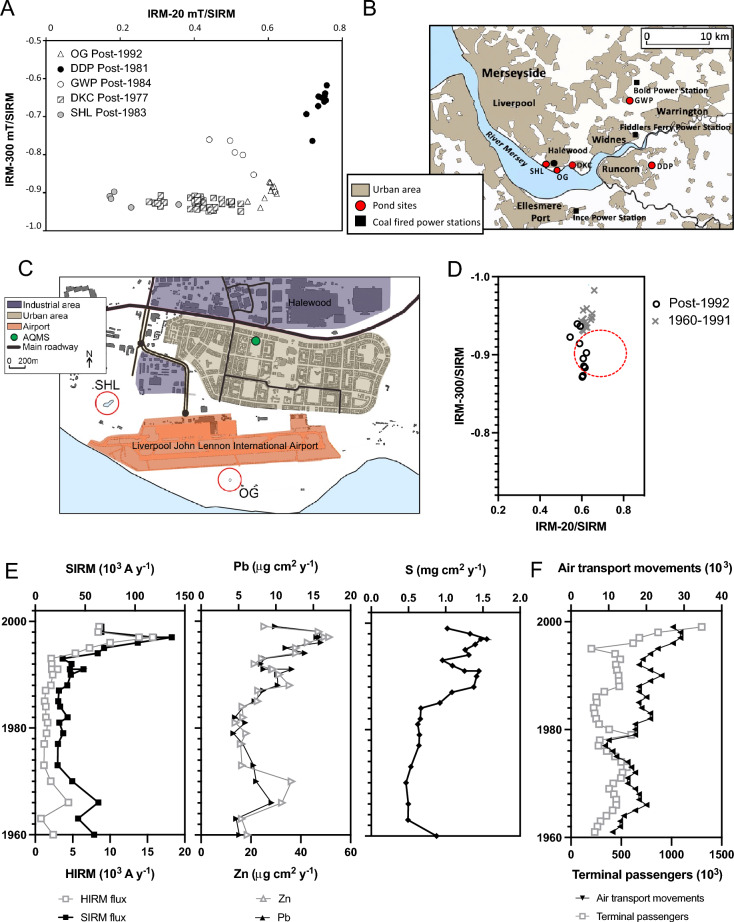
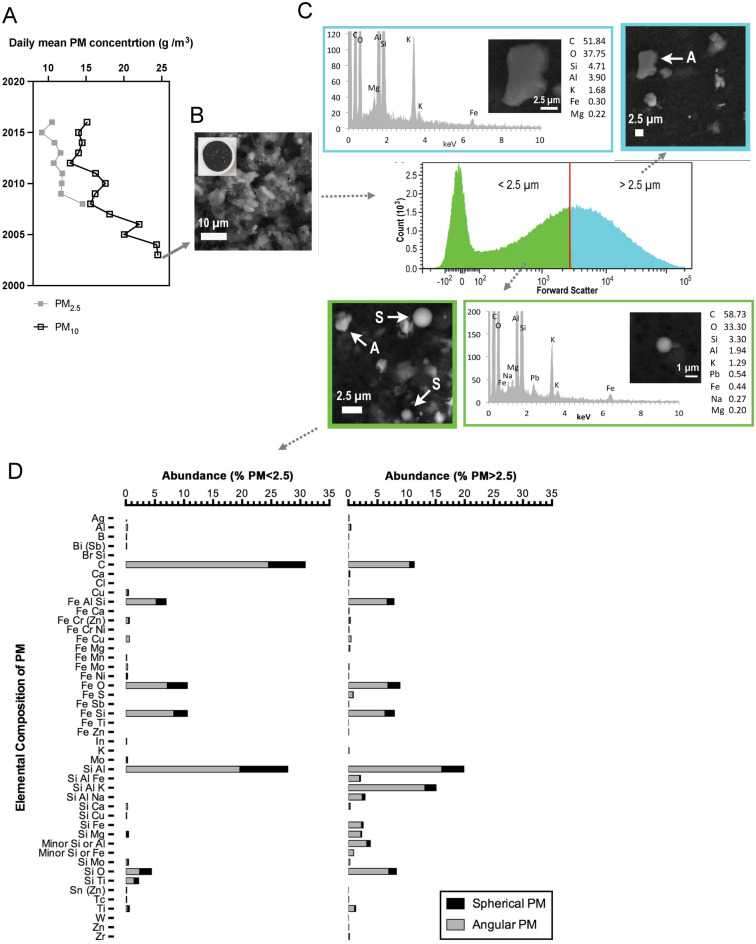
Atmospheric particulate matter (PM) causes 3.7 million annual deaths worldwide and potentially damages every organ in the body. The cancer-causing potential of fine particulates (PM2.5) highlights the inextricable link between air quality and human health. With over half of the world's population living in cities, PM2.5 emissions are a major concern, however, our understanding of exposure to urban PM is restricted to relatively recent (post-1990) air quality monitoring programmes. To investigate how the composition and toxicity of PM has varied within an urban region, over timescales encompassing changing patterns of industrialisation and urbanisation, we reconstructed air pollution records spanning 200 years from the sediments of urban ponds in Merseyside (NW England), a heartland of urbanisation since the Industrial Revolution. These archives of urban environmental change across the region demonstrate a key shift in PM emissions from coarse carbonaceous 'soot' that peaked during the mid-twentieth century, to finer combustion-derived PM2.5 post-1980, mirroring changes in urban infrastructure. The evolution of urban pollution to a recent enhanced PM2.5 signal has important implications for understanding lifetime pollution exposures for urban populations over generational timescales.


Conflict of interest statement

The authors declare no competing interests.

Figures

Figure 1
Figure 1
Distribution of air quality monitoring stations in the UK and Merseyside, and locality of investigated urban lakes and ponds. National air quality monitoring stations (AQMS) measuring PM10 and PM2.5 in the UK are shown as green circles. PM10 was analysed from the AQMS at Speke (National Grid Reference (NGR): SJ 43887, 83600) in Liverpool Unitary Authority (UA), which has been operational since 21-05-2003 and has been able to differentiate between PM10 and PM2.5 since 17-09-2008. Sediments used to analyse historic levels of PM were collected from Daresbury Delph Pond (NGR: SJ 57373, 81958), selected as a representative site for the region due to prevailing NWN wind direction; Dogs Kennel Clump (DKC) (NGR: SJ 46344, 82105) located in Halton UA; Speke Hall Lake (SHL) (NGR: SJ 41960, 82789) and Oglet (OG) (NGR: SJ 43491, 81845) located in Liverpool UA; and Griffin Wood Pond (GWP) (NGR: SJ 3705, 90962) located in St Helens UA (Table 1). Map (1:400,000 scale) contains OS data Crown copyright and database rights 2023 Ordnance Survey (100025252), accessed at http://digimap.edina.ac.uk.
Figure 2
Figure 2
Geo-magnetic analysis of the sediment record from Daresbury Delph Pond. Down-core variations in magnetic concentration, mineralogy and grain size determined from concentrations of magnetic susceptibility (χLF), susceptibility of anhysteretic remanent magnetism (χARM), susceptibility frequency dependence (χFD), saturation isothermal remanence magnetisation (SIRM), hard isothermal remanence magnetization (HIRM) and inter-parametric ratios: S-RATIO (SIRM normalised to 100 mT backfield isothermal remanence magnetisation (IRM)), SIRM/χLF, SIRM/ARM and χARM/SIRM.
Figure 3
Figure 3
A history of air pollution deposition reconstructed from sediments of Daresbury Delph Pond (DDP), Runcorn (Halton). (A) Flux profiles for geomagnetic (SIRM, HIRM), geochemical (Pb, Zn, S) and fly ash particulate (spheroidal carbonaceous particles (SCP) and inorganic ash spheres (IAS)) pollution indicators. Concentration data were normalised for sedimentation accumulation rates to assess supply to the pond over time. (B) Exemplar pollution particles: SEM–EDS spectra, SEM images and corresponding mass of chemical elements (wt%) for representative SCP (i) and IAS (ii) extracted from the sediment horizons of 1963 (± 8 years) (+) and 1981 (± 6 years) (*) demonstrating the presence of fly ash within PM10 (i) and PM2.5 (ii) size fractions. Au and Pd peaks (i) are derived from the coating of the sample during preparation for SEM.
Figure 4
Figure 4
A cross-regional post-1800 air pollution signal for Merseyside reconstructed from urban ponds showing regional trends in sulphur deposition and a temporal shift to fine magnetic grains in recent sediments. (A) Mean annual black smoke and (B) sulphur dioxide concentrations monitored in Halton post-1961. Reproduced from the UK National Air Quality Archives (DEFRA) http://airquality.co.uk. Data were collated from several monitoring sites across the borough: Widnes 1 (NGR: SJ 513,854: 1963–1976), Widnes 7 (NGR: SJ 485,859: 1964–1986), Widens 8 (NGR: SJ 513,854: 1980–1989), Runcorn 8 (NGR: SJ 5108,31: 1965–1982), Runcorn 9 (NGR: SJ 519,821: 1966–1987), Runcorn 10 (NGR: SJ 511,833: 1984–2002) Halton 1 (NGR: SJ 536,819: 1967–1982) and Norton 1 (NGR: SJ 554,815: 1968–1986). (C) Topography of Merseyside from Daresbury (NGR: SJ 359, 382) to Speke (NGR: SJ 341, 382) showing the location of DDP in the east, and SHL in the west, of the region. (D) Post-1800 sulphur (S) concentrations recorded in sediments of SHL (core SHL1) and DDP (core BDD1) highlighting corresponding trends from the late nineteenth century: SHL peak at 1881 (± 24 years) and DDP peak at 1867 (± 26 years). Synchronicity in the 210Pb dates of S peaks between the two ponds highlights a likely regional atmospheric pollution signal. Declines in S deposition post-1970 (± 3 years at SHL and ± 8 years at DDP) mirror the decline in black smoke (A) and sulphur dioxide (B) concentrations monitored in Halton with significant statistical correlations observed (SI Table S9). (E) Concentration of total ferrimagentic grains (χLF) and fine (stable domain) ferrimagentic grains (χARM) in post-1900 sediment from Daresbury Delph Pond (DDP: 1900 (± 20 years) to 2006 (± 0 years)), Speke Hall Lake (SHL1: 1900 (± 17 years) to 2001 (± 0 years)), Griffin Wood Pond (GWP:  ~ 1900 (± 11 years) to 2013 (± 0 years)), Dogs Kennel Clump (DKC1: DKC2:  ~ 1900 (± 23 years) to 2013 (± 0 years)) and Oglet Pond (OG:  ~ 1914 (± 21 years) to 2001 (± 0 years)). χLF trends are a proxy for overall particulate pollution deposition. Proportionately higher χARM enhancements in the most recent sections of the cores indicate an increased contribution of relatively finer (~ < 2 μm) magnetic grains. All sites demonstrate an increase in the deposition of magnetic fines in recent (~ post-1980) sediments, highlighting a regional trend.
Figure 5
Figure 5
Distinguishing sources of pollution in recent urban pond sediments. (A) Discrimination of anthropogenic magnetic grains in recent sediments from Speke Hall Lake (SHL), Dogs Kennel Clump pond (DKC), Oglet pond (OG), Griffin Wood pond (GWP) and Daresbury Delph pond (DDP) using backfield isothermal remanent ratios (IRM-20 mT/SIRM and IRM-300 mT/SIRM), a variation of Hunt et al. (1984)’s magnetic bi-plot used to distinguish between fly ash and vehicular dusts. Daresbury Delph Pond (DDP) and Griffin Wood Pond (GW) samples demonstrate a relatively ‘harder’ antiferromagnetic signal, characteristic of fly ash emissions. SHL and DKC display a ferrimagnetic dominated signal, typical of urban particulates, from traffic and industrial emissions, that are characteristic of a mix of coarse (multi domain), fine (stable domain) and ultrafine magnetic grains. OG exhibits a relatively finer ferrimagnetic signal in post-1990 sediments, indicated by a decrease in grain size observed with increasing IRM-20mT/SIRM values. (B) Locality of urban ponds to coal fired power stations in the Merseyside region: Ince (1957–1997); Bold (1958–1991) and Fiddlers Ferry (1973–2020). Map (1:400,000 scale) contains OS data Crown copyright and database rights 2023 Ordnance Survey (100025252), accessed at digimap.edina.ac.uk. (C) Proximity (< 300 m) of OG pond to the runway at Liverpool John Lennon International Airport. Map (1:25,000 scale) contains OS data Crown copyright and database rights 2023 Ordnancy Survey (100025252), accessed at digimap.edina.ac.uk. (D) Detection of aviation-derived magnetic grains, specifically from aircraft engines, in post-1995 OG pond sediments. Distinguished by IRM-20 mT/SIRM versus IRM-300 mT/SIRM measurements, post-1995 sediments overlap magnetic values (red dashed line) reported for aircraft engine particulates. (E) Geochemical (Pb, Zn, S), and magnetic (SIRM, HIRM) flux profiles for OG pond. (F) Post-1960 air transport movements and terminal passengers recorded at John Lennon International Airport collated from Historical Annual Airport Tables produced by the Civil Aviation Authority http://www.caa.co.uk.
Figure 6
Figure 6
Characterisation of urban PM archived at Speke, Liverpool air quality monitoring station. (A) Daily mean PM10 and PM2.5 concentrations recorded at Speke, Liverpool air quality monitoring station, from commencement of monitoring (2003) to 2016. (B) Archived PM10 Tapered Element Oscillating Microbalance (TEOM) filter that collected PM10 from 08/09/2003 to 06/10/2003, prior to the AQMS’s capability to segregate between PM10 and PM2.5 with SEM images of the TEOM filter. (C) Extraction and analysis of PM2.5 and PM10 was achieved using flow cytometry and SEM–EDS. A histogram of the size distribution of PM removed from the TEOM filter was determined by the forward scatter properties of particulates, which were sorted via flow cytometry into PM < 2.5 µm (green) and PM 2.5 µm to 15 µm (blue). Exemplar angular (A) and spherical (S) PM are presented. SEM energy dispersive spectrometry (SEM–EDS) spectra, SEM images and corresponding mass of chemical elements (wt%) for selected particles are shown. Background elemental contributions from the filter are detailed in SI Table S11. (D) Relative abundance, composition and shape of PM < 2.5 µm. The geometric and chemical characteristics of 3,679 particulates were individually analysed by automated SEM–EDS. Particles were grouped into those with equivalent circular diameters < 2.5 μm (PM < 2.5) and > 2.5 μm (PM > 2.5) and classified by chemical composition (SI Table S12). Elements, including S and Pb, that were detected in < 1% of the PM are not shown here. Angular particulates are indicated by grey bars; spherical particulates are indicated by black bars.

References

    1. World Health Organisation. Air Pollution the Invisible Killer. https://www.who.int/health-topics/air-pollution (Accessed 20 May 2019).
    1. Schraufnagel DE, et al. Air pollution and noncommunicable diseases: A review by the Forum of International Respiratory Societies' Environmental Committee, Part 2: Air pollution and organ systems. Chest. 2019;155:417–426. doi: 10.1016/j.chest.2018.10.041. - DOI - PMC - PubMed
    1. Kelly FJ, Fussell JC. Air pollution and public health: Emerging hazards and improved understanding of risk. Environ. Geochem. Health. 2015;37:631–649. doi: 10.1007/s10653-015-9720-1. - DOI - PMC - PubMed
    1. Yue H, He C, Huang Q, Yin D, Bryan BA. Stronger policy required to substantially reduce deaths from PM2.5 pollution in China. Nat. Commun. 2020;11:1462. doi: 10.1038/s41467-020-15319-4. - DOI - PMC - PubMed
    1. Brugha R, Grigg J. Urban air pollution and respiratory infections. Paediatr. Respir. Rev. 2014;15:194–199. doi: 10.1016/j.prrv.2014.03.001. - DOI - PubMed