Review
. 2023 Oct;29(10):2775-2786.
doi: 10.1111/cns.14280. Epub 2023 Jun 2.

Comprehensive analyses of brain cell communications based on multiple scRNA-seq and snRNA-seq datasets for revealing novel mechanism in neurodegenerative diseases

Affiliations
Review

Comprehensive analyses of brain cell communications based on multiple scRNA-seq and snRNA-seq datasets for revealing novel mechanism in neurodegenerative diseases

Chunlong Zhang et al. CNS Neurosci Ther. 2023 Oct.

Abstract

Aims: Complex cellular communications between glial cells and neurons are critical for brain normal function and disorders, and single-cell level RNA-sequencing datasets display more advantages for analyzing cell communications. Therefore, it is necessary to systematically explore brain cell communications when considering factors such as sex and brain region.

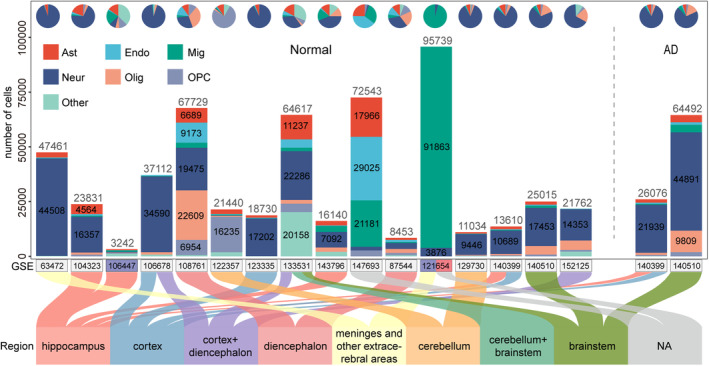
Methods: We extracted a total of 1,039,459 cells derived from 28 brain single-cell RNA-sequencing (scRNA-seq) or single-nucleus RNA-sequencing (snRNA-seq) datasets from the GEO database, including 12 human and 16 mouse datasets. These datasets were further divided into 71 new sub-datasets when considering disease, sex, and region conditions. In the meanwhile, we integrated four methods to evaluate ligand-receptor interaction score among six major brain cell types (microglia, neuron, astrocyte, oligodendrocyte, OPC, and endothelial cell).

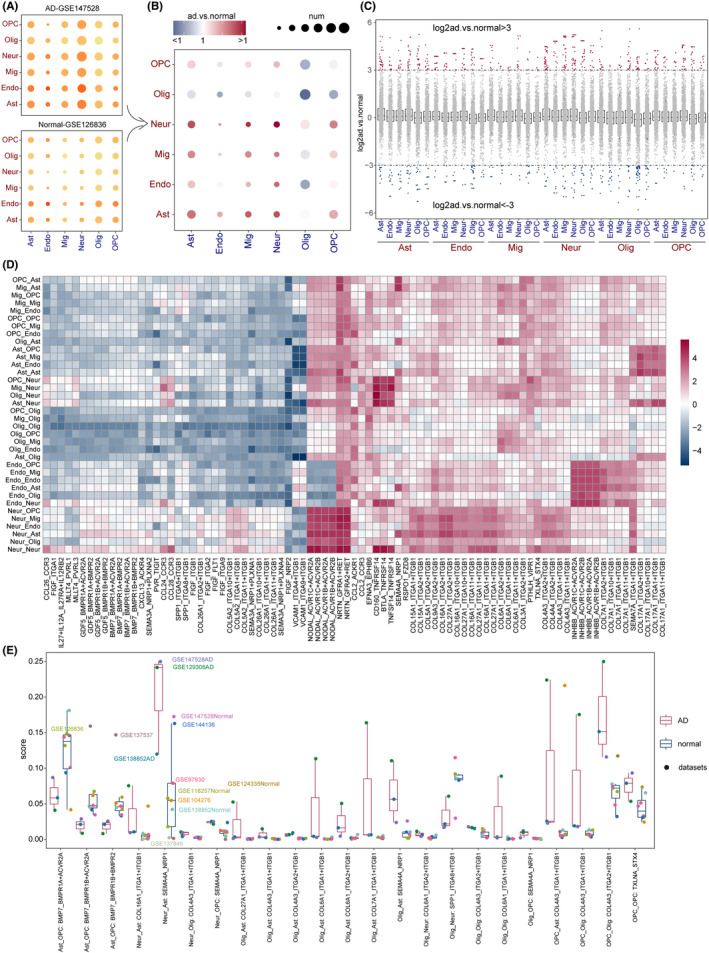
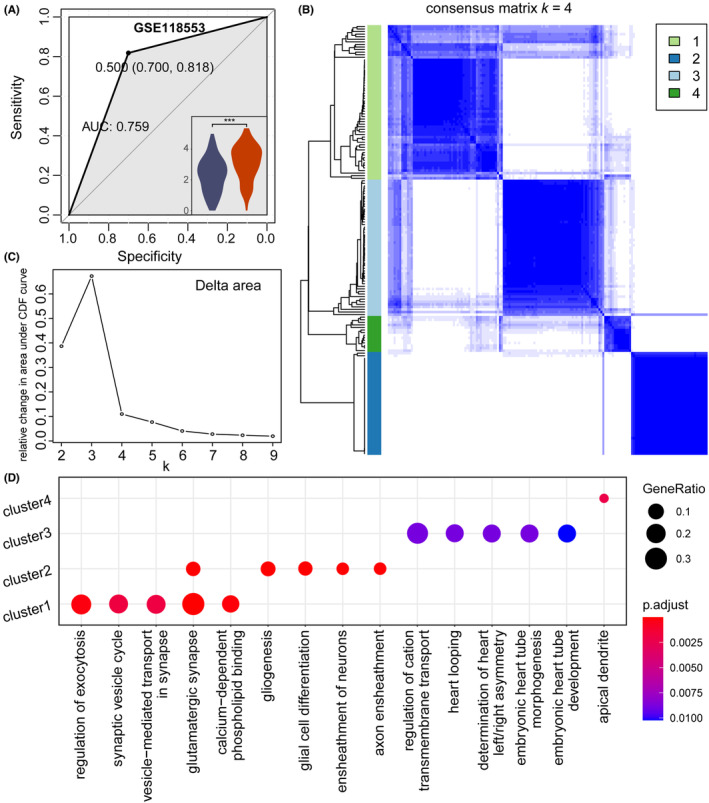
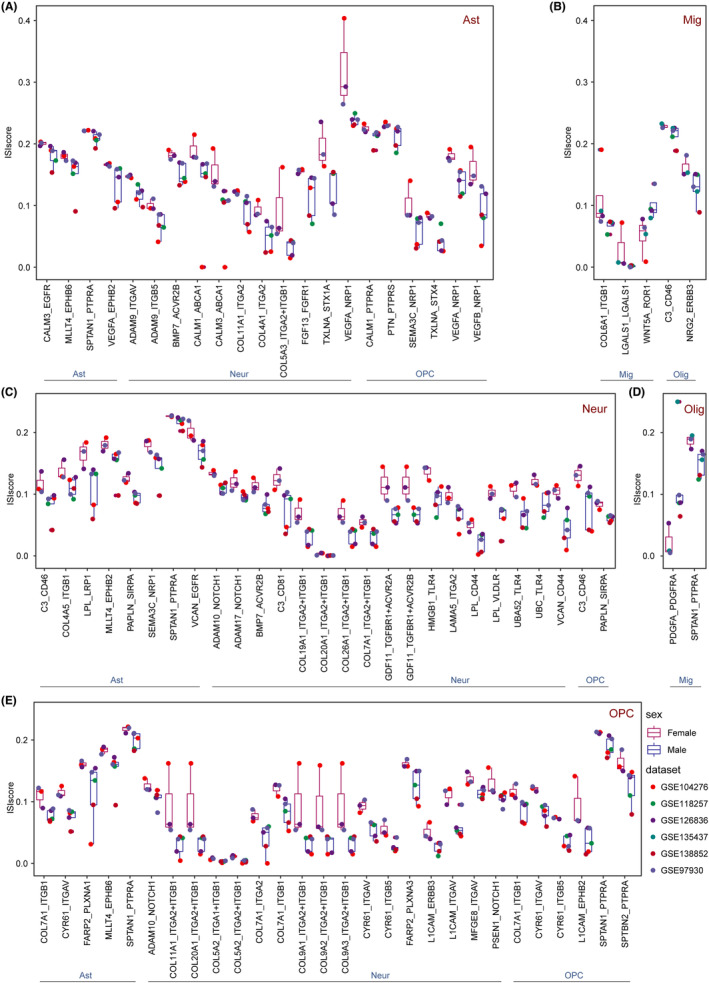
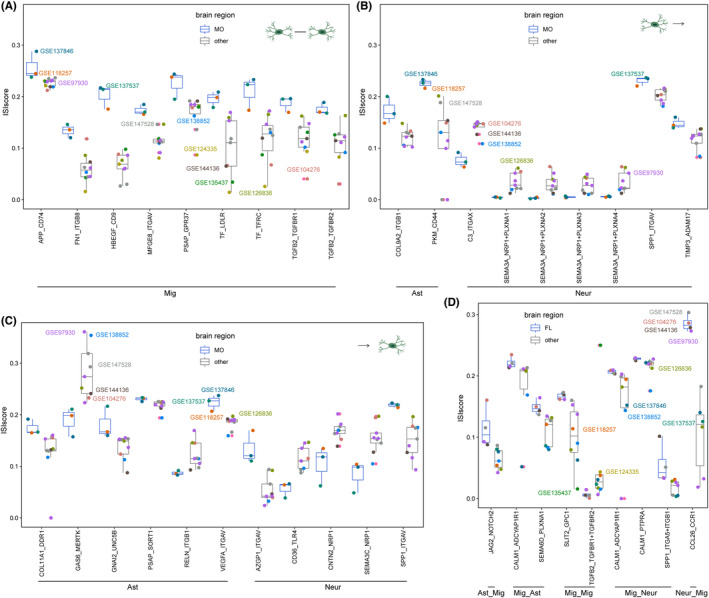
Results: For Alzheimer's disease (AD), disease-specific ligand-receptor pairs when compared with normal sub-datasets, such as SEMA4A-NRP1, were identified. Furthermore, we explored the sex- and region-specific cell communications and identified that WNT5A-ROR1 among microglia cells displayed close communications in male, and SPP1-ITGAV displayed close communications in the meninges region from microglia to neurons. Furthermore, based on the AD-specific cell communications, we constructed a model for AD early prediction and confirmed the predictive performance using multiple independent datasets. Finally, we developed an online platform for researchers to explore brain condition-specific cell communications.

Conclusion: This research provided a comprehensive study to explore brain cell communications, which could reveal novel biological mechanisms involved in normal brain function and neurodegenerative diseases such as AD.

Keywords: Alzheimer's disease; bioinformatic platform; brain; cell communications.


Conflict of interest statement

The authors declare that they have no competing interests.

Figures

FIGURE 1
FIGURE 1
Human scRNA‐seq and snRNA‐seq dataset resource. The bar and pie charts in the top indicated the number of cells in each dataset and the proportion of cell types. The vertical coordinate indicated the number of cells, and the horizontal coordinate indicated datasets, where the color of the horizontal coordinate represented whether there existed gender information (male: blue, female: red). The lower part of the Sankey plot displayed the brain region information for all datasets.
FIGURE 2
FIGURE 2
Human AD‐specific cell communications. (A) The total number of ligand–receptor pairs and the sum of ISIscore in the AD sub‐dataset (GSE147528‐AD) and normal sub‐dataset (GSE126836‐normal). The size of the dot represented the number of ligand–receptor pairs, and the color of the dot represented the sum of ISIscore. (B) Significant ligand–receptor pairs with Wilcoxon rank‐sum test and the ratio of ISIscore between AD and normal sub‐dataset. The size of the dots indicated the number of significant ligand–receptor pairs for cell communications. (C) AD‐ and normal‐specific ligand–receptor pairs with |log2(AD/normal)| > 3 and <−3. The horizontal coordinates indicated cell communications and the dots indicated ligand–receptor pairs. (D) The ratio of ISIscore of ligand–receptor pairs for cell communications between these two sub‐datasets. (E) Significant AD‐ and normal‐specific ligand–receptor pairs when considering all AD and normal sub‐datasets.
FIGURE 3
FIGURE 3
AD subtype analysis based cell communications (GSE118553). (A) ROC curves of model using AD ligand–receptor pairs in Figure 2C. The lower right‐hand corner showed the distribution of perturbation values for log2‐transformed reciprocal pairs in the normal and AD samples. (B) Heatmap of the optimal consensus matrix based on AD ligand–receptor pairs. Rows and columns indicated AD samples. (C) The Delta area plot showed the relative change in area under the CDF curve. Area change slowed down when K = 4. (D) The top 5 Gene Ontology (GO) terms for the four subtypes identified above.
FIGURE 4
FIGURE 4
Human sex‐specific cell communications. Sex‐specific ligand–receptor pairs for (A) astrocytes, (B) microglia, (C) neuron, (D) oligodendrocytes, and (E) oligodendrocyte progenitor cells as the sending cell. The colors of the boxes represented the different sex (male and female) and the colors of the dots represented the datasets. Red text indicated sending cells, and blue text indicated receiving cells.
FIGURE 5
FIGURE 5
Human region‐specific cell communications. (A) Region‐specific ligand–receptor pairs for (A) microglia as sending and receiving cells. (B) Microglia as sending cells (C) microglia as receiving cells. (D) Significant ligand–receptor pairs associated with microglia between FL and other regions. The colors of the boxes represented the brain regions and the colors of the dots represented the datasets.

Similar articles

Cited by

References

    1. Obeso JA, Rodríguez‐Oroz MC, Benitez‐Temino B, et al. Functional organization of the basal ganglia: therapeutic implications for Parkinson's disease. Mov Disord. 2008;23(Suppl 3):S548‐S559. - PubMed
    1. Gandhi S, Abramov AY. Mechanism of oxidative stress in neurodegeneration. Oxid Med Cell Longev. 2012;2012:428010. - PMC - PubMed
    1. Kipps CM, Duggins AJ, Mahant N, Gomes L, Ashburner J, McCusker EA. Progression of structural neuropathology in preclinical Huntington's disease: a tensor based morphometry study. J Neurol Neurosurg Psychiatry. 2005;76(5):650‐655. - PMC - PubMed
    1. Esiri MM. Ageing and the brain. J Pathol. 2007;211(2):181‐187. - PubMed
    1. Mielke MM, Vemuri P, Rocca WA. Clinical epidemiology of Alzheimer's disease: assessing sex and gender differences. Clin Epidemiol. 2014;6:37‐48. - PMC - PubMed

Publication types