

TL1A promotes the postoperative cognitive dysfunction in mice through NLRP3-mediated A1 differentiation of astrocytes
- PMID: 37269079
- PMCID: PMC10580360
- DOI: 10.1111/cns.14290
TL1A promotes the postoperative cognitive dysfunction in mice through NLRP3-mediated A1 differentiation of astrocytes
Abstract
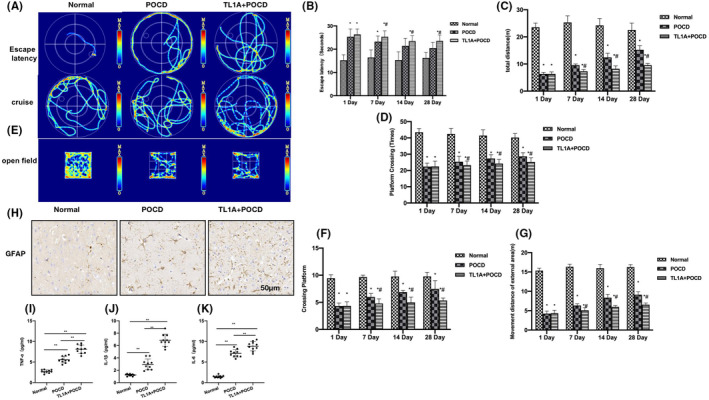
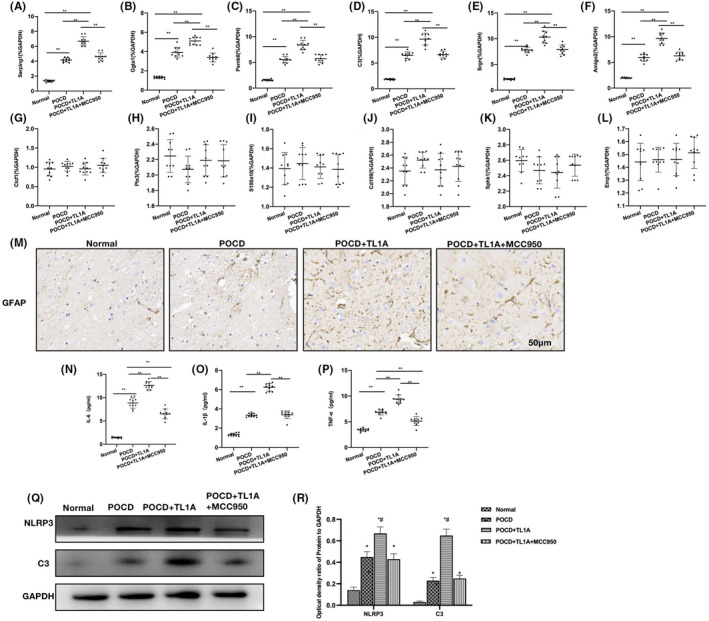
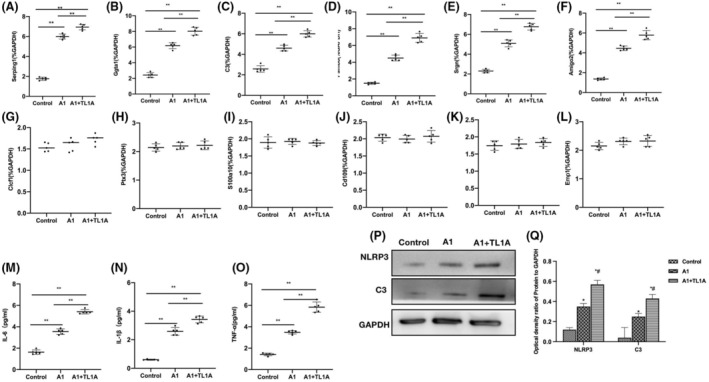
Aim: We investigated the mechanism, whereby tumor necrosis factor-like ligand 1A (TL1A) mediates the A1 differentiation of astrocytes in postoperative cognitive dysfunction (POCD).
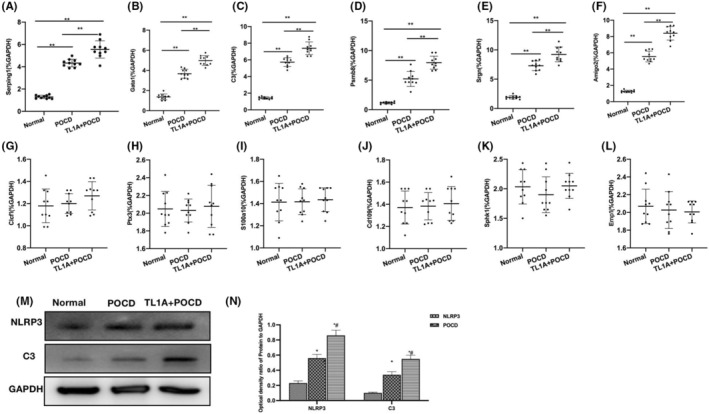
Methods: The cognitive and behavioral abilities of mice were assessed by Morris water maze and open field tests, while the levels of key A1 and A2 astrocyte factors were detected by RT-qPCR. Immunohistochemical (IHC) staining was used to examine the expression of GFAP, western blot was used to assay the levels of related proteins, and enzyme-linked immunosorbent assay (ELISA) was used to detect the levels of inflammatory cytokines.
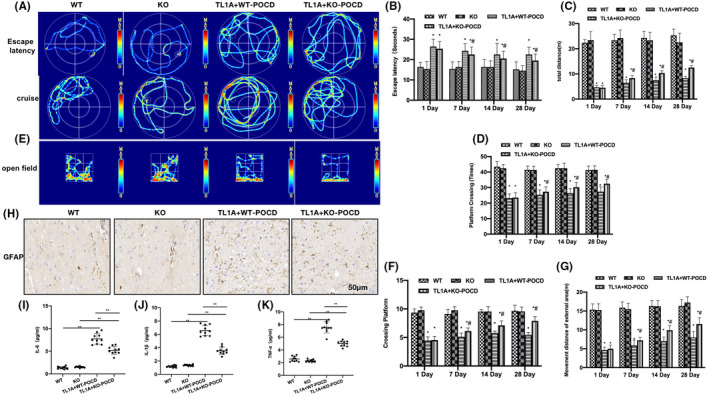
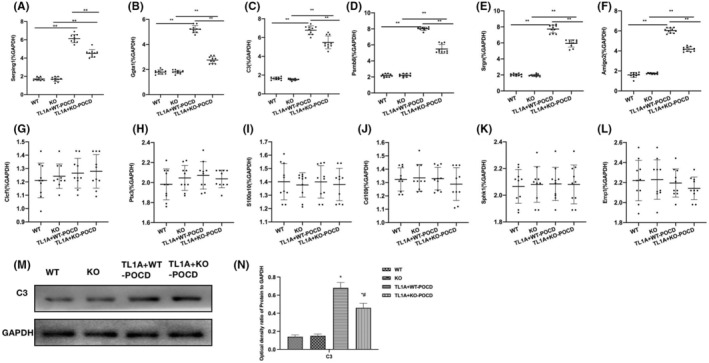
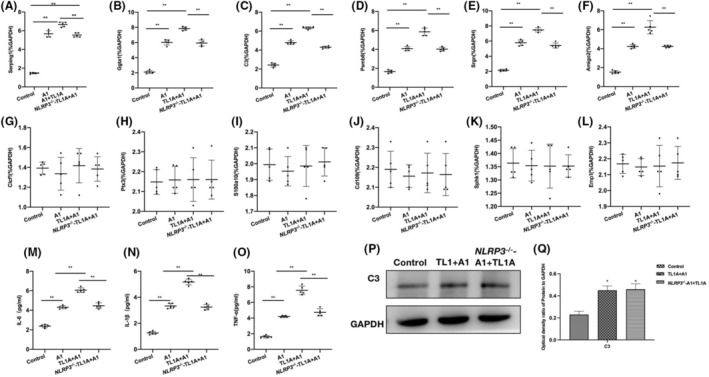
Results: The results showed that TL1A could promote the progression of cognitive dysfunction in mice. Astrocytes differentiated into A1 phenotype, while unobvious changes were noted in astrocyte A2 biomarkers. Knockout of NLRP3 or intervention with NLRP3 inhibitor could inhibit the effect of TL1A, improving the cognitive dysfunction and suppressing the A1 differentiation.
Conclusion: Our results demonstrate that TL1A plays an important role in POCD in mice, which promotes the A1 differentiation of astrocytes through NLRP3, thereby exacerbating the progression of cognitive dysfunction.
Keywords: POCD; TL1A; astrocytes; cognitive dysfunction.
© 2023 The Authors. CNS Neuroscience & Therapeutics published by John Wiley & Sons Ltd.
Figures
Similar articles
-
Actions of dexmedetomidine in regulating NLRP3 in postoperative cognitive dysfunction in aged mice via the autophagy-lysosome pathway.Br J Pharmacol. 2025 Apr;182(8):1683-1703. doi: 10.1111/bph.17378. Epub 2025 Jan 15. Br J Pharmacol. 2025. PMID: 39815423
-
NLRP3 inflammasome regulates astrocyte transformation in brain injury induced by chronic intermittent hypoxia.BMC Neurosci. 2022 Nov 27;23(1):70. doi: 10.1186/s12868-022-00756-2. BMC Neurosci. 2022. PMID: 36437451 Free PMC article.
-
Atractylenolide I Suppresses A1 Astrocyte Activation to Improve Depression in Mice.Mol Neurobiol. 2024 Sep;61(9):7037-7045. doi: 10.1007/s12035-024-04025-7. Epub 2024 Feb 17. Mol Neurobiol. 2024. PMID: 38368288
-
NLRP3 inflammasomes are involved in the progression of postoperative cognitive dysfunction: from mechanism to treatment.Neurosurg Rev. 2021 Aug;44(4):1815-1831. doi: 10.1007/s10143-020-01387-z. Epub 2020 Sep 12. Neurosurg Rev. 2021. PMID: 32918635 Review.
-
Bridging metabolic syndrome and cognitive dysfunction: role of astrocytes.Front Endocrinol (Lausanne). 2024 May 10;15:1393253. doi: 10.3389/fendo.2024.1393253. eCollection 2024. Front Endocrinol (Lausanne). 2024. PMID: 38800473 Free PMC article. Review.
Cited by
-
C3/C3aR Bridges Spinal Astrocyte-Microglia Crosstalk and Accelerates Neuroinflammation in Morphine-Tolerant Rats.CNS Neurosci Ther. 2025 Jan;31(1):e70216. doi: 10.1111/cns.70216. CNS Neurosci Ther. 2025. PMID: 39801259 Free PMC article.
-
mtDNA-cGAS-STING axis-dependent NLRP3 inflammasome activation contributes to postoperative cognitive dysfunction induced by sevoflurane in mice.Int J Biol Sci. 2024 Mar 3;20(5):1927-1946. doi: 10.7150/ijbs.91543. eCollection 2024. Int J Biol Sci. 2024. PMID: 38481801 Free PMC article.
-
Inhibiting endoplasmic reticulum stress alleviates perioperative neurocognitive disorders by reducing neuroinflammation mediated by NLRP3 inflammasome activation.CNS Neurosci Ther. 2024 Oct;30(10):e70049. doi: 10.1111/cns.70049. CNS Neurosci Ther. 2024. PMID: 39432407 Free PMC article.
-
Post-operative cognitive dysfunction is exacerbated by high-fat diet via TLR4 and prevented by dietary DHA supplementation.Brain Behav Immun. 2024 Feb;116:385-401. doi: 10.1016/j.bbi.2023.12.028. Epub 2023 Dec 23. Brain Behav Immun. 2024. PMID: 38145855 Free PMC article.
-
Mitochondrial modulation treating postoperative cognitive dysfunction neuroprotection via DRP1 inhibition by Mdivi1.Sci Rep. 2024 Oct 30;14(1):26155. doi: 10.1038/s41598-024-75548-1. Sci Rep. 2024. PMID: 39478015 Free PMC article.
References
-
- de la Varga‐Martínez O, Gutiérrez‐Bustillo R, Muñoz‐Moreno MF, López‐Herrero R, Gómez‐Sánchez E, Tamayo E. Postoperative delirium: an independent risk factor for poorer quality of life with long‐term cognitive and functional decline after cardiac surgery. J Clin Anesth. 2023;85:111030. - PubMed
-
- Olmos M, Hernandez NS, Kanter M, Liu P, Riesenburger RI, Kryzanski J. Periprocedural polypharmacy in lumbar fusions performed under spinal anesthesia compared with general anesthesia. Neurosurgery. 2023;92(3):632‐638. - PubMed
-
- Yin X, Liu B, Ding Y, et al. Total flavones of rhododendron induce the transformation of A1/A2 astrocytes via promoting the release of CBS‐produced H2S. Phytomedicine. 2023;111:154666. - PubMed
Publication types
MeSH terms
Substances
LinkOut - more resources
Full Text Sources
Miscellaneous
