. 2023 Nov;29(11):3549-3566.
doi: 10.1111/cns.14287. Epub 2023 Jun 2.

rTMS ameliorates depressive-like behaviors and regulates the gut microbiome and medium- and long-chain fatty acids in mice exposed to chronic unpredictable mild stress

Affiliations

rTMS ameliorates depressive-like behaviors and regulates the gut microbiome and medium- and long-chain fatty acids in mice exposed to chronic unpredictable mild stress

Cui-Hong Zhou et al. CNS Neurosci Ther. 2023 Nov.

Abstract

Introduction: Repetitive transcranial magnetic stimulation (rTMS) is a clinically useful therapy for depression. However, the effects of rTMS on the metabolism of fatty acids (FAs) and the composition of gut microbiota in depression are not well established.

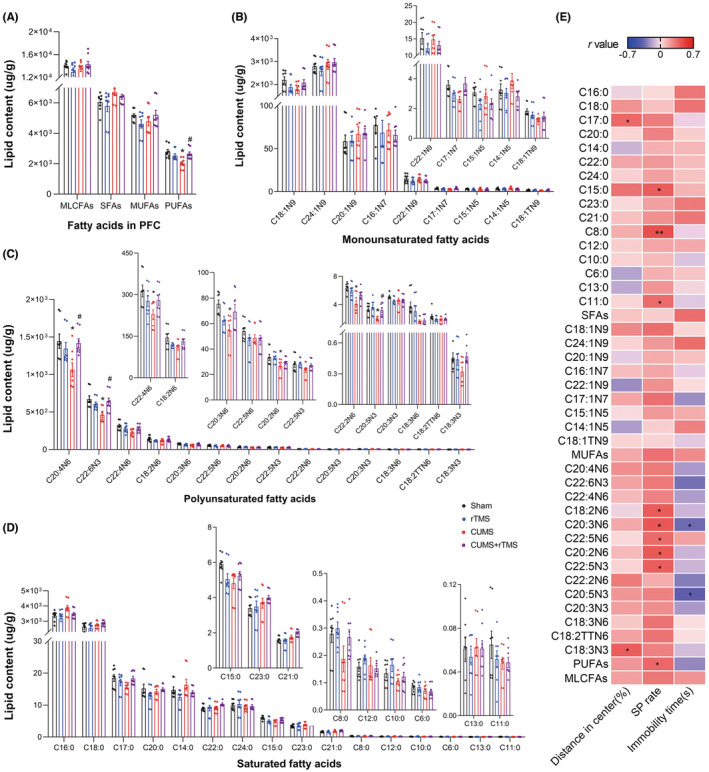
Methods: Mice received rTMS (15 Hz, 1.26 T) for seven consecutive days after exposure to chronic unpredictable mild stress (CUMS). The subsequent depressive-like behaviors, the composition of gut microbiota of stool samples, as well as medium- and long-chain fatty acids (MLCFAs) in the plasma, prefrontal cortex (PFC), and hippocampus (HPC) were evaluated.

Results: CUMS induced remarkable changes in gut microbiotas and fatty acids, specifically in community diversity of gut microbiotas and PUFAs in the brain. 15 Hz rTMS treatment alleviates depressive-like behaviors and partially normalized CUMS induced alterations of microbiotas and MLCFAs, especially the abundance of Cyanobacteria, Actinobacteriota, and levels of polyunsaturated fatty acids (PUFAs) in the hippocampus and PFC.

Conclusion: These findings revealed that the modulation of gut microbiotas and PUFAs metabolism might partly contribute to the antidepressant effect of rTMS.

Keywords: CUMS; gut microbiota; medium- and long-chain fatty acids; rTMS.


Conflict of interest statement

The authors have no conflicts of interest to declare.

Figures

FIGURE 1
FIGURE 1
rTMS ameliorates depressive‐like behaviors in CUMS treated mice. (A) The experimental design. After 1 week of acclimatization, mice were subjected to CUMS or maintained in their home cages for 4 weeks, then rTMS or Sham stimulation was administered for 7 days. Behavioral testing and fecal collection were performed after the last rTMS intervention (the training phase for sucrose preference test was initiated on day 41), then the peripheral blood and brain tissues were collected for medium‐ and long‐chain fatty acids measurements. (B) Representative real‐time movement traces in the OFT for each group. (C) Percentage of distance traveled in central zone in the OFT. (D) Quantification of the time spent in center of the OFT. (E) The percentage of sucrose consumption in the SPT. (F) Immobility time measured in the TST. The dot represents one value from individual mice (sham group: n = 18; rTMS group: n = 14; CUMS group: n = 12; CUMS + rTMS group: n = 12); rTMS, repetitive transcranial magnetic stimulation; CUMS, chronic unpredicted mild stress; SPT, sucrose preference test; OFT, the open field test; TST, tail suspension test. Data was analyzed with two‐way analysis of variance (ANOVA) followed by a Bonferroni post‐hoc test for pairwise comparisons and detailed statistical information is provided in Table S1.
FIGURE 2
FIGURE 2
Differential gut microbial characteristics in mice of each group (sham group: n = 18; rTMS group: n = 14; CUMS group: n = 12; CUMS + rTMS group: n = 12). (A) The number of common and unique OUTs among the four groups is displayed by the Venn diagram and histogram. (B–F) Alpha diversity analysis index, including the (B) observed species (H = 40.268, p < 0.001), (C) Ace index (H = 34.421, p < 0.001), (D) chao1 index (H = 38.750, p < 0.001), (E) Shannon index (H = 27.362, p < 0.001), and (F) Simpson index (H = 18.144, p < 0.001). (G–I) PCoA plots of bacterial beta‐diversity on the basis of (G) Bray curtis, (H) Unweighted UniFrac distance and (I) Weighted UniFrac distance. The circle represents one value from individual mice (B–F). rTMS, repetitive transcranial magnetic stimulation; CUMS, chronic unpredicted mild stress; OUT, Operational taxonomic unit; PCoA, Principal coordinates analysis. Nonparametric test (Kruskal‐Wallis) was used in B–F.
FIGURE 3
FIGURE 3
Differential taxonomic composition of gut microbiota in mice of each group (sham group: n = 18; rTMS group: n = 14; CUMS group: n = 12; CUMS + rTMS group: n = 12). (A) LDA score showed significant bacterial differences between these four groups based on the LEfSe and LDA analyses. (B) LDA score showed significant bacterial differences between the Sham and CUMS group. (C) LDA score showed significant bacterial differences between the CUMS and CUMS + rTMS groups. Only taxa with an LDA significance threshold >3.5 was presented. rTMS, repetitive transcranial magnetic stimulation; CUMS, chronic unpredicted mild stress; LDA, Linear discriminant analysis; LEfSe, Linear discriminant analysis effect size.
FIGURE 4
FIGURE 4
Correlation between depressive‐like behaviors and the differential gut microbiota and differences in gene function abundance between the four groups (sham group: n = 18; rTMS group: n = 14; CUMS group: n = 12; CUMS + rTMS group: n = 12). (A)The correlation between depressive‐like behaviors and the differential gut microbiota was analyzed at the genus level by Spearman's rank correlation coefficients, *p < 0.05; **p < 0.01, detailed statistical information is provided in Table S2. (B–G) the relative abundance of 6 KEGG pathways, (B) carbon metabolism, (C) citrate cycle (TCA cycle), (D) fatty acid metabolism, (E) fatty acid biosynthesis, (F) glycerophospholipid metabolism, and (G) phenylalanine, tyrosine, and tryptophan biosynthesis. The circle represents one value from individual mice. KEGG, Kyoto encyclopedia of genes and genomes; rTMS, repetitive transcranial magnetic stimulation; CUMS, chronic unpredicted mild stress; SP, sucrose preference. Two‐way analysis of variance (ANOVA) followed by a Bonferroni post‐hoc test for pairwise comparisons was used in date from B–G, detailed statistical information is provided in Table S3.
FIGURE 5
FIGURE 5
Groupwise alterations in the medium‐ and long‐chain fatty acid profiles in plasma. (A) Total MLCFAs, SFAs, MUFAs, and PUFAs concentration, (B) MUFA species, (C) PUFA species, (D) SFA species. (E) Analysis of correlations between depressive‐like behaviors and MLCFAs in plasma. The circle represents one value from individual mice (n = 8 in each group). MLCFAs, Medium‐ and long‐chain fatty acids; SFAs, Saturated fatty acids; MUFAs, Monounsaturated fatty acids; PUFAs, Polyunsaturated fatty acids; C8:0, Caprylic acid; C10:0, Capric acid; C11:0, Undecanoic acid; C12:0, Lauric acid; C13:0, Tritridecanoin; C14:0, Myristic acid; C15:0, Pentadecanoic acid; C16:0, Palmitic acid; C17:0, Heptadecanoic acid; C18:0, Stearic acid; C20:0, Arachidic acid; C21:0, Heneicosanoic acid; C22:0, Behenic acid; C23:0, Tricosanoic acid; C24:0, Lignoceric acid; C14:1N5, Myristoleic acid; C15:1N5, Pentadecenic acid; C16:1N7, Palmitoleic acid; C17:1N7, Margaric acid; 18:1N9, Oleic acid; C18:1TN9, Elaidic acid; C20:1N9, Eicosaenoic acid; C22:1N9, Erucic acid; C24:1N9, Nervonic acid; C18:2N6, Linoleic acid; C18:2TTN6, Linolelaidic acid; C20:2N6, Eicosatrienoic acid; C22:2N6, Docosadienoic acid; C18:3N6, Gamma‐linolenic acid; C18:3N3, α‐linolenic acid; C20:3N6, Gamma dihomo linoleic acid; C20:3N3, Eicosanotrienoic acid; C20:4N6, Arachidonic acid; C22:4N6, Docosatetraenoic acid; C22:5N6, Docosapentaenoic acid; C20:5N3, Eicosapentaenoic acid (EPA); C22:5N3, Docosa‐pentaenoic acid (DPA); C22:6N3, Docosahexaenoic acid (DHA); rTMS, repetitive transcranial magnetic stimulation; CUMS, chronic unpredicted mild stress; SP, sucrose preference. Two‐way analysis of variance (ANOVA) followed by a Bonferroni post‐hoc test for pairwise comparisons was used in (A‐D). *p < 0.05 vs. Sham; # p < 0.05 vs. CUMS; detailed statistical information is provided in Table S4; Pearson correlation was used in (E), *p < 0.05; **p < 0.01, detailed statistical information is provided in Table S5.
FIGURE 6
FIGURE 6
Groupwise alterations in the medium‐ and long‐chain fatty acid profiles in the hippocampus. (A) Total MLCFAs, SFAs, MUFAs, and PUFAs concentration, (B) MUFA species, (C) PUFA species, (D) SFA species. (E) Analysis of correlations between depressive‐like behaviors and MLCFAs in the hippocampus. The circle represents one value from individual mice (n = 8 in each group). MLCFAs, medium‐ and long‐chain fatty acids; SFAs, saturated fatty acids; MUFAs, monounsaturated fatty acids; PUFAs, polyunsaturated fatty acids; C6:0, Caproic acid; C8:0, Caprylic acid; C10:0, Capric acid; C11:0, Undecanoic acid; C12:0, Lauric acid; C13:0, Tritridecanoin; C14:0, Myristic acid; C15:0, Pentadecanoic acid; C16:0, Palmitic acid; C17:0, Heptadecanoic acid; C18:0, Stearic acid; C20:0, Arachidic acid; C21:0, Heneicosanoic acid; C22:0, Behenic acid; C23:0, Tricosanoic acid; C24:0, Lignoceric acid; C14:1N5, Myristoleic acid; C15:1N5, Pentadecenic acid; C16:1N7, Palmitoleic acid; C17:1N7, Margaric acid; 18:1N9, Oleic acid; C18:1TN9, Elaidic acid; C20:1N9, Eicosaenoic acid; C22:1N9, Erucic acid; C24:1N9, Nervonic acid; C18:2N6, Linoleic acid; C18:2TTN6, Linolelaidic acid; C20:2N6, Eicosatrienoic acid; C22:2N6, Docosadienoic acid; C18:3N6, Gamma‐linolenic acid; C18:3N3, α‐linolenic acid; C20:3N6, Gamma dihomo linoleic acid; C20:3N3, Eicosanotrienoic acid; C20:4N6, Arachidonic acid; C22:4N6, Docosatetraenoic acid; C22:5N6, Docosapentaenoic acid; C20:5N3, Eicosapentaenoic acid (EPA); C22:5N3, Docosa‐pentaenoic acid (DPA); C22:6N3, docosahexaenoic acid (DHA); rTMS, repetitive transcranial magnetic stimulation; CUMS, chronic unpredicted mild stress; SP, sucrose preference. Two‐way analysis of variance (ANOVA) followed by a Bonferroni post‐hoc test for pairwise comparisons was used in (A–D), detailed statistical information is provided in Table S6. Pearson correlation was used in (E), *p < 0.05; **p < 0.01, detailed statistical information is provided in Table S7.
FIGURE 7
FIGURE 7
Groupwise alterations in the medium‐ and long‐chain fatty acid profiles in prefrontal cortex. (A) Total MLCFAs, SFAs, MUFAs, and PUFAs concentration, (B) MUFA species, (C) PUFA species, (D) SFA species. (E) Analysis of correlations between depressive‐like behaviors and MLCFAs in the prefrontal cortex. The circle represents one value from individual mice (n = 8 in each group). MLCFAs, medium‐ and long‐chain fatty acids; SFA, saturated fatty acid; MUFA, monounsaturated fatty acids; PUFA, polyunsaturated fatty acids; C6:0, Caproic acid; C8:0, Caprylic acid; C10:0, Capric acid; C11:0, Undecanoic acid; C12:0, Lauric acid; C13:0, Tritridecanoin; C14:0, Myristic acid; C15:0, Pentadecanoic acid; C16:0, Palmitic acid; C17:0, Heptadecanoic acid; C18:0, Stearic acid; C20:0, Arachidic acid; C21:0, Heneicosanoic acid; C22:0, Behenic acid; C23:0, Tricosanoic acid; C24:0, Lignoceric acid; C14:1N5, Myristoleic acid; C15:1N5, Pentadecenic acid; C16:1N7, Palmitoleic acid; C17:1N7, Margaric acid; 18:1N9, Oleic acid; C18:1TN9, Elaidic acid; C20:1N9, Eicosaenoic acid; C22:1N9, Erucic acid; C24:1N9, Nervonic acid; C18:2N6, Linoleic acid; C18:2TTN6, linolelaidic acid; C20:2N6, Eicosatrienoic acid; C22:2N6, Docosadienoic acid; C18:3N6, Gamma‐linolenic acid; C18:3N3, α‐linolenic acid; C20:3N6, Gamma dihomo linoleic acid; C20:3N3, Eicosanotrienoic acid; C20:4N6, Arachidonic acid; C22:4N6, Docosatetraenoic acid; C22:5N6, Docosapentaenoic acid; C20:5N3, Eicosapentaenoic acid (EPA); C22:5N3, Docosa‐pentaenoic acid (DPA); C22:6N3, docosahexaenoic acid (DHA); rTMS, repetitive transcranial magnetic stimulation; CUMS, chronic unpredicted mild stress; SP, sucrose preference. Two‐way analysis of variance (ANOVA) followed by a Bonferroni post‐hoc test for pairwise comparisons was used in (A–D), detailed statistical information is provided in Table S8. Pearson correlation was used in (E), *p < 0.05; **p < 0.01, detailed statistical information is provided in Table S9.

Similar articles

Cited by

References

    1. Collaborators C‐MD. Global prevalence and burden of depressive and anxiety disorders in 204 countries and territories in 2020 due to the COVID‐19 pandemic. Lancet. 2021;398(10312):1700‐1712. - PMC - PubMed
    1. Zhang Y, Anoopkumar‐Dukie S, Davey AK. SIRT1 and SIRT2 modulators: potential anti‐inflammatory treatment for depression? Biomolecules. 2021;11(3):353. - PMC - PubMed
    1. Malhi GS, Mann JJ. Depression. Lancet. 2018;392(10161):2299‐2312. - PubMed
    1. Locher C, Koechlin H, Zion SR, et al. Efficacy and safety of selective serotonin reuptake inhibitors, serotonin‐norepinephrine reuptake inhibitors, and placebo for common psychiatric disorders among children and adolescents: a systematic review and meta‐analysis. JAMA Psychiat. 2017;74(10):1011‐1020. - PMC - PubMed
    1. Pu Y, Tan Y, Qu Y, et al. A role of the subdiaphragmatic vagus nerve in depression‐like phenotypes in mice after fecal microbiota transplantation from Chrna7 knock‐out mice with depression‐like phenotypes. Brain Behav Immun. 2021;94:318‐326. - PubMed

Publication types