. 2023 Oct;71(10):2323-2342.
doi: 10.1002/glia.24424. Epub 2023 Jun 3.

The expression of ceruloplasmin in astrocytes is essential for postnatal myelination and myelin maintenance in the adult brain

Affiliations

The expression of ceruloplasmin in astrocytes is essential for postnatal myelination and myelin maintenance in the adult brain

V T Cheli et al. Glia. 2023 Oct.

Abstract

Ceruloplasmin (Cp) is a ferroxidase enzyme that is essential for cell iron efflux. The absence of this protein in humans and rodents produces progressive neurodegeneration with brain iron accumulation. Astrocytes express high levels of Cp and iron efflux from these cells has been shown to be central for oligodendrocyte maturation and myelination. To explore the role of astrocytic Cp in brain development and aging we generated a specific conditional KO mouse for Cp in astrocytes (Cp cKO). Deletion of Cp in astrocytes during the first postnatal week induced hypomyelination and a significant delay in oligodendrocyte maturation. This abnormal myelin synthesis was exacerbated throughout the first two postnatal months and accompanied by a reduction in oligodendrocyte iron content, as well as an increase in brain oxidative stress. In contrast to young animals, deletion of astrocytic Cp at 8 months of age engendered iron accumulation in several brain areas and neurodegeneration in cortical regions. Aged Cp cKO mice also showed myelin loss and oxidative stress in oligodendrocytes and neurons, and at 18 months of age, developed abnormal behavioral profiles, including deficits in locomotion and short-term memory. In summary, our results demonstrate that iron efflux-mediated by astrocytic Cp-is essential for both early oligodendrocyte maturation and myelin integrity in the mature brain. Additionally, our data suggest that astrocytic Cp activity is central to prevent iron accumulation and iron-induced oxidative stress in the aging CNS.

Keywords: astrocytes; ceruloplasmin; iron; myelination; oligodendrocytes.


Conflict of interest statement

Conflict of interest statement: The authors declare no competing financial interests.

Figures

FIGURE 1:
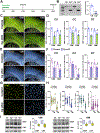
FIGURE 1:. Recombination efficacy in the postnatal Cp cKO mouse.
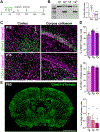
(A) Cp cKO mice and control (Cre-negative) littermates received five consecutive tamoxifen injections and brain tissue was collected at P15, P30, and P60. (B) Semi-quantitative RT-PCR for Cp was performed at P15 with RNA isolated from the brain cortex. Six independent samples per condition were analyzed and Cp mRNA were normalized to GAPDH. Values are expressed as fold change of control values ± SEM. ***p<0.001 vs. controls. Each dot represents the mean of one independent sample. (C) GFAP and CD31 immunostaining in the cortex and corpus callosum of Glast1-dTomato mice at P15. Scale bar = 90μm upper panel, 45μm lower panel. (D) Percentage of GFAP/ and Olig2/dTomato double-positive cells and overlap between CD31 and dTomato in the somatosensory cortex (CX), lateral corpus callosum (CC), and striatum (ST). (E) Distribution of Glast1-dTomato-positive cells in a coronal brain slice at P60.
FIGURE 2:
FIGURE 2:. Myelin proteins synthesis in the postnatal Cp cKO mouse.
(A and C) MBP and PLP immunostaining in Cp cKO brains at P15, P30, and P60. Scale bar = 180 μm. (B and D) Integrated fluorescence intensity for MBP and PLP in the cortex (CX) and lateral corpus callosum (CC). Data represent pooled results from at least 4 brains per experimental group and values are expressed as percentage of P15 controls ± SEM. Each dot denotes the mean of one subject. *p<0.05, ***p<0.001 versus respective controls. (E) Western blots for MBP, CNP, PLP and MOG in the corpus callosum of Cp cKO animals at P15. P84 and β-actin were used as internal standards and box-and-whisker plots are showing means ± SD from four independent experiments. **p<0.01, ***p<0.001 versus respective controls.
FIGURE 3:
FIGURE 3:. Electron microscopy of the Cp cKO corpus callosum.
(A) Electron micrographs of axons in the corpus callosum of Cp cKO mice at P15, P30 and P60. Scale bar = 8μm upper panel; 2μm lower panel. (B) Scatter plot of g-ratio values of myelinated axons. (C) Mean g-ratio values of myelinated axons for the same experimental conditions. (D) Mean axonal diameter of myelinated axons. (E) Percentage of myelinated axons. Four animals per experimental group and 200 fibers per mouse were analyzed. Values are expressed as mean ± SEM. ***p<0.001 versus control. In (C) and (E) each dot represents the mean of one subject.
FIGURE 4:
FIGURE 4:. Decreased number of mature oligodendrocytes in the Cp cKO CNS.
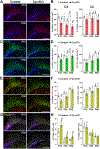
(A, C and E) Coronal brain sections immunostained for Olig2 and CC1 at P15 and P30. Scale bar = 180μm. (B, D and F) The number of Olig2 and CC1-positive cells and the percentage of Olig2/CC1 double-positive cells were quantified in the cortex (CX) and lateral corpus callosum (CC) at P15, P30 and P60. Data represent pooled results from at least 4 brains per experimental group and values are expressed as mean ± SEM. *p<0.05, ***p<0.001 vs. respective controls. Each dot represents the mean of one subject. (G) Brain sections immunostained for Olig2 and Ki67 at P15 and P30. Scale bar = 90μm. (H) Olig2/Ki67 double-positive cells were quantified in the cortex (CX) and lateral corpus callosum (CC) at P15, P30 and P60. Data represent pooled results from at least 4 brains per experimental group and values are expressed as mean ± SEM. ***p<0.001 vs. respective controls. Each dot denotes the mean of one subject.
FIGURE 5:
FIGURE 5:. Astrocytes numbers in Cp cKO animals.
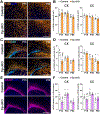
(A, C and E) Coronal brain sections immunostained for s100β, Ki67, and GFAP at P15 and P30. Scale bar = 90μm, A and C; 180μm, E. (B, D and F) s100β and GFAP-positive cells, and s100β/Ki67-double positive cells were quantified in the cortex (CX) and lateral corpus callosum (CC) at P15, P30 and P60. Data represent pooled results from at least 4 brains per experimental group and values are expressed as mean ± SEM. **p<0.01, ***p<0.001 vs. respective controls. Each dot denotes the mean of one subject.
FIGURE 6:
FIGURE 6:. Perls’ staining in the Cp cKO mice.
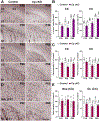
(A) Perls’ staining in coronal brain sections from control and Cp cKO mice at P30 and P60. Scale bar = 180μm upper panel, 90μm lower panel. (B and C) Number of Perls’ positive cells and average intensity staining in the cortex (CX) and lateral corpus callosum (CC) at P15, P30 and P60. (D and E) Average Perls’ staining intensity in cortical neurons (Neu CX) and callosal oligodendrocytes (OL CC) at P15, P30 and P60. Scale bar = 45μm. Data represent pooled results from at least 4 brains per experimental group and values are expressed as mean ± SEM. **p<0.01, ***p<0.001 vs. respective controls. Each dot denotes the mean of one subject.
FIGURE 7:
FIGURE 7:. Neuronal densities and oxidative stress in young Cp cKO brains.
(A) Brain coronal sections from control and Cp cKO brains immunostained for NeuN, 8-OHdG, GFAP, and Olig2 at P60. Scale bar = 180μm upper panels; 90μm lower panels. (B) Cortical thickness, total number of NeuN-positive cells, and integrated fluorescence intensity of neurofilament M in the cortex (CX) at P15, P30 and P60. (C) Integrated fluorescence intensity of 8-OHdG in the cortex (CX), lateral corpus callosum (CC), and striatum (ST) at P15, P30 and P60. (D) Integrated 8-OHdG fluorescence intensity in cortical NeuN-, Olig2-, and GFAP-positive cells. (E) qPCRs for superoxide dismutase (SOD), glutathione peroxidase (GPX) and heme oxygenase-1 (HO-1) were performed at P60 with RNA isolated from the cortex of Cp cKO mice. GAPDH and TBP were used as internal standards and values are expressed as fold change of control values ± SEM. Each dot represents the mean of one independent sample. (F) NeuN/, Olig2/, and GFAP/active caspase-3 double-positive cells in the cortex (CX) at P15, P30 and P60. Data represent pooled results from at least 4 brains per experimental group and values are expressed as mean ± SEM. *p<0.05, **p<0.01, ***p<0.001 vs. respective controls. Each dot denotes the mean of one subject.
FIGURE 8:
FIGURE 8:. Myelin proteins and oligodendrocyte numbers in aged Cp cKO mouse.
(A) At 8 months of age Cp cKO mice and control (Cre-negative) littermates received seven tamoxifen injections and brain tissue was collected at 12 and 18 months. (B) Semi-quantitative RT-PCR for Cp was performed at 12 months with RNA isolated from the brain cortex. Six independent samples per condition were analyzed and Cp mRNA were normalized to GAPDH. Values are expressed as fold change of control values ± SEM. ***p<0.001 vs. controls. Each dot represents the mean of one independent sample. (C and E) MBP and PLP immunostaining in the brain of control and Cp cKO mice at 12 and 18 months. Scale bar = 180μm. (D and F) Integrated fluorescence intensity for MBP and PLP in the cortex (CX), lateral corpus callosum (CC), and striatum (ST) at 12 and 18 months. (G) Cortical sections from control and Cp cKO mice immunostained for Olig2 and CC1 at 18 months. Scale bar = 90μm. (H) Olig2 and CC1-positive cells and percentage of Olig2/CC1 and Olig2/Ki67 double-positive cells in the cortex (CX) at 12 and 18 months. Data represent pooled results from at least 4 brains per experimental group and values are expressed as mean ± SEM. *p<0.05, **p<0.01, ***p<0.001 vs. respective controls. Each dot denotes the mean of one subject. (I) Western blots for MBP and CNP in the corpus callosum of Cp cKO animals at 12 and 18 months. P84 was used as the internal standard and box-and-whisker plots are showing means ± SD from four independent experiments. *p<0.05 vs. respective controls.
FIGURE 9:
FIGURE 9:. Electron microscopy and iron staining in old Cp cKO animals.
(A) Electron micrographs of axons in the corpus callosum of Cp cKO mice at 18 months. Scale bar = 8μm left panel; 2μm right panel. (B) Mean g-ratio values of myelinated axons, percentage of myelinated axons, and scatter plot of g-ratio values in control and Cp cKO mice at 18 months. (C) Asterisk denotes examples of degenerative axons in the corpus callosum of controls and Cp cKO mice at 18 months of age. Scale bar = 8μm. (D) Mean axonal diameter of myelinated axons, percentage of axons with signs of active degeneration, and proportion of axons with abnormal myelin. Four animals per experimental group and 1000 fibers per mouse were analyzed. Values are expressed as mean ± SEM. **p<0.01, ***p<0.001 versus control. Dots in bar graphs represent the mean of one subject. (E) Perls’ staining in brain sections of control and Cp cKO mice at 18 months. Scale bar = 180μm left panel, 90μm right panel. (F) Number of Perls’ positive cells and Perls’ intensity staining in the cortex (CX) and lateral corpus callosum (CC) at 18 months. (G and H) Average Perls’ staining intensity in cortical neurons (Neu CX) and callosal oligodendrocytes (OL CC) at 18 months. Scale bar = 45μm. (I) Perls’ intensity staining in the striatum (ST) and substantia nigra (SN) at 18 months. Data represent pooled results from at least 4 brains per experimental group and values are expressed as mean ± SEM. **p<0.01, ***p<0.001 vs. respective controls. Each dot denotes the mean of one subject.
FIGURE 10:
FIGURE 10:. Neurodegeneration and oxidative stress in aged Cp cKO brains.
(A) Brain coronal sections from control and Cp cKO brains immunostained for NeuN, 8-OhdG and GFAP at 18 months. Scale bar = 180μm upper panels; 90μm lower panels. (B) Cortical thickness, total number of NeuN-positive cells, and integrated fluorescence intensity of neurofilament M in the cortex (CX) at 12 and 18 months. (C) Integrated fluorescence intensity of 8-OHdG in the cortex (CX), lateral corpus callosum (CC), and striatum (ST). (D) Integrated 8-OHdG fluorescence intensity in cortical NeuN-, Olig2-, and GFAP-positive cells. (E) qPCRs for superoxide dismutase (SOD), glutathione peroxidase (GPX) and heme oxygenase-1 (HO-1) were performed at 18 months with RNA isolated from the cortex of Cp cKO mice. GAPDH and TBP were used as internal standards and values are expressed as fold change of control values ± SEM. ***p<0.001 vs. controls. Each dot represents the mean of one independent sample. (F) NeuN/, Olig2/, and GFAP/active caspase-3 double-positive cells in the cortex (CX). Data represent pooled results from at least 4 brains per experimental group and values are expressed as mean ± SEM. **p<0.01, ***p<0.001 vs. respective controls. Each dot denotes the mean of one subject.
FIGURE 11:
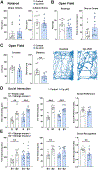
FIGURE 11:. Behavioral analysis of aged Cp cKO mice.
(A) Controls and Cp cKO mice were tested in the rotarod apparatus using two different settings: constant speed (20rpm) and acceleration (4–40rpm). (B and C) Rearings, time in the center, crosses and total travel distance were determined in 18 months-old controls and Cp cKO mice in the open field test. (D) Social interaction in control and Cp cKO mice at 18 months. The amount of time interacting with an empty chamber (E) and the chamber containing an unfamiliar mouse (S1) was measured for 10min to estimate the social preference index S1/(S1+E). (E) The time spent interacting with the unfamiliar mouse 1 (S1′) and the unfamiliar mouse 2 (S2) was measured in a second session for determination of the social recognition index S2/(S2+S1′). All behavioral analyses were performed in 10 mice per experimental group (5 males and 5 females) and values are expressed as mean ± SEM. **p<0.01, ***p<0.001 vs. respective controls. Dots in bar graphs represent the mean of one subject.

Similar articles

Cited by

References

    1. Abbott NJ, Rönnbäck L, Hansson E (2006). Astrocyte-endothelial interactions at the blood-brain barrier. Nat Rev Neurosci 7: 41–53. - PubMed
    1. Amiry-Moghaddam M, Otsuka T, Hurn PD, Traystman RJ, Haug FM, Froehner SC, Adams ME, Neely JD, Agre P, Ottersen OP, Bhardwaj A (2003). An alphasyntrophin-dependent pool of AQP4 in astroglial end-feet confers bidirectional water flow between blood and brain. Proc Natl Acad Sci USA 100: 2106–2111. - PMC - PubMed
    1. Ayton S, Lei P, Adlard PA, Volitakis I, Cherny RA, Bush AI, Finkelstein DI (2014). Iron accumulation confers neurotoxicity to a vulnerable population of nigral neurons: implications for Parkinson’s disease. Mol Neurodegener 9: 27. - PMC - PubMed
    1. Ayton S, Lei P, Bush AI (2013a). Metallostasis in Alzheimer’s disease. Free Radic Biol Med 62: 76–89. - PubMed
    1. Ayton S, Lei P, Duce JA, Wong BX, Sedjahtera A, Adlard PA, Bush AI, Finkelstein DI (2013b). Ceruloplasmin dysfunction and therapeutic potential for Parkinson disease. Ann Neurol 73: 554–559. - PubMed

Publication types

LinkOut - more resources