

A novel prognostic model based on immunogenic cell death-related genes for improved risk stratification in hepatocellular carcinoma patients
- PMID: 37269346
- PMCID: PMC11798148
- DOI: 10.1007/s00432-023-04950-5
A novel prognostic model based on immunogenic cell death-related genes for improved risk stratification in hepatocellular carcinoma patients
Abstract
Purpose: Hepatocellular carcinoma (HCC) is a prevalent primary malignant tumor with increasing incidence and mortality rates in recent years. The treatment options for advanced HCC are very limited. Immunogenic cell death (ICD) plays an important role in cancer, in particular immunotherapy. However, the specific ICD genes and their prognostic values in HCC remain to be investigated.
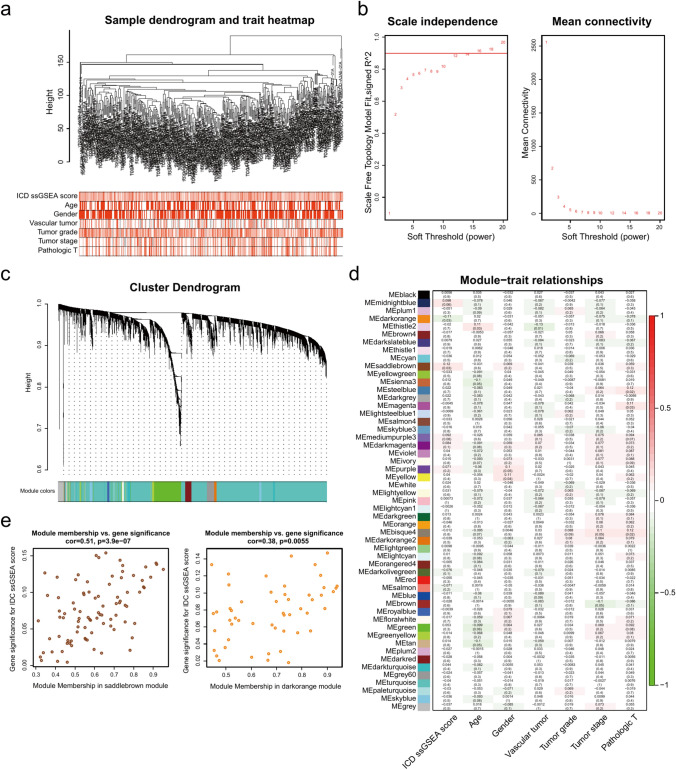
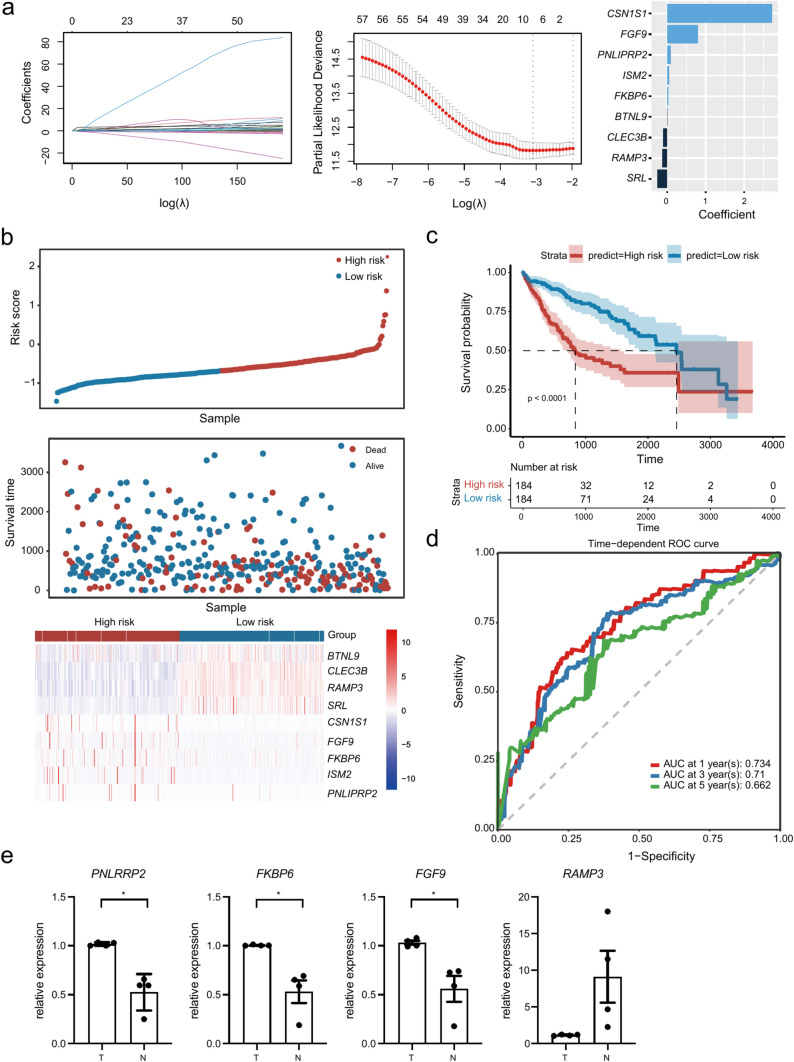
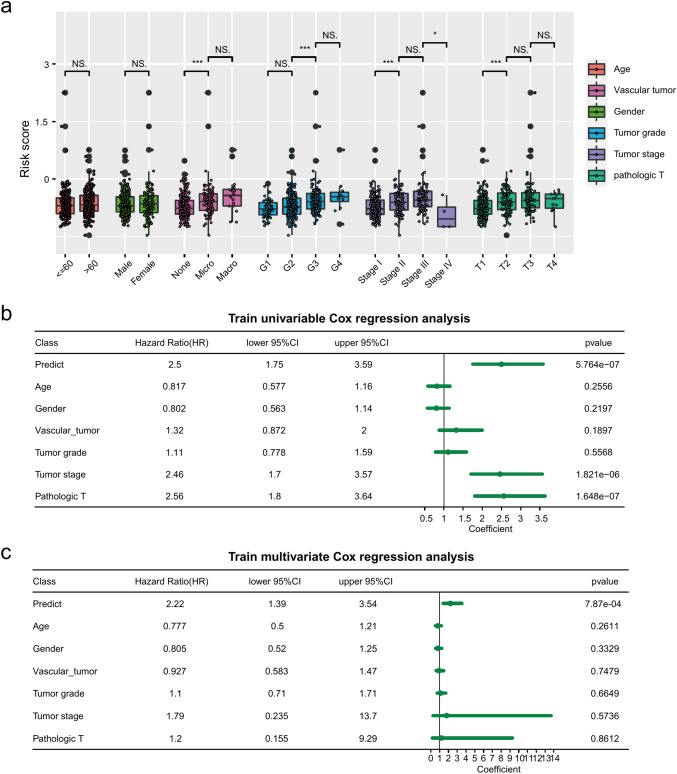
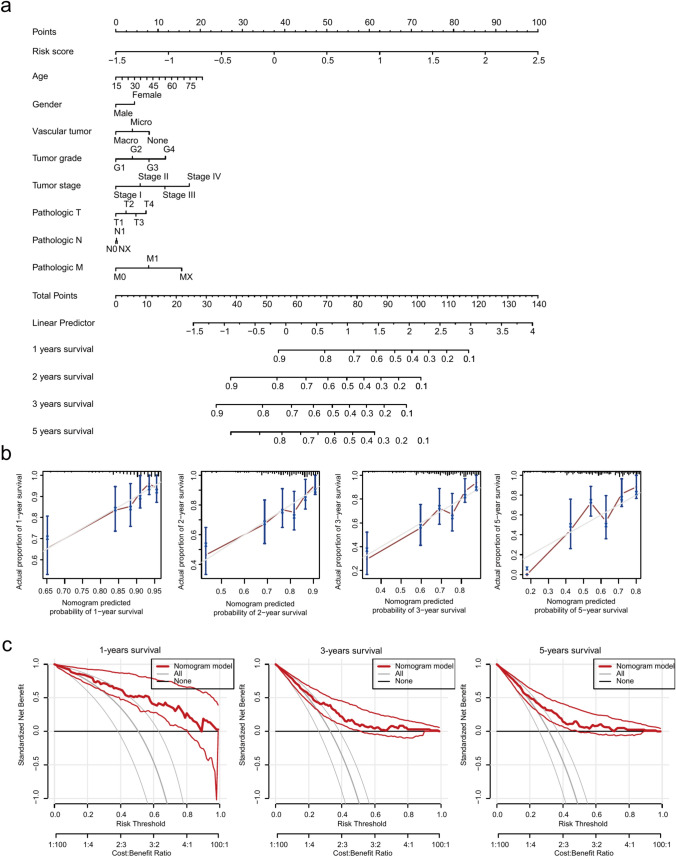
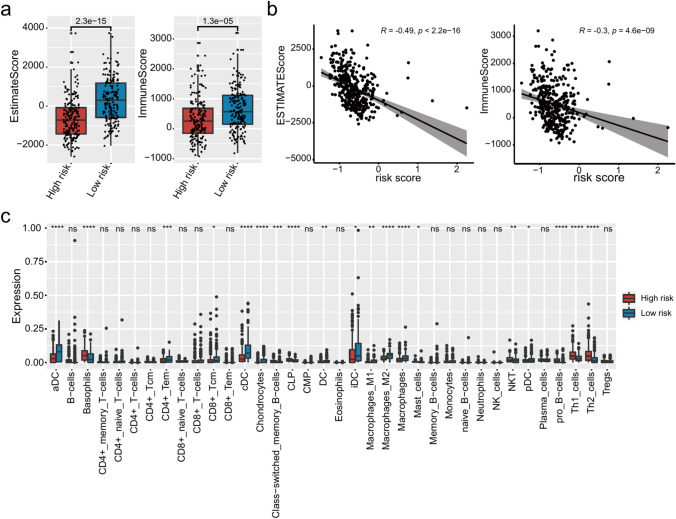
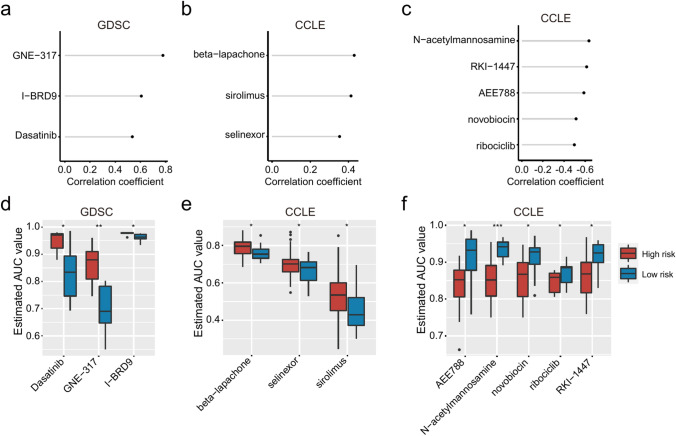
Methods: The TCGA-LIHC datasets were obtained from TCGA database, LIRI-JP datasets were obtained from ICGC database, and immunogenic cell death (ICD) genes datasets were obtained from previous literature. WGCNA analysis identifies ICD-related genes. Functional analysis was used to investigate the biological characteristics of ICD-related genes. Univariate Cox analysis and least absolute shrinkage and selection operator (LASSO) Cox regression analysis was used to select prognostic ICD-related genes and construct a prognostic risk score. Prognostic independence of ICD risk scores was determined by univariate and multivariate Cox regression analyses. A nomogram was then constructed and the diagnostic value was assessed using decision curve analysis. Immune infiltration analysis and drug sensitivity analysis were used to investigate immune cell enrichment and drug response in HCC patients classified as low or high risk based on their risk score.
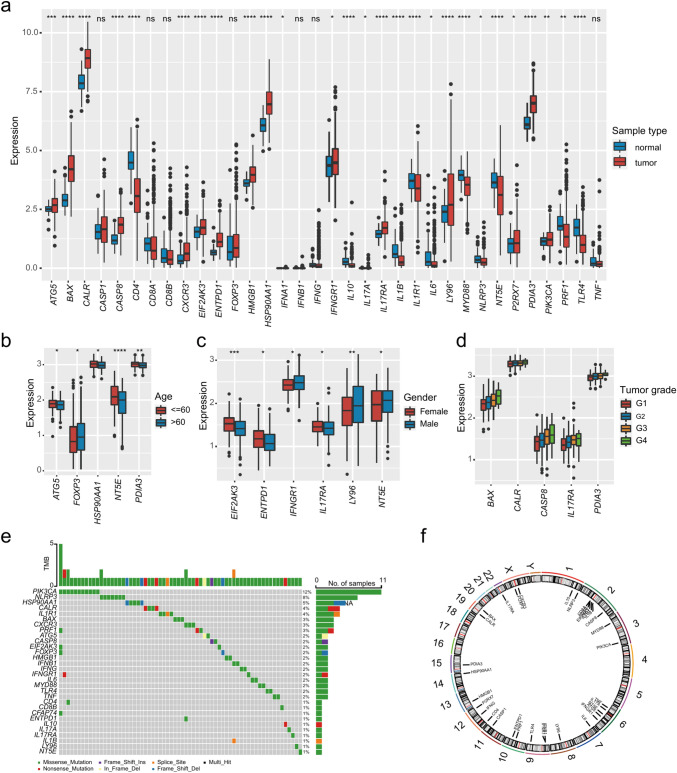
Results: Most of the ICD genes were differentially expressed in normal and HCC patients, and some ICD genes were differentially expressed in different clinical groups. A total of 185 ICD-related genes were identified by WGCNA. Prognostic ICD-related genes were selected using a univariate Cox analysis. A model comprising nine prognosis ICD-related gene biomarkers was developed. Patients was divided into high-risk and low-risk groups, and patients in high-risk groups had poorer outcomes. Meanwhile, the reliability of the model was verified by external independent data. The Independent prognostic value of the risk score in HCC was investigated by univariate and multivariate Cox analyses. Diagnostic nomogram was constructed to predict prognosis. Through immune infiltration analysis, we found that some innate and adaptive immune cells were significantly different between low- and high-risk groups.
Conclusion: We developed and validated a novel prognostic predictive classification system for HCC based on nine ICD-related genes. In addition, immune-related predictions and model could help predict the outcomes of HCC and could provide a reference for clinical practice.
Keywords: Hepatocellular carcinoma; Immunogenic cell death; LASSO; Prognosis; WGCNA.
© 2023. The Author(s), under exclusive licence to Springer-Verlag GmbH Germany, part of Springer Nature.
Conflict of interest statement
The authors declare that they have no competing interests.
Figures
Similar articles
-
A novel immunogenic cell death-related genes signature for predicting prognosis, immune landscape and immunotherapy effect in hepatocellular carcinoma.J Cancer Res Clin Oncol. 2023 Dec;149(18):16261-16277. doi: 10.1007/s00432-023-05370-1. Epub 2023 Sep 12. J Cancer Res Clin Oncol. 2023. PMID: 37698679 Free PMC article.
-
Prognostic and Immunological Significance of the Molecular Subtypes and Risk Signatures Based on Cuproptosis in Hepatocellular Carcinoma.Mediators Inflamm. 2023 Apr 20;2023:3951940. doi: 10.1155/2023/3951940. eCollection 2023. Mediators Inflamm. 2023. PMID: 37124062 Free PMC article.
-
A novel prognostic signature based on immunogenic cell death score predicts outcomes and response to transcatheter arterial chemoembolization and immunotherapy in hepatocellular carcinoma.J Cancer Res Clin Oncol. 2023 Oct;149(13):11411-11429. doi: 10.1007/s00432-023-05017-1. Epub 2023 Jun 29. J Cancer Res Clin Oncol. 2023. PMID: 37382674 Free PMC article.
-
Cost-effectiveness of using prognostic information to select women with breast cancer for adjuvant systemic therapy.Health Technol Assess. 2006 Sep;10(34):iii-iv, ix-xi, 1-204. doi: 10.3310/hta10340. Health Technol Assess. 2006. PMID: 16959170
-
Impact of residual disease as a prognostic factor for survival in women with advanced epithelial ovarian cancer after primary surgery.Cochrane Database Syst Rev. 2022 Sep 26;9(9):CD015048. doi: 10.1002/14651858.CD015048.pub2. Cochrane Database Syst Rev. 2022. PMID: 36161421 Free PMC article.
Cited by
-
Bibliometric analysis of programmed cell death and immunogenic cell death in hepatocellular carcinoma immunotherapy: global trends and future directions.Discov Oncol. 2025 Jul 1;16(1):1208. doi: 10.1007/s12672-025-02278-9. Discov Oncol. 2025. PMID: 40591134 Free PMC article.
-
Gene signature developed based on programmed cell death to predict the therapeutic response and prognosis for liver hepatocellular carcinoma.Heliyon. 2024 Jul 18;10(14):e34704. doi: 10.1016/j.heliyon.2024.e34704. eCollection 2024 Jul 30. Heliyon. 2024. PMID: 39130419 Free PMC article.
References
-
- Bray F et al (2018) Global cancer statistics 2018: GLOBOCAN estimates of incidence and mortality worldwide for 36 cancers in 185 countries. CA Cancer J Clin 68:394–424. 10.3322/caac.21492 - PubMed
-
- DeNardo DG et al (2011) Leukocyte complexity predicts breast cancer survival and functionally regulates response to chemotherapy. Cancer Discov 1:54–67. 10.1158/2159-8274.CD-10-0028 - PMC - PubMed
MeSH terms
Grants and funding
LinkOut - more resources
Full Text Sources
Medical
