

Sequence Divergence in Venom Genes Within and Between Montane Pitviper (Viperidae: Crotalinae: Cerrophidion) Species is Driven by Mutation-Drift Equilibrium
- PMID: 37269364
- PMCID: PMC10995822
- DOI: 10.1007/s00239-023-10115-2
Sequence Divergence in Venom Genes Within and Between Montane Pitviper (Viperidae: Crotalinae: Cerrophidion) Species is Driven by Mutation-Drift Equilibrium
Erratum in
-
Correction: Sequence Divergence in Venom Genes Within and Between Montane Pitviper (Viperidae: Crotalinae: Cerrophidion) Species is Driven by Mutation-Drift Equilibrium.J Mol Evol. 2025 Apr;93(2):292. doi: 10.1007/s00239-025-10239-7. J Mol Evol. 2025. PMID: 40035856 No abstract available.
Abstract
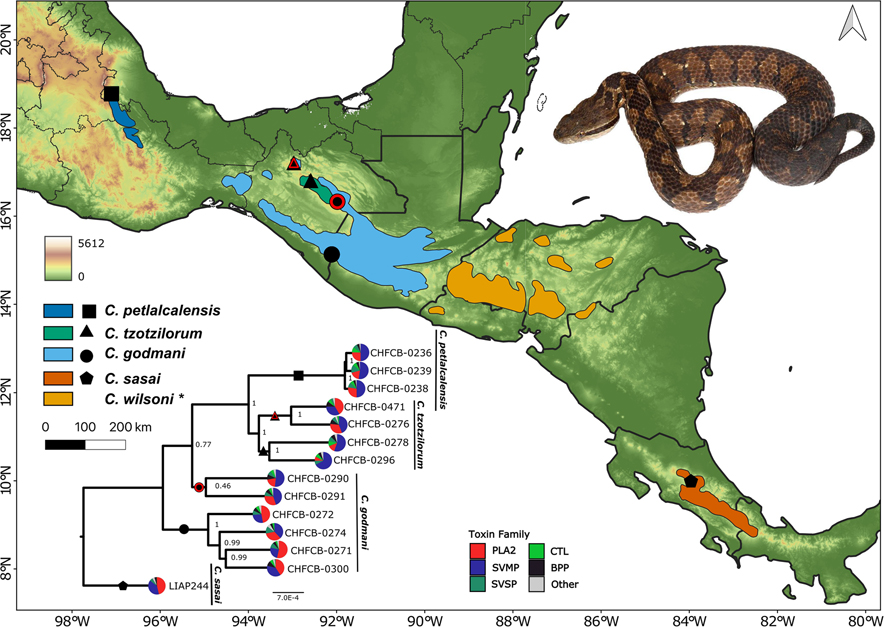
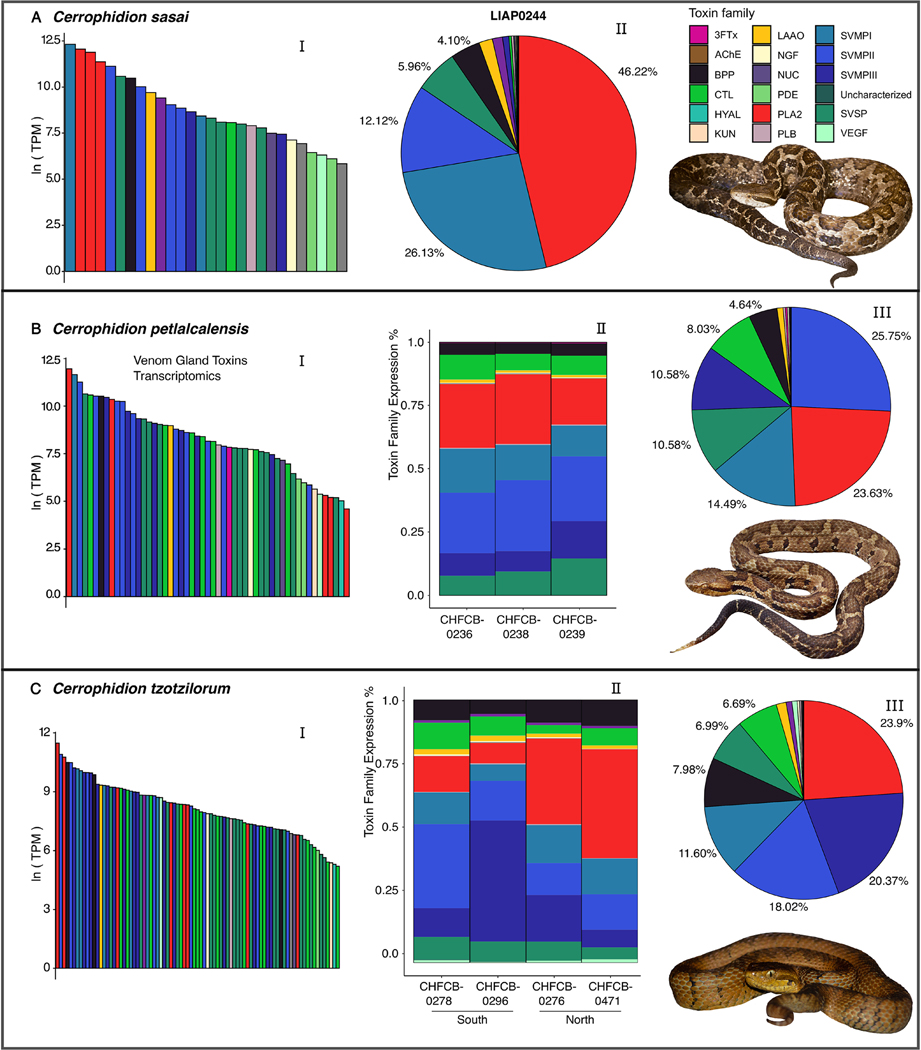
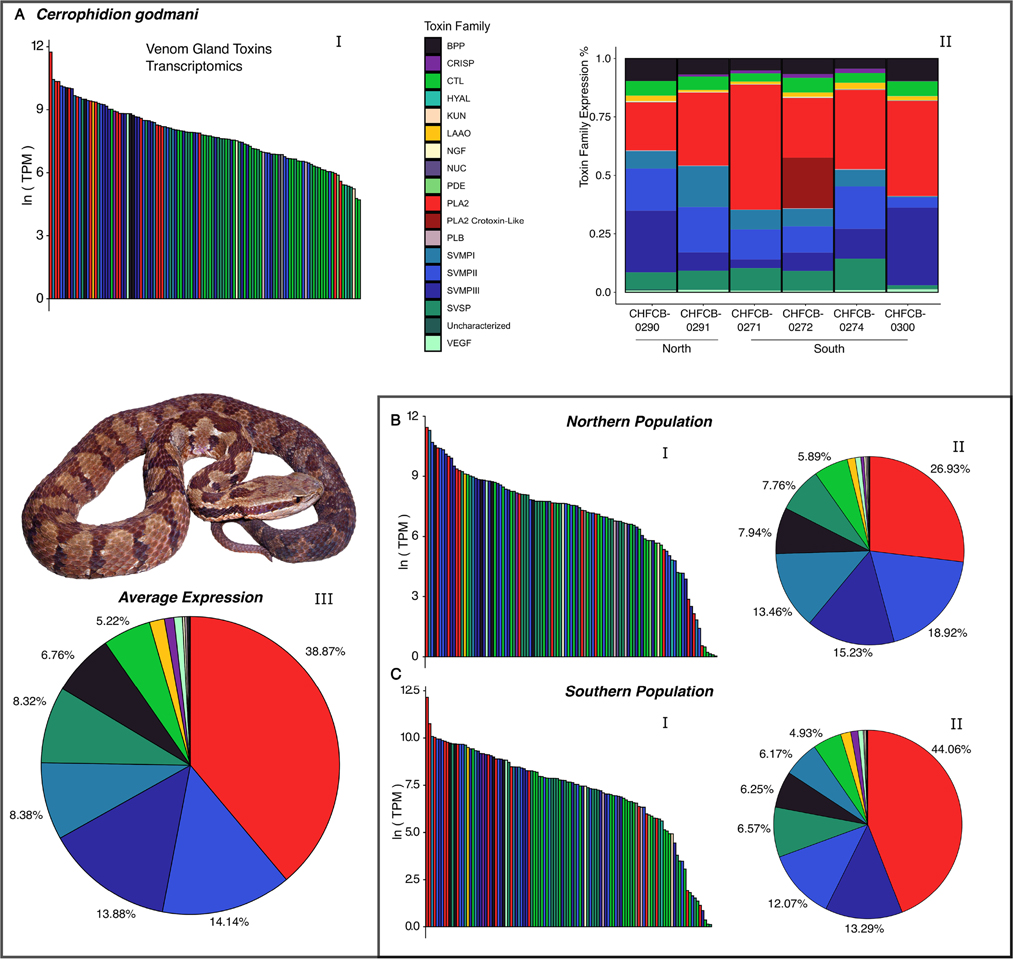
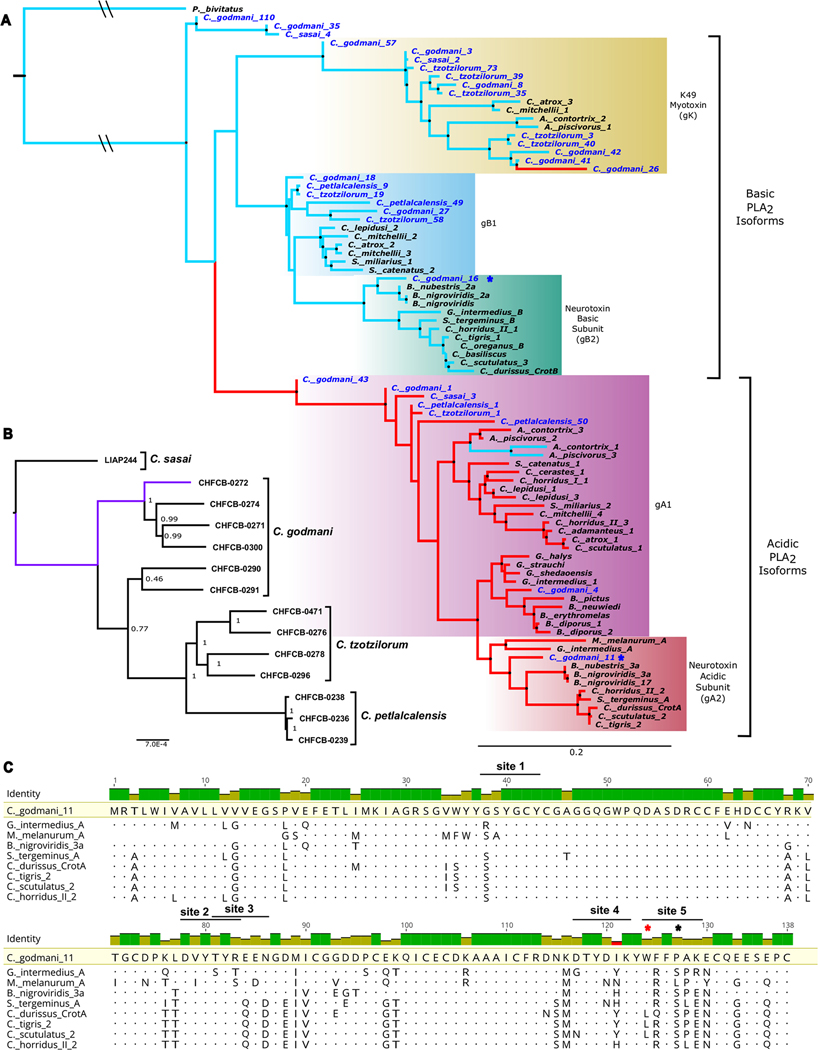
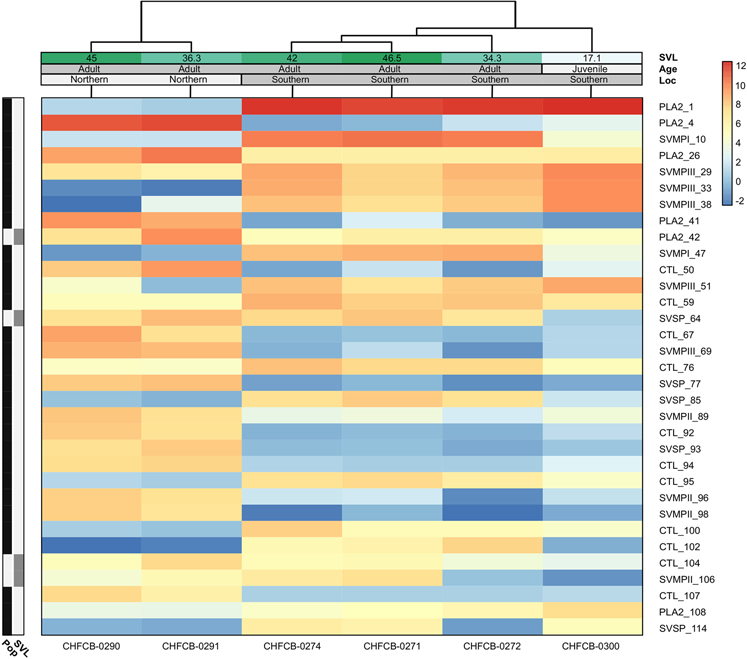
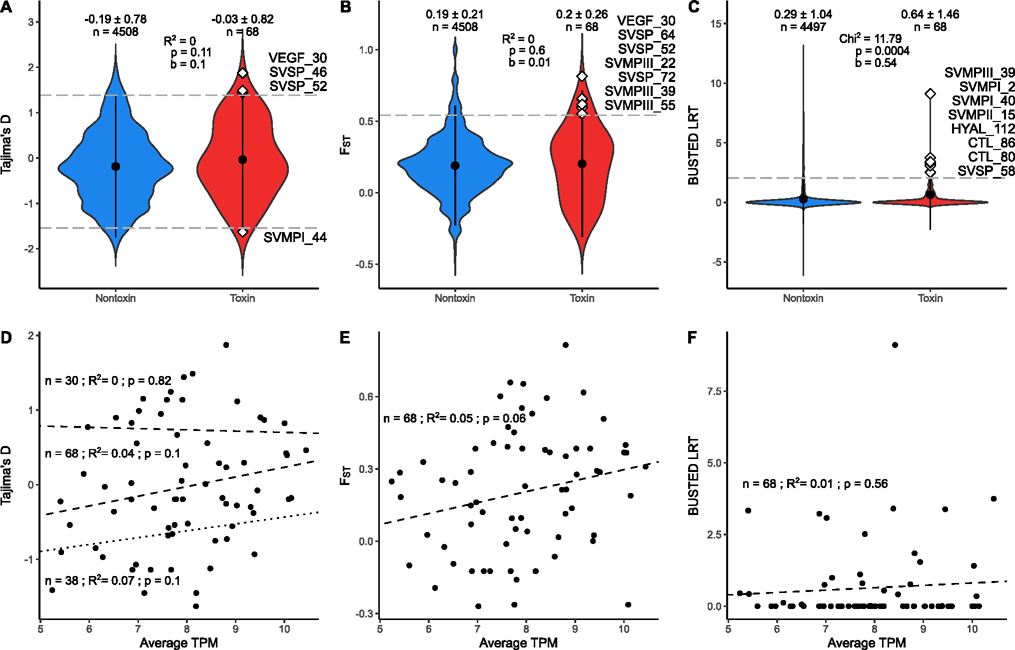
Snake venom can vary both among and within species. While some groups of New World pitvipers-such as rattlesnakes-have been well studied, very little is known about the venom of montane pitvipers (Cerrophidion) found across the Mesoamerican highlands. Compared to most well-studied rattlesnakes, which are widely distributed, the isolated montane populations of Cerrophidion may facilitate unique evolutionary trajectories and venom differentiation. Here, we describe the venom gland transcriptomes for populations of C. petlalcalensis, C. tzotzilorum, and C. godmani from Mexico, and a single individual of C. sasai from Costa Rica. We explore gene expression variation in Cerrophidion and sequence evolution of toxins within C. godmani specifically. Cerrophidion venom gland transcriptomes are composed primarily of snake venom metalloproteinases, phospholipase A[Formula: see text]s (PLA[Formula: see text]s), and snake venom serine proteases. Cerrophidion petlalcalensis shows little intraspecific variation; however, C. godmani and C. tzotzilorum differ significantly between geographically isolated populations. Interestingly, intraspecific variation was mostly attributed to expression variation as we did not detect signals of selection within C. godmani toxins. Additionally, we found PLA[Formula: see text]-like myotoxins in all species except C. petlalcalensis, and crotoxin-like PLA[Formula: see text]s in the southern population of C. godmani. Our results demonstrate significant intraspecific venom variation within C. godmani and C. tzotzilorum. The toxins of C. godmani show little evidence of directional selection where variation in toxin sequence is consistent with evolution under a model of mutation-drift equilibrium. Cerrophidion godmani individuals from the southern population may exhibit neurotoxic venom activity given the presence of crotoxin-like PLA[Formula: see text]s; however, further research is required to confirm this hypothesis.
El veneno de las serpientes puede variar entre y dentro de las especies. Mientras algunos grupos de viperidos del Nuevo Mundo—como las cascabeles—han sido bien estudiadas, muy poco se sabe acerca del veneno de las nauyacas de frío (Cerrophidion) que se encuentran en las zonas altas de Mesoamérica. Comparadas con las extensamente estudiadas cascabeles, que estan ampliamente distribuidas, las poblaciones de Cerrophidion, aisladas en montañas, pueden poseer trayectorias evolutivas y diferenciación en su veneno unicos. En el presente trabajo, describimos el transcriptoma de las glándulas de veneno de poblaciones de C. petlalcalensis, C. tzotzilorum, y C. godmani de México, y un individuo de C. sasai de Costa Rica. Exploramos la variación en la expresión de toxinas en Cerrophidion y la evolución en las secuencias geneticas en C. godmani específicamente. El transcriptoma de la glándula de veneno de Cerrophidion esta compuesto principalmente de Metaloproteinasas de Veneno de Serpiente, Fosfolipasas A (PLA s), y Serin Proteasas de Veneno de Serpiente. Cerrophidion petlalcalensis presenta poca variación intraespecífica; sin embargo, los transcriptomas de la glandula de veneno de C. godmani y C. tzotzilorum difieren significativamente entre poblaciones geográficamente aisladas. Curiosamente, la variación intraespecífica estuvo atribuida principalmente a la expresión de las toxinas ya que no encontramos señales de selección en las toxinas de C. godmani. Adicionalmente, encontramos miotoxinas similares a PLA en todas las especies excepto C. petlalcalensis, y PLA s similares a crotoxina en la población sureña de C. godmani. Nuestros resultados demuestran la presencia de variacion intraespecífica presente en el veneno de C. godmani y C. tzotzilorum. Las toxinas de Cerrophidion godmani muestran poca evidencia de selección direccional, y la variación en la secuencias de las toxinas es consistente con evolucion bajo un modelo de equilibrio de mutación-deriva. Algunos individuos de C. godmani de la población del sur potencialmente tienen un veneno neurotóxico dada la presencia de PLA s similares a la crotoxina, sin embargo, se necesita más evidencia para corroborar esta hipótesis.
Keywords: Gene family evolution; Mutation–drift equilibrium; Selection; Transcriptomics.
© 2023. The Author(s), under exclusive licence to Springer Science+Business Media, LLC, part of Springer Nature.
Conflict of interest statement
Figures
Similar articles
-
Snake venomics of the pit vipers Porthidium nasutum, Porthidium ophryomegas, and Cerrophidion godmani from Costa Rica: toxicological and taxonomical insights.J Proteomics. 2012 Feb 16;75(5):1675-89. doi: 10.1016/j.jprot.2011.12.016. Epub 2011 Dec 23. J Proteomics. 2012. PMID: 22212456
-
Differential Antivenom and Small-Molecule Inhibition of Novel Coagulotoxic Variations in Atropoides, Cerrophidion, Metlapilcoatlus, and Porthidium American Viperid Snake Venoms.Toxins (Basel). 2022 Jul 26;14(8):511. doi: 10.3390/toxins14080511. Toxins (Basel). 2022. PMID: 35893753 Free PMC article.
-
Preclinical assessment of a polyspecific antivenom against the venoms of Cerrophidion sasai, Porthidium nasutum and Porthidium ophryomegas: Insights from combined antivenomics and neutralization assays.Toxicon. 2013 Mar 15;64:60-9. doi: 10.1016/j.toxicon.2012.12.024. Epub 2013 Jan 10. Toxicon. 2013. PMID: 23313380
-
A Review of Rattlesnake Venoms.Toxins (Basel). 2023 Dec 19;16(1):2. doi: 10.3390/toxins16010002. Toxins (Basel). 2023. PMID: 38276526 Free PMC article. Review.
-
Venomous snakes of Costa Rica: biological and medical implications of their venom proteomic profiles analyzed through the strategy of snake venomics.J Proteomics. 2014 Jun 13;105:323-39. doi: 10.1016/j.jprot.2014.02.020. Epub 2014 Feb 24. J Proteomics. 2014. PMID: 24576642 Review.
Cited by
-
Dietary Breadth Predicts Toxin Expression Complexity in the Venoms of North American Gartersnakes.Integr Org Biol. 2025 Feb 12;7(1):obaf003. doi: 10.1093/iob/obaf003. eCollection 2025. Integr Org Biol. 2025. PMID: 39959576
-
Snake Venomics of the Arboreal Talamancan Palm-Pitviper, Bothriechis nubestris, Provides Clues on the Origin of a Phenotypic Dichotomy between Type-I and Type-II Venoms.J Proteome Res. 2025 Jun 6;24(6):2801-2815. doi: 10.1021/acs.jproteome.4c01041. Epub 2025 Apr 25. J Proteome Res. 2025. PMID: 40277170 Free PMC article.
-
Inhibition of bacterial biofilms by the snake venom proteome.Biotechnol Rep (Amst). 2023 Aug 1;39:e00810. doi: 10.1016/j.btre.2023.e00810. eCollection 2023 Sep. Biotechnol Rep (Amst). 2023. PMID: 37559690 Free PMC article.
-
Breaking muscle: neurotoxic and myotoxic effects of Central American snake venoms and the relative efficacies of antivenom and varespladib.BMC Biol. 2024 Oct 23;22(1):243. doi: 10.1186/s12915-024-02044-3. BMC Biol. 2024. PMID: 39443999 Free PMC article.
References
-
- Almeida DD, Viala VL, Nachtigall PG, Broe M, Gibbs HL, Serrano SMdT, Moura-da Silva AM, Ho PL, Nishiyama-Jr MY, Junqueira-de Azevedo ILM (2021) Tracking the recruitment and evolution of snake toxins using the evolutionary context provided by the Bothrops jararaca genome. Proc Natl Acad Sci 118:e2015159118. 10.1073/pnas.2015159118 - DOI - PMC - PubMed
-
- Amazonas DR, Portes-Junior JA, Nishiyama-Jr MY, Nicolau CA, Chalkidis HM, Mourão RH, Grazziotin FG, Rokyta DR, Gibbs HL, Valente RH, Junqueira-de Azevedo IL, Moura-da Silva AM (2018) Molecular mechanisms underlying intraspecific variation in snake venom. J Proteom 181:60–72. 10.1016/j.jprot.2018.03.032 - DOI - PubMed
Publication types
MeSH terms
Substances
Grants and funding
LinkOut - more resources
Full Text Sources
