. 2023 Jul:63:102750.
doi: 10.1016/j.redox.2023.102750. Epub 2023 May 26.

Thioredoxin TRXo1 is involved in ABA perception via PYR1 redox regulation

Affiliations

Thioredoxin TRXo1 is involved in ABA perception via PYR1 redox regulation

Sabrina De Brasi-Velasco et al. Redox Biol. 2023 Jul.

Abstract

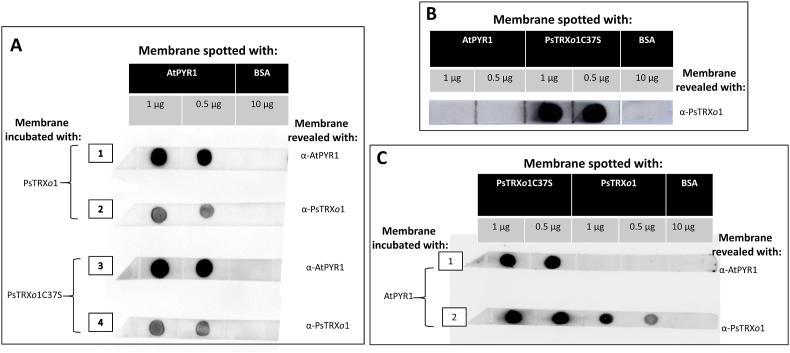
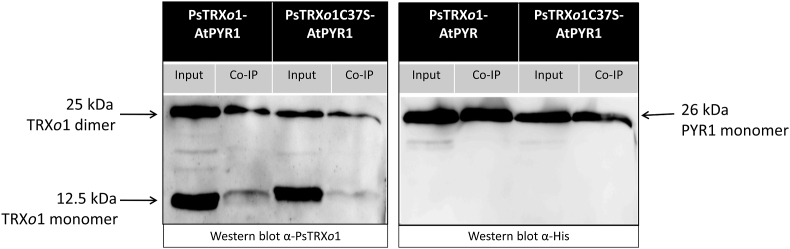
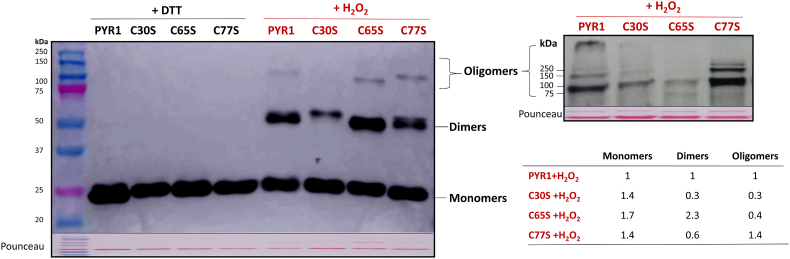
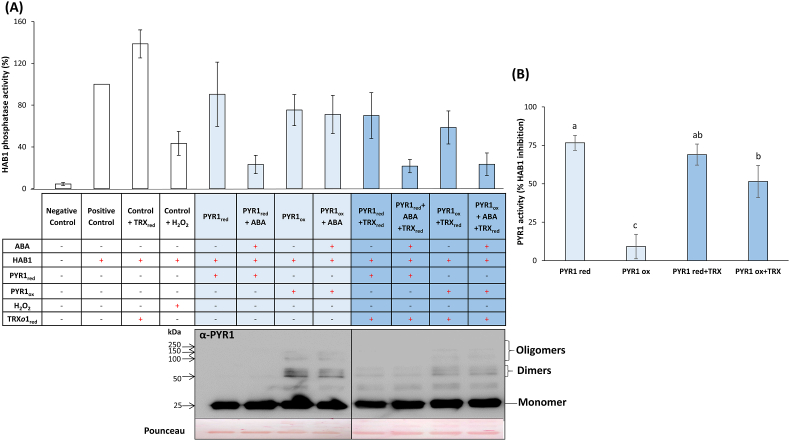
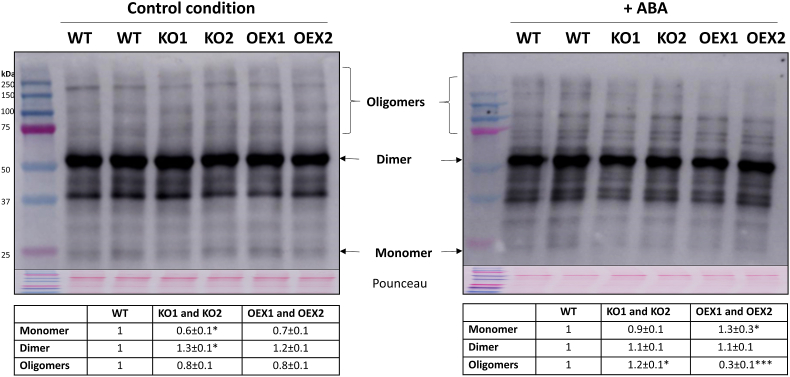
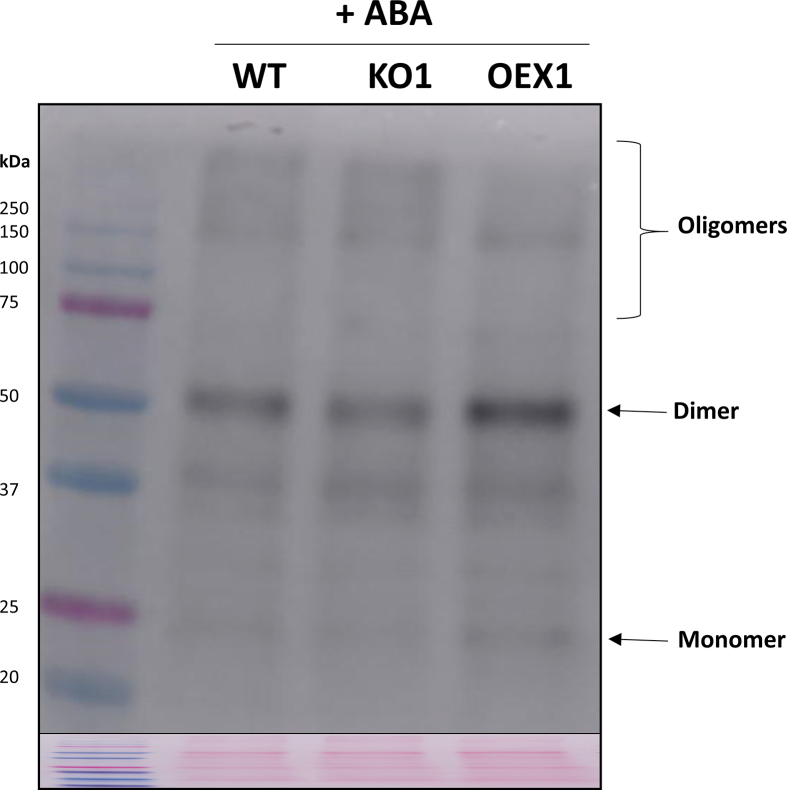
Abscisic acid (ABA) plays a fundamental role in plant growth and development processes such as seed germination, stomatal response or adaptation to stress, amongst others. Increases in the endogenous ABA content is recognized by specific receptors of the PYR/PYL/RCAR family that are coupled to a phosphorylation cascade targeting transcription factors and ion channels. Just like other receptors of the family, nuclear receptor PYR1 binds ABA and inhibits the activity of type 2C phosphatases (PP2Cs), thus avoiding the phosphatase-exerted inhibition on SnRK2 kinases, positive regulators which phosphorylate targets and trigger ABA signalling. Thioredoxins (TRXs) are key components of cellular redox homeostasis that regulate specific target proteins through a thiol-disulfide exchange, playing an essential role in redox homeostasis, cell survival, and growth. In higher plants, TRXs have been found in almost all cellular compartments, although its presence and role in nucleus has been less studied. In this work, affinity chromatography, Dot-blot, co-immunoprecipitation, and bimolecular fluorescence complementation assays allowed us to identify PYR1 as a new TRXo1 target in the nucleus. Studies on recombinant HisAtPYR1 oxidation-reduction with wild type and site-specific mutagenized forms showed that the receptor underwent redox regulation involving changes in the oligomeric state in which Cys30 and Cys65 residues were implied. TRXo1 was able to reduce previously-oxidized inactive PYR1, thus recovering its capacity to inhibit HAB1 phosphatase. In vivo PYR1 oligomerization was dependent on the redox state, and a differential pattern was detected in KO and over-expressing Attrxo1 mutant plants grown in the presence of ABA compared to WT plants. Thus, our findings suggest the existence of a redox regulation of TRXo1 on PYR1 that may be relevant for ABA signalling and had not been described so far.

Keywords: Abscisic acid; Oligomerization; PYR1; Protein interaction; Redox regulation; Thioredoxin o1.


Conflict of interest statement

Declaration of competing interest None.

Figures

Image 1
Graphical abstract
Fig. 1
Fig. 1
Protein pattern of pea nuclear target proteins of HisPsTRXo1C37S. Affinity chromatography and 2D SDS-PAGE in non-reducing (1st dimension) and reducing (2nd dimension) conditions of the eluted complexes. Gels were stained with Blue PageR. Arrows are drawn on the spots in which the peptides corresponding to PYR1 (pyrabactin resistance 1) were identified by MALDI MS/MS sequencing as shown in the table. Data were combined using the BioTools program (Bruker-Daltonics) to search in the non-redundant databases (NCBInr and SwissProt) with the Mascot (Matrix Science, UK) software. All data were manually revised using the BLAST protein program (www.expasy.org). (For interpretation of the references to colour in this figure legend, the reader is referred to the Web version of this article.)
Fig. 2
Fig. 2
(A) Protein gel Dot-blot analysis of the interaction between recombinant AtPYR1 and PsTRXo1/PsTRXo1C37S. Membranes were spotted with AtPYR1 and BSA and were overlaid with TBS buffer containing 10 μg/mL recombinant PsTRXo1 or PsTRXo1C37S. The presence of the proteins was revealed using anti-AtPYR1 and anti-PsTRXo1 antibodies. BSA was spotted onto the membranes as a negative control. (B) Protein gel Dot-blot analysis for the detection of PsTRXo1C37S protein and not AtPYR1 or BSA by the anti α-TRXo1 antibody. (C) Protein gel Dot-blot analysis of the interaction between recombinant AtPYR1 and PsTRXo1C37 or PsTRXo1. Membranes were spotted with PsTRXo1C37S, PsTRXo1, and BSA (as a negative control) and were overlaid with TBS buffer containing recombinant AtPYR1. The presence of the proteins was revealed using anti-AtPYR1 and anti-PsTRXo1 antibodies.
Fig. 3
Fig. 3
Western blot of the resulting Co-IP. The presence of wild type and mutated PsTRXo1 versions and AtPYR1 recombinant proteins was revealed by Western blot with anti-PsTRXo1 and anti-polyhistidine antibodies. The product band of PsTRXo1 recognition on the PsTRXo1 monomer was displayed at 12.5 kDa. The 25 kDa band on the membrane incubated with anti-PsTRXo1 corresponded in molecular weight to the dimer of PsTRXo1, whereas on the membrane incubated with anti-His, the 25 kDa AtPYR1-His protein was detected.
Fig. 4
Fig. 4
BiFC assay in Nicotiana benthamiana with combinations of Arabidopsis and pea proteins. Positive results of the interaction TRXo1-PYR1 after Agrobacterium transformation of Nicotiana benthamiana with the different combinations of constructs of the pea and Arabidopsis genes, cloned into pCX, pXC, pNX, and pXN vectors. Letters N and C indicate the presence of the N-terminal or C-terminal extreme of the GFP in the vector. X represents the relative position of the gene of interest related to the GFP half in which it is fused. Last panels at the bottom present vesicle-associated GFP reconstitution in some TRXo1-PYR1 BiFC assays.
Fig. 5
Fig. 5
(A) Redox treatment of PYR1 and (B) reduction of PYR1 by the thioredoxin system. (A) Recombinant HisAtPYR1 (lane 1 without any treatment) was treated with 2 mM DTT (lane 2), or 4 mM H2O2 (lane 3), or firstly with 2 mM DTT before being treated with 4 mM H2O2 (lane 4), as described in Materials and methods. The pattern of PYR1 oligomerization after treatments is evidenced by the presence of the different monomeric, dimeric, and oligomeric forms, as pointed at the left side. Molecular weight markers are shown in the last lane and pointed on the right side. (B) Recombinant HisAtPYR1 was firstly reduced with 2 mM DTT before being oxidized with 4 mM H2O2 (PYR1ox) (lane 1) as described in Materials and methods. After this, PYRox was treated with TRXo1/NTR/NADPH (lane 2) or with NTR/NADPH (lane 3) as a control. The different oligomeric forms are pointed at the right side and the molecular weight markers on the left side.
Fig. 6
Fig. 6
Redox treatment of recombinant mutant variants of HisAtPYR1 in which one cysteine has been replaced by serine. Recombinant wild type rAtPYR1 and mutated AtPYR1C30S (C30S), HisAtPYR1C65S (C65S), and HisAtPYR1C77S (C77S) were treated with 2 mM DTT (first 4 lanes in gel on the left) or 2 mM DTT + 4 mM H2O2 (lanes 5–8) as described in Materials and methods. Oligomeric and monomeric forms are pointed, as well as molecular weight markers. Pounceau staining is shown to check loading. Gel on the right is an example with an excess of protein for a better visualization of the oligomers, and table presents the relative quantification of the bands in three independent experiments of the H2O2-treated proteins.
Fig. 7
Fig. 7
(A) HAB1 phosphatase and (B) PYR1 activity in the presence/absence of recombinant AtPYR1, PsTRXo1 or ABA, under reducing (red) or oxidizing (ox) conditions. Values in A represent the phosphatase activity percentage in the reaction using different components specified in each case, in comparison with the HAB1 phosphatase activity alone (positive control considered as 100%). PYR1 and TRXo1 proteins were reduced with 2 mM DTT when indicated (PYR1red and TRXo1red) and PYR1 was previously reduced with 2 mM DTT and, after desalting, it was oxidized with 4 mM H2O2 (PYR1ox) as described in Materials and methods. HAB1 phosphatase activity was measured using pNPP as substrate monitoring changes in absorbance at 405 nm. Western blot against anti-PYR1 antibody shows an example of the oligomeric forms detected in the different reactions tested for the measurement of the HAB1 phosphatase activity. Pounceau staining is shown to check loading. Values in B represent the PYR1 activity measured indirectly through the inhibition of HAB1 phosphatase activity. The percentage of PYR activity was calculated by comparing the PYR1 activity in the presence and absence of ABA for each reaction (from data in Fig. 7A). Values are the mean ± SE of 3 replicates. Different letters indicate significant differences (p < 0.05) among treatments according to the Tukey's test. (For interpretation of the references to colour in this figure legend, the reader is referred to the Web version of this article.)
Fig. 8
Fig. 8
Western blot analysis for in vivo PYR1 detection. Western blot was performed using α-PYR1 antibody in WT plants in non reducing, reducing (+DTT), and oxidizing (+H2O2) treatments of the leaf extracts. Extracts (lane 2) were incubated with 50 mM DTT (lane 3) or 4 mM H2O2 (lane 4). Marker (M) proteins were loaded in lane 1 for molecular weight position. The pattern of PYR1 oligomerization after treatments of the leaf extracts is evidenced by the presence of the different monomeric, dimeric, and oligomeric forms, as pointed at the right side. The asterisk points a very high molecular weight oligomer and ns points a non-specific band.
Fig. 9
Fig. 9
Western blot analysis for in vivo PYR1 detection in WT leaf extracts after a redox shift assay. Western blot was performed using α-PYR1 antibody in extracts treated with NEM (blocking agent of free cysteine thiols) + TCEP (as reductant of S–S groups) in the absence and presence of MM[PEG]24 (alkylating agent adding molecular weight to free cysteine thiols). Two different amounts of protein are presented for a better visualization of the different bands, and the monomer, dimer, and oligomer forms of PYR1 are pointed together with a non-specific (ns) band. Marker (M) proteins were loaded in lanes 1 and 4 for molecular weight position.
Fig. 10
Fig. 10
Analysis of over-expression of AtTRXo1. (A) Gene expression analysis by RT-qPCR of AtTRXo1 relative to the ACTINE 8 (AtACT8) gene. Expression data are the mean ± SE of three technical replicates of five biological samples (with a pool of 10 plants in each sample). Asterisk indicates that data significantly different according to t-Student's test (P < 0.05). Western blot analysis of mitochondrial (B) and nuclear-enriched (C) proteins from wild type (WT) and over-expressing (OEX) Attrxo1 lines using the AtTRXo1 antibody. Recombinant (r) pea PsHisTRXo1 protein was loaded as a control in B and Pounceau staining of the membranes is shown as a loading control. Marker (M) proteins were loaded and marked in each membrane for molecular weight position.
Fig. 11
Fig. 11
Western blot analysis for in vivo PYR1 detection in leaf extracts. Western blot was performed using α-PYR1 antibody in leaf extracts of WT, 2 lines of KO and 2 lines of OEX Attrxo1 mutant plants grown in plates in the absence and presence of 10 μM ABA (+ABA) for 48 h. Marker (M) proteins were loaded in lane 1 for molecular weight position and Pounceau staining is shown to check loading. The pattern of PYR1 oligomerization of the leaf extracts is evidenced by the presence of the different monomeric, dimeric, and oligomeric forms, as pointed. Tables under the membranes present the band quantification as a mean of three independent experiments ± SE, and asterisks represent significant differences with WT (value 1) using t-Student's test (P < 0.05 [*], P < 0.005 [***]). The bands higher than 75 kDa are considered as oligomers for quantification.
Fig. S1
Fig. S1
(A) Phylogenetic tree of PYR1 orthologues in legumes. It was done using phylogeny.lirmm.fr/phylo_cgi/. Accession number in Phytozome database: Glycine maxima (Glyma.01g097000); Phaseolus vulgaris (Phvul.003G285500); Medicago truncatula (Medtr5G030500). (B) Mapping of conserved sequences (pink >70% homology among PYR orthologues) was done using: http//genome.lbl.gov/vista/mvista/submit.shtml.
Fig. S2
Fig. S2
Sequence alignment among PYR1 orthologues. In red, the conserved areas of the 4 genes; in blue, only those of 3 genes; and in black, less than 2 genes. Yellow colour indicates the most conserved areas with >70% homology among the orthologues identified with the mvista program. Arrows indicate the most probable start and end of the PYR1 ORF. Done using: tttp//multalin.toulouse.inra.fr/multalin.
Fig. S3
Fig. S3
Protein gel dot-blot analysis for the detection of His tag in thrombin-treated HisPsTRXo1C37S and HisPYR1 proteins by the anti α-His antibody. BSA (10 μg) was loaded as a negative control.
Fig. S4
Fig. S4
Model of the 3D structure of PYR1. The crystal structure of PYR1 in complex with ABA (experimental PDB structure 3K90) formed by two dimers organized in a tetrameric crystallographic unit. Only the magenta PYR1 monomer has an ABA molecule bound to the binding pocket. The position of cysteine residues in the different monomers is indicated. View showing the proximity of C65 residues (A) and C30 residues (B) in the different orientations of the monomers in the tetramer structure.
Fig. S5
Fig. S5
Western blot analysis for PYR1 detection in leaf extracts. Western blot was performed using α-PYR1 antibody in leaf extracts of WT, KO1, and OEX1 Attrxo1 mutant plants grown in the presence of 10 μM ABA (+ABA) for 48 h. Marker (M) proteins were loaded in lane 1 for molecular weight position, and Pounceau staining is shown to check loading.

Similar articles

Cited by

References

    1. Gupta K., Wani S.H., Razzaq A., Skalicky M., Samantara K., Gupta S., Pandita D., Goel S., Grewal S., Hejnak V., et al. Abscisic acid: role in fruit development and ripening. Front. Plant Sci. 2022;10 doi: 10.3389/fpls.2022.817500. oi: - DOI - PMC - PubMed
    1. Kishor P.P.K., Tiozon R.N., Jr., Fernie A.R., Sreenivasulu N. Abscisic acid and its role in the modulation of plant growth, development, and yield stability. Trends Plant Sci. 2022;27:1283–1295. doi: 10.1016/j.tplants.2022.08.013. - DOI - PubMed
    1. Sakata Y., Komatsu K., Takezawa D. In: Progress in Botany 75. Lüttge U., Beyschlag W., Cushman J., editors. Springer-Verlag, Berlin Heidelberg; 2014. ABA as a universal plant hormone; pp. 57–96. 2014. - DOI
    1. Ruggiero A., Landi S., Punzo P., Possenti M., Van Oosten M.J., Costa A., Morelli G., Maggio A., Grillo S., Batelli G. Salinity and ABA seed responses in pepper: expression and interaction of ABA core signaling components. Front. Plant Sci. 2019;10:304. doi: 10.3389/fpls.2019.00304. - DOI - PMC - PubMed
    1. Fujii H., Chinnusamy V., Rodrigues A., Rubio S., Antoni R., Park S.Y., Cutler S.R., Sheen J., Rodriguez P.L., Zhu J.K. In vitro reconstitution of an abscisic acid signalling pathway. Nature. 2009;462:660–664. - PMC - PubMed

Publication types

MeSH terms