. 2023 Jun 22;186(13):2929-2949.e20.
doi: 10.1016/j.cell.2023.05.002. Epub 2023 Jun 3.

Distinct longevity mechanisms across and within species and their association with aging

Affiliations

Distinct longevity mechanisms across and within species and their association with aging

Alexander Tyshkovskiy et al. Cell. .

Abstract

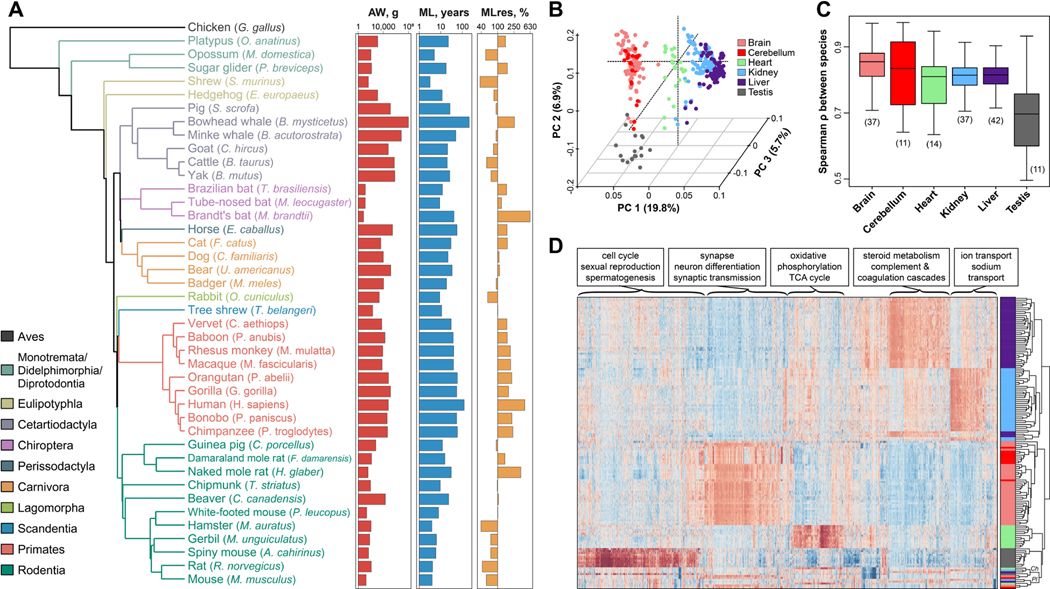
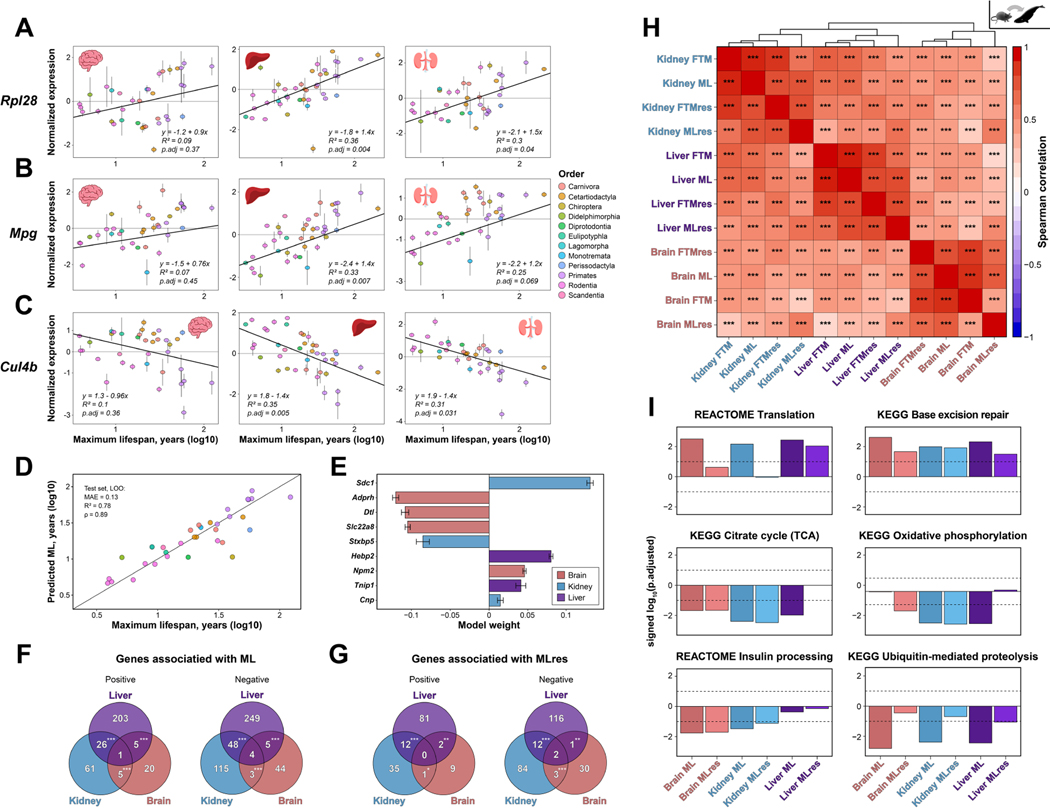
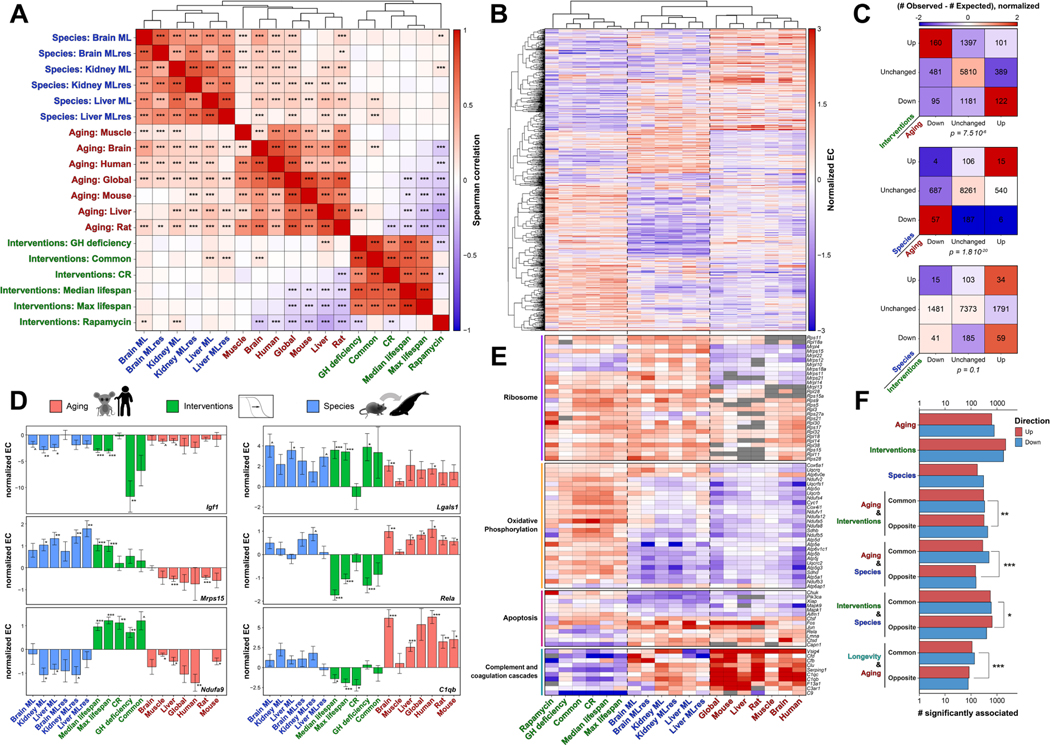
Lifespan varies within and across species, but the general principles of its control remain unclear. Here, we conducted multi-tissue RNA-seq analyses across 41 mammalian species, identifying longevity signatures and examining their relationship with transcriptomic biomarkers of aging and established lifespan-extending interventions. An integrative analysis uncovered shared longevity mechanisms within and across species, including downregulated Igf1 and upregulated mitochondrial translation genes, and unique features, such as distinct regulation of the innate immune response and cellular respiration. Signatures of long-lived species were positively correlated with age-related changes and enriched for evolutionarily ancient essential genes, involved in proteolysis and PI3K-Akt signaling. Conversely, lifespan-extending interventions counteracted aging patterns and affected younger, mutable genes enriched for energy metabolism. The identified biomarkers revealed longevity interventions, including KU0063794, which extended mouse lifespan and healthspan. Overall, this study uncovers universal and distinct strategies of lifespan regulation within and across species and provides tools for discovering longevity interventions.

Keywords: Igf1, KU0063794; aging; bowhead whale; gene expression; lifespan extension; longevity; longevity signatures; mSALT; naked mole rat.


Conflict of interest statement

Declaration of interests A patent application (no. 17/625,425) is pending that includes some of the data described in this article.

Figures

Figure 1.
Figure 1.. RNA-seq of mammalian tissues
(A) Phylogenetic tree of examined species and their longevity traits. Adult weight (AW), maximum lifespan (ML) and ML residual adjusted for body mass (MLres) are shown on barplots in logarithmic scale. (B) Principal component analysis of mammalian samples. First 3 Principal Components (PCs) are shown. The percentage of total variance explained by each PC is indicated in parentheses. (C) Within-organ variability across mammalian species. Pairwise Spearman correlation coefficients between species expression profiles were calculated for each organ. The number of available species is indicated in parenthesis. (D) Expression of genes significantly enriched or depleted in specific organs. Columns represent genes; rows represent biological samples colored by organ, as in (B). Top pathways enriched for corresponding gene sets are indicated in the text. Ch: Chicken; Pl: Platypus. See also Figure S1 and Tables S1 and S2.
Figure 2.
Figure 2.. Gene expression signatures of species longevity
(A-C) Representative genes associated with species maximum lifespan. Selected genes include Rpl30 (A), Rpl28 (B), and Cul4b (C). The association between log10(maximum lifespan) and average normalized log10(expression) is shown for brain (left), liver (middle) and kidney (right). Linear model equation, slope adjusted p-value and R2 estimated with phylogenetic regression are displayed. Data are means ±SE. (D) Accuracy of Elastic Net prediction of species maximum lifespan (ML) based on tissue gene expression. Mean absolute error (MAE), R2 and Pearson’s correlation coefficient were estimated on LOO test set. Each dot represents a single species and is colored by taxonomic group, as in (A-C). (E) Gene expression predictors of maximum lifespan. For each gene, data represents mean weight in Elastic Net models trained on different subsets ±SE. Only genes with non-zero average weight are included (p.adjusted<0.05). (F-G) Overlap of genes associated with maximum lifespan unadjusted (F) and adjusted for body mass (MLres) (G) across mammalian tissues. P-value was calculated with Fisher exact test. (H) Spearman correlation of longevity-associated gene expression changes. Asterisks reflect statistical significance. (I) Functional enrichment of lifespan-associated genes. Dotted lines reflect threshold of p.adjusted=0.1. The whole list of enriched functions is in Table S3A. *P.adjusted<0.05; **P.adjusted<0.01; ***P.adjusted<0.001. FTM: Female Time to Maturity; FTMres: Female Time to Maturity Residual. See also Figure S2 and Table S3.
Figure 3.
Figure 3.. Transcriptomic signatures of mammalian aging
(A) Spearman correlation of age-related expression changes (ECs) across datasets estimated using a global aging signature. Red frame highlights aggregated (global) age-related ECs. (B-C) Spearman correlation of aging-associated ECs between tissues (B) and species (C). Text and asterisks represent correlation coefficient and adjusted p-value, respectively. (D-E) Overlap of genes with significant age-related ECs across tissues (D) and species I. P-value was calculated with Fisher exact test. (F) Vsig4 (upper) and Nrep (lower) age-related ECs. Each dot represents normalized average gene EC calculated from a single dataset ±SE. Red dotted line and shaded area represent weighted mean EC estimated using mixed-effect model, and 95% confidence interval, respectively. (G) Contribution of tissue, species and source to pairwise Spearman correlation of age-related ECs. Bar color reflects the statistical significance of factor contribution, assessed with multiple linear regression. (H) Normalized age-associated ECs across tissues and species. Only genes significantly associated with aging in at least one signature (p.adjusted<0.05) are shown. (I) Functional enrichment (GSEA) of aging signatures. Only functions significantly enriched by at least one signature are shown (p.adjusted<0.1). The whole list of enriched functions is in Table S3B. ^P.adjusted<0.1; *P.adjusted<0.05; **P.adjusted<0.01; ***P.adjusted<0.001. WBC: White blood cells; SCAT: Subcutaneous adipose tissue; BAT: Brown adipose tissue; MAT: Marrow adipose tissue; Muscle: Skeletal muscle. See also Figures S3 and S4 and Tables S1 and S3.
Figure 4.
Figure 4.. Interplay between transcriptomic signatures of aging and longevity
(A) Denoised Spearman correlation of signatures of aging (red), lifespan-extending interventions (green) and species longevity (blue). Asterisks reflect statistical significance of each pairwise correlation. (B) Normalized expression changes (ECs) of genes associated with aging and longevity. Only genes significantly associated with at least one trait are shown (p.adjusted<0.05). X axis represents individual signatures. (C) Overlap of aging- and longevity-associated genes. Number of aggregated signature genes and deviation from the expected random overlap are indicated with text and color, respectively. P-value was estimated with Pearson’s chi square test. (D) Association of Igf1, Mrps15, Ndufa9, Lgals1, Rela and C1qb expression with aging and longevity. Data are mean normalized ECs ±SE. (E) Functional enrichment of gene signatures shared by several models. Presented functions were annotated by KEGG. Missing data are shown in grey. (F) Number of aggregated, shared and distinct signature genes associated with aging and longevity. For each pair of models, difference between number of co-regulated and distinct genes was assessed using two-sample proportion test. ^P.adjusted<0.1; *P.adjusted<0.05; **P.adjusted<0.01; ***P.adjusted<0.001. CR: Calorie restriction; GH: Growth hormone; Common: Shared signatures of longevity interventions; Median/Max lifespan: Signatures of intervention effect on median/maximum lifespan; ML: Maximum lifespan; MLres: Maximum lifespan residual; Longevity: Shared biomarkers of lifespan-extending interventions and long-lived species. See also Figure S5 and Table S4.
Figure 5.
Figure 5.. Molecular pathways associated with mammalian longevity
(A-C) Pathways associated with lifespan-extending interventions and species longevity. Metabolites and genes are shown in rectangles and italic, respectively. Arrows represent significant positive (up) and negative (down) associations with longevity within (green) and across (blue) species. (D-G) Association of uric acid (D), allantoin (E), NAD+ (F) and cystathionine (G) concentration with longevity within (green) and across (blue) species. The vertical axis reflects metabolite normalized: logFC in murine liver in response to individual lifespan-extending interventions and aggregated across interventions (Common); slope of association with mouse median (Lifespan.median) and maximum lifespan (Lifespan.max); slope of association with species maximum lifespan (ML) and maximum lifespan residual (MLres) in individual organs and aggregated across organs (Pooled). Error bars are ±SE. (H-J) Association of Uox (H), Nadsyn1 (I) and Cth (J) expression with lifespan extension induced by interventions (survival curve icon) and across species (mouse/whale icon). Examined organs are reflected with liver and brain icons. The black line, slope p-value and R2 indicate the model fitted with phylogenetic (for species) or linear (for interventions) regression. Data are means ±SE. ^P.adjusted<0.1; *P.adjusted<0.05; **P.adjusted<0.01; ***P.adjusted<0.001. CR: Calorie restriction; EOD: Every-other-day feeding; oe: overexpression; M: Male; F: Female; NA: Nicotinic acid; NaMN: Nicotinic acid mononucleotide; NaAD: Nicotinic acid adenine dinucleotide; NAD: Nicotinamide adenine dinucleotide; NMN: Nicotinamide mononucleotide; NAM: Nicotinamide; SAM: S-Adenosyl methionine; GSH: Glutathione. See also Figure S5.
Figure 6.
Figure 6.. Common and distinct transcriptomic signatures of longevity
(A) Functional enrichment (GSEA) of longevity and aging-associated signatures. Only functions significantly enriched by at least one signature (p.adjusted<0.1) are presented. The whole list of enriched functions is in Table S3. NES: Normalized enrichment score. (B) Functional enrichment of aggregated, shared and distinct signatures of longevity and aging. Proportion of pathway-associated genes and statistical significance are reflected by bubble size and color. The whole list of functions is in Table S5A. (C) Partial correlation network of gene expression signatures of longevity and aging. Sign of partial correlation coefficient (PCC) is indicated by color. AW: Adult Weight; Ints: Signature of interventions effect on maximum lifespan; AA Met: Metabolism of amino acids and derivatives; Adaptive immune: Adaptive immune system; Complement: Complement cascade; FA Met: Fatty acid metabolism; Innate immune: Innate immune system; Interf γ: Interferon gamma signaling; Mt Trans: Mitochondrial translation; Oxid Phosph: Oxidative Phosphorylation; Ribo: Ribosome. (D) Effect of cardamonin (left), clofilium tysolate (middle) and deguelin (right) on survival of fibroblasts from species with different lifespans following paraquat-induced oxidative stress. Y axis displays log-ratio of the number of survived fibroblasts treated and untreated with the compound. X axis shows maximum lifespan unadjusted (top) and adjusted (bottom) for adult weight. Slope p-value was assessed with mixed-effect linear model. n=3–6 per treated and control group for every species/strain. (E) Evolutionary features of longevity and aging-associated aggregated signature genes. Data are means ±SE. Statistical significance of enrichment was assessed with Fisher’s exact test. (F) Common (bold), distinct and unique transcriptomic signatures of longevity across and within species. ^P.adjusted<0.1; *P.adjusted<0.05; **P.adjusted<0.01; ***P.adjusted<0.001. ML: Maximum lifespan; MLres: Maximum lifespan residual. See also Figure S6 and Tables S3 and S5.
Figure 7.
Figure 7.. Transcriptomic longevity signatures reveal lifespan-regulating interventions
(A) Association of murine gene expression response to genetic, environmental (upper) and pharmacological (lower) interventions with signatures of aging (red), long-lived species (blue) and lifespan-extending interventions (green). Aggregated (left) and individual (right) signatures were utilized. The output of the association test is in Table S6. ^P.adjusted<0.1; *P.adjusted<0.05; **P.adjusted<0.01; ***P.adjusted<0.001. (B) Design of the study testing the effect of KU0063794 on mouse survival and healthspan. (C) Survival curves of 25-month-old male C57BL/6 mice subjected to KU0063794 (10 ppm). P-value was calculated with log-rank test. (D) Body weight of 30-month-old control and KU0063794-treated male C57BL/6 mice. (E) Median time to finish measured in 30-month-old control and KU0063794-treated male C57BL/6 mice. (F) Frailty index score of 30-month-old control and KU0063794-treated male C57BL/6 mice. (G) Percentage of immune cell types in spleens of 27-month-old control and KU0063794treated male C57BL/6 mice. (H) Glucose tolerance in 24-month-old control and KU0063794-treated C57BL/6 mice. n=10 for each group. (I) Area under the curve (AUC) of glucose level shown in (H). P-values on (D-I) were calculated with one-tailed Wilcoxon rank sum test. NES: Normalized enrichment score; CR: Caloric restriction; GH: Growth hormone; ML: Maximum lifespan; MLres: Maximum lifespan residual; KO: Knockout; OE: Overexpression; WAT: White adipose tissue. See also Figure S7 and Tables S1, S6 and S7.

References

    1. Sacher GA (1959). Relation of lifespan to brain weight and body weight in mammals. Wolstenholme GEW, O’Conner M (Eds.), Ciba Found. Symp. – Lifesp. Anim. (Colloquia Ageing), John Wiley Sons, Ltd, Chichester, 115–141. 10.1002/9780470715253.ch9. - DOI
    1. de Magalhães JP, Costa J, and Toussaint O (2005). HAGR: The Human Ageing Genomic Resources. Nucleic Acids Res. 33, 537–543. 10.1093/nar/gki017. - DOI - PMC - PubMed
    1. Buffenstein R (2008). Negligible senescence in the longest living rodent, the naked mole-rat: insights from a successfully aging species. J Comp Physiol B 178, 439–445. 10.1007/s00360-007-0237-5. - DOI - PubMed
    1. Seim I, Fang X, Xiong Z, Lobanov AV, Huang Z, Ma S, Feng Y, Turanov AA, Zhu Y, Lenz TL, et al. (2013). Genome analysis reveals insights into physiology and longevity of the Brandt’s bat Myotis brandtii. Nat. Commun 4, 1–8. 10.1038/ncomms3212. - DOI - PMC - PubMed
    1. Ma S, and Gladyshev VN (2017). Molecular signatures of longevity: Insights from cross-species comparative studies. Semin. Cell Dev. Biol 70, 190–203. 10.1016/j.semcdb.2017.08.007. - DOI - PMC - PubMed

Publication types

Substances