. 2023 Jun 22;186(13):2911-2928.e20.
doi: 10.1016/j.cell.2023.05.006. Epub 2023 Jun 2.

Sleep is required to consolidate odor memory and remodel olfactory synapses

Affiliations

Sleep is required to consolidate odor memory and remodel olfactory synapses

Rashmi Chandra et al. Cell. .

Abstract

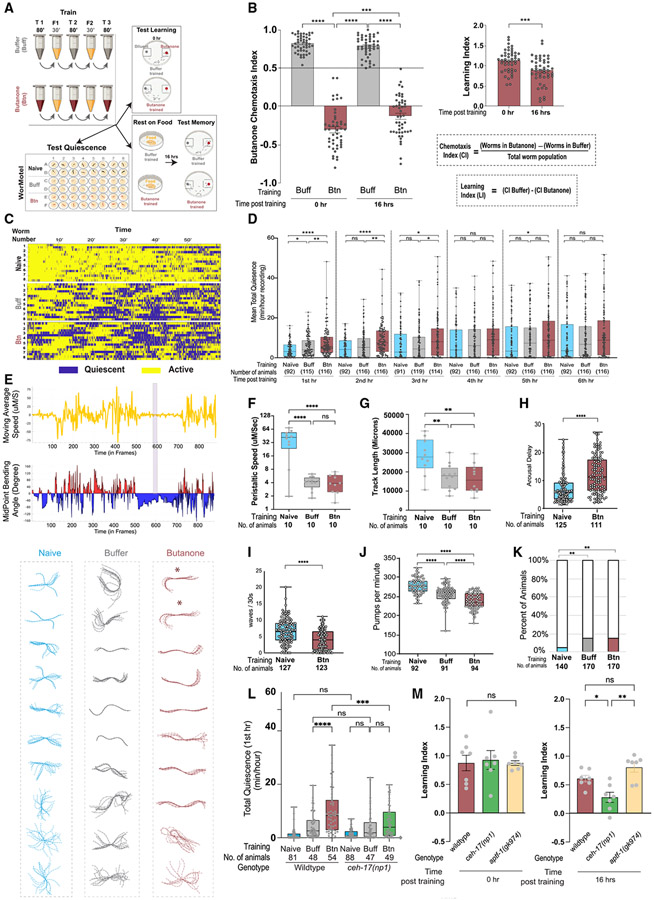
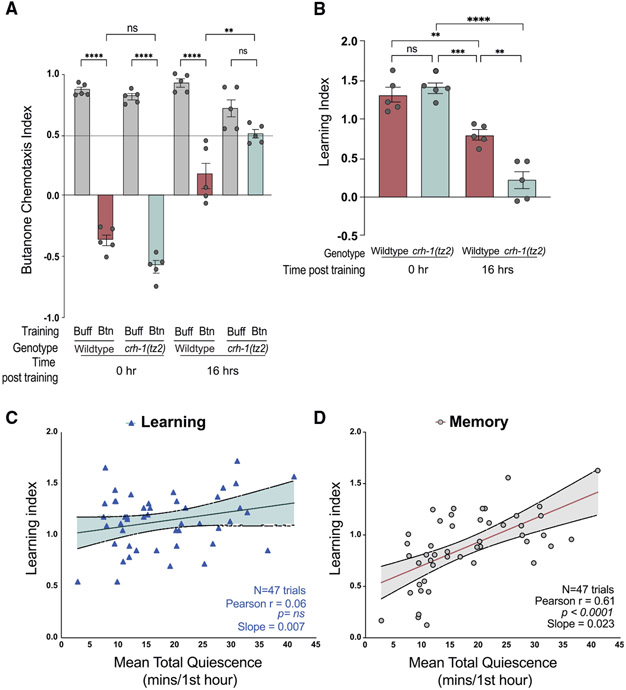
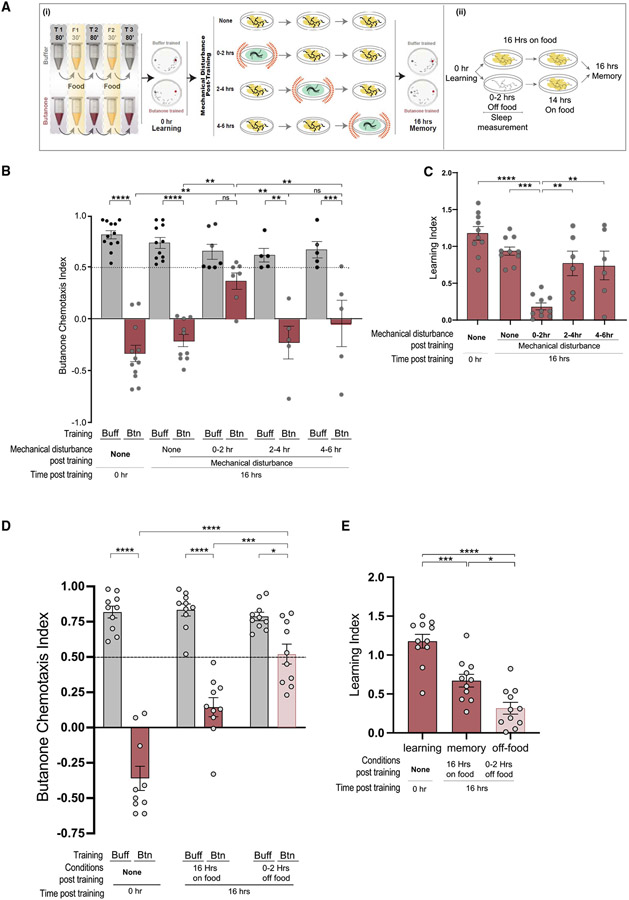
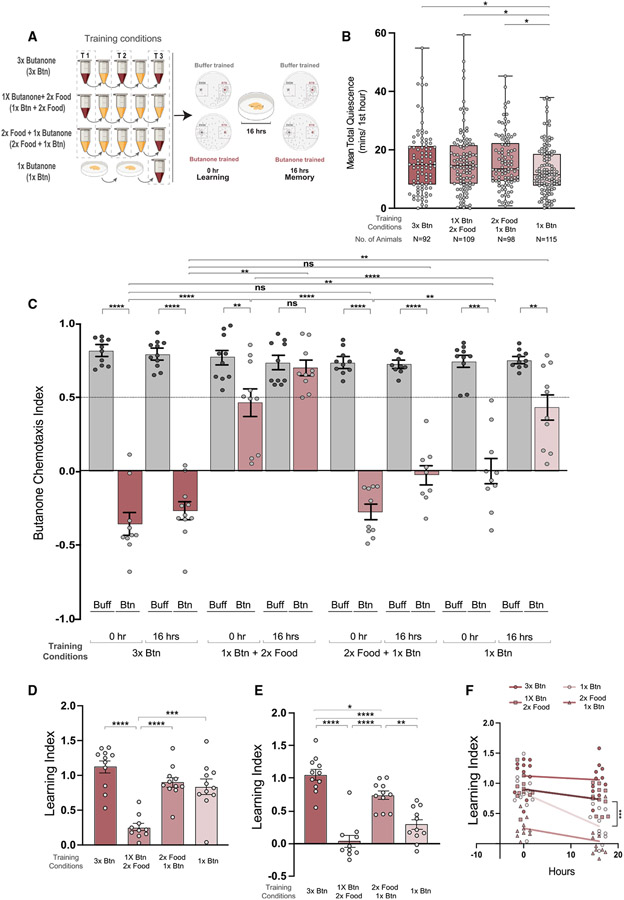
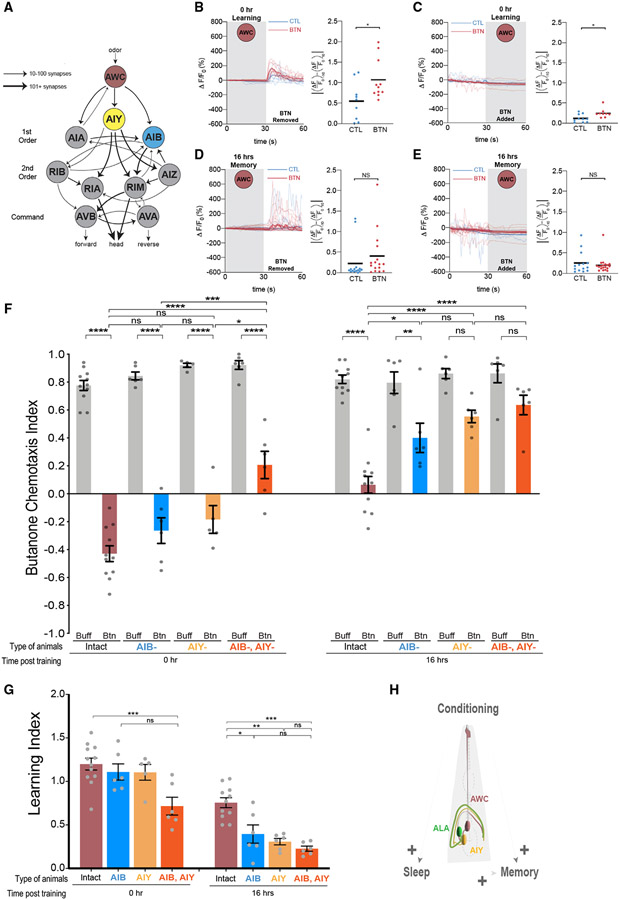
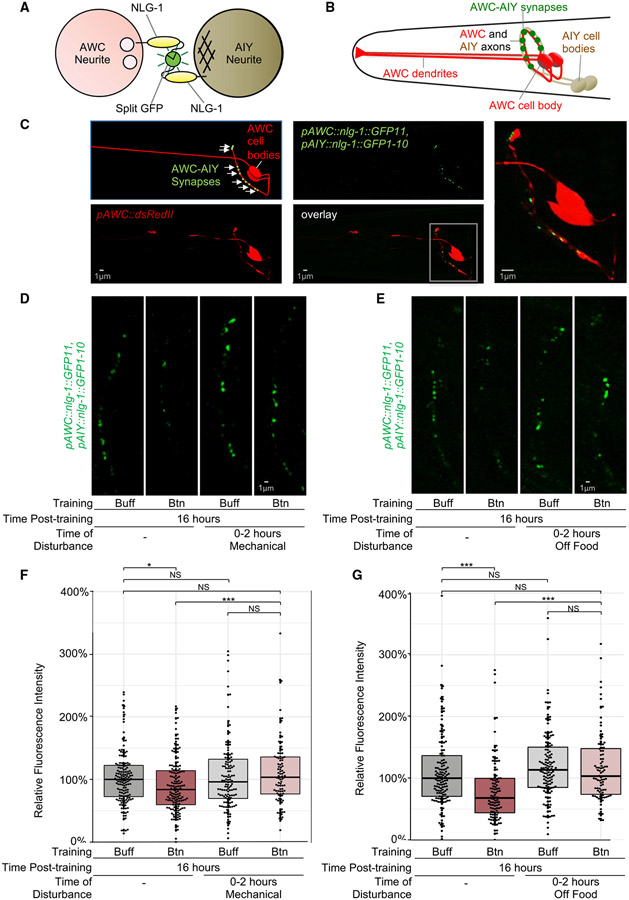
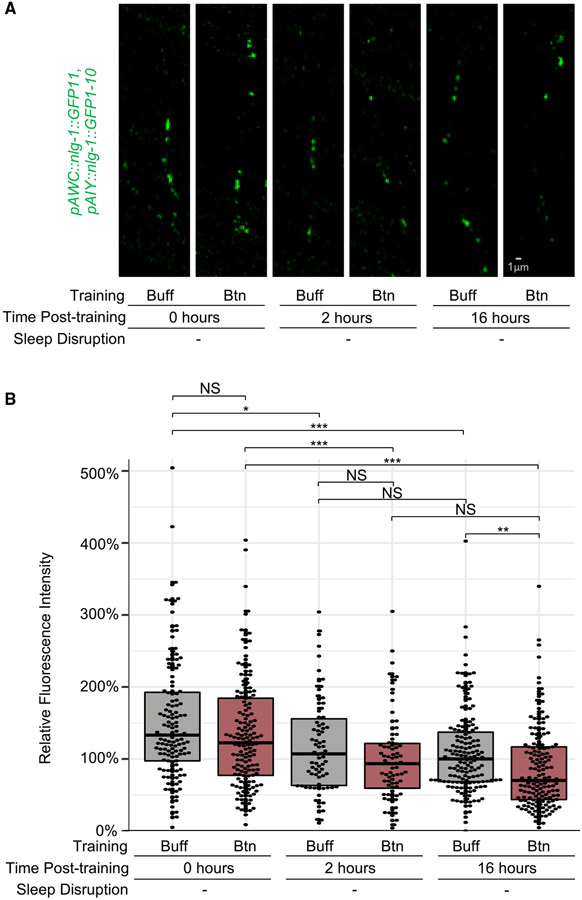
Animals with complex nervous systems demand sleep for memory consolidation and synaptic remodeling. Here, we show that, although the Caenorhabditis elegans nervous system has a limited number of neurons, sleep is necessary for both processes. In addition, it is unclear if, in any system, sleep collaborates with experience to alter synapses between specific neurons and whether this ultimately affects behavior. C. elegans neurons have defined connections and well-described contributions to behavior. We show that spaced odor-training and post-training sleep induce long-term memory. Memory consolidation, but not acquisition, requires a pair of interneurons, the AIYs, which play a role in odor-seeking behavior. In worms that consolidate memory, both sleep and odor conditioning are required to diminish inhibitory synaptic connections between the AWC chemosensory neurons and the AIYs. Thus, we demonstrate in a living organism that sleep is required for events immediately after training that drive memory consolidation and alter synaptic structures.

Keywords: C. elegans; behavior; circuit; memory; memory consolidation; plasticity; single cell; sleep; synapse; systems consolidation.


Conflict of interest statement

Declaration of interests The authors declare no competing interests.

Figures

Figure 1.
Figure 1.. Spaced training paradigm induces long-lasting memory and quiescence that exhibits hallmarks of sleep
(A) Training and subsequent analysis. Wild-type populations were subjected to repeated, spaced training with either butanone or buffer (control), then split into thirds and tested for learning (chemotaxis assays), placed on plates with food (E. coli) for 16 h, then tested for memory (chemotaxis assays) or single animals were loaded in individual wells of a WorMotel device containing food immediately after training. (B) Learning and 16-h memory. Chemotaxis indices (CIs) and learning indices (LIs) were calculated as indicated. CI and LI data points represent a trial of >50 animals on a separate day. n = 47 trials. One-way ANOVA was performed on the CIs and two-tailed t test on the LIs (***p < 0.001, ****p < 0.0001). (C) Quiescence analysis. Movement was imaged at 1 frame per 3 s. Raster plot showing activity (yellow) and quiescence (blue, >10 s movement) of naive, buffer- or butanone-trained individuals at the indicated time. Each row represents one individual animal. (D) Quiescence over 6 h. Each data point represents an animal’s mean total quiescence (minutes) over the hour indicated, and numbers of animals are indicated below. ****p < 0.0001, ***p < 0.001, **p < 0.01, *p < 0.05, one-way ANOVA with Bonferroni’s correction, n = 7 trials. (E) Posture analysis. Top, (yellow trace) example of one animal’s moving average speed and below, blue and red histogram of midpoint-bending angle in the hour after training. Shaded bar indicates a 10-frame period with the lowest speed and least bending angle. Bottom, 10 consecutive frames from this period were captured, animals were skeletonized, and their skeletons aligned to their midpoints and overlayed. (F) Movement speed. The speed of each animal in (E) is plotted. (G) Track length. The distance (millimeter) each animal in (E) traveled is plotted. (F and G) ****p < 0.0001, one-way ANOVA with Bonferroni’s multiple correction. (H) Arousal delay. Time (seconds) before blue LED light flashes and 1.2 kHz of vibrations evoked a complete sinusoidal escape wave. Data show for individual animals in three separate trials. (I) Activity following arousal. The number of sinusoidal waves completed in 30 s after exposure to blue LED (light emitting diode) light and 1.2 kHz vibrations stimuli. Additional animals from videos in (H) were analyzed. (H and I) ****p < 0.0001, ***p < 0.001, Mann-Whitney U test. (J) Feeding rate. Each point indicates the pharyngeal pumps per minute for one animal, 5 trials. One-way ANOVA with Bonferroni’s multiple correction, ****p < 0.0001. (K) Feeding quiescence. Fraction of immobile animals on food not pumping for at least 4 s (colored bars) within a minute of observation. Z test with Hochberg correction, **p < 0.01. Error is standard error of the proportiosn. (L) ALA-defective ceh-17 mutants are less quiescent than wild types after butanone training. Mean total quiescence in the first hour after training for naive, buffer- and butanone-trained wild-type and ALA-defective ceh-17(np1) animals examined in the WorMotel. n = 5 trials. (M) ALA-defective ceh-17 mutants consolidate less memory than wild types or RIS-defective mutants. LIs of wild-type, ceh-17(np1) and aptf-1(gk974) mutant strains 0 and 16 h after training. n = 7 trials. (L and M) ****p < 0.0001, ***p < 0.001, **p < 0.01, *p < 0.05 and (ns) is p > 0.05, one-way ANOVA of LIs, followed by Bonferroni’s multiple correction. All error bars are ±SEM unless mentioned. Figures S1, S2, and S3, Table S1 and S2, and Video S1 are related to Figure 1.
Figure 2.
Figure 2.. Long-lasting olfactory memory requires CREB and is correlated with quiescence after training
(A and B) (A) CIs and (B) LIs for wild-type animals and CREB-defective crh-1(tz2)/CREB mutants immediately and 16 h after training (****p < 0.0001, ***p < 0.001, **p < 0.005 and (ns) is p > 0.05, one-way ANOVA with Bonferroni’s multiple correction, n = 5 trials. All error bars are ±SEM. (C) The LI of each population at t = 0 (before recovery) is plotted versus the mean duration of quiescence in the hour after training. n = 47 trials, Pearson’s correlation coefficient is 0.06 p = ns. (D) The LI at t = 16 (after recovery) is plotted versus the mean duration of quiescence in the hour after training. n = 47 trials, Pearson’s correlation coefficient (r) is 0.61, p < 0.0001. Table S1 supports the statistics and Table S2 contains the raw and analyzed data for this figure.
Figure 3.
Figure 3.. Disturbing animals immediately after training blocks memory
(A) (i) Mechanical disturbance: training is followed by shaking (red springs) animals in lower viscosity food every 15 min for 2 h from 0–2, 2–4, or 4–6 h after training. Figure S3 indicates that animals eat during mechanical disturbance. Videos of sleep disruption are in Video S3, related to Figure 2. After disturbance, animals are recovered on food without shaking until 16 h after training. (ii) Metabolic disturbance: animals are recovered on agar petri dishes without bacteria for 2 h immediately after training, then moved to bacterial lawns for 14 h. Quiescence was measured during the period off food. (B) CIs of mechanically disturbed populations. ****p < 0.0001, ***p < 0.001, **p < 0.01, *p < 0.05, and (ns) is p > 0.05, two-way ANOVA with Bonferroni’s multiple correction, n = 5 trials. (C) LIs of mechanically disturbed populations. ****p < 0.0001, ***p < 0.001, **p < 0.01, and (ns) is p > 0.05, one-way ANOVA with Bonferroni’s multiple correction, n < 5 trials. (D and E) (D) CIs and (E) LIs of animals removed from food 0–2 h after training. (****p < 0.0001, ***p < 0.001, **p < 0.01, *p < 0.05, and (ns) is p > 0.05, one-way ANOVA with Bonferroni’s multiple correction, n > 5 trials. All error bars are ±SEM. Figure S4 and Table S1 supports the statistics and Table S2 contains the raw and analyzed data for this figure.
Figure 4.
Figure 4.. Increasing sleep increases memory
(A) Animals were trained for three cycles with butanone (top row, 3XBtn), trained once with butanone then swam in food mixed with buffer for two cycles (1XBtn + 2XFood), swam in food for two cycles then trained once with butanone (2XFood + 1XBtn), or trained once with butanone (bottom row, 1XBtn). After training, quiescence was assessed with WorMotel. Learning was assessed with a chemotaxis assay immediately after training and memory with a chemotaxis assay 16 h later. (B) Mean total quiescence was determined after each training paradigm. p < 0.05, unpaired t test with Welch’s correction, n = 5 trials. (C) CIs of populations after each training paradigmat 0 or 16 h post-training. ****p < 0.0001, ***p < 0.001, ** p < 0.01, *p < 0.05, and (ns) is p > 0.05, two-way ANOVA with Bonferroni’s multiple correction, n = 10 trials. (D) LIs immediately after training. (E) LIs 16 h after training. ****p < 0.0001, ***p < 0.001, **p < 0.01, *p < 0.05, and (ns) is p > 0.05, one-way ANOVA with Bonferroni’s multiple correction,n = 10 trials. (F) ***p < 0.001, comparison of slopes using linear regression shows the amount of memory lost between 0 and 16 h for each training condition. All error bars are ±SEM. Table S1 supports the statistics and Table S2 contains the raw and analyzed data for this figure. See also Figure S5.
Figure 5.
Figure 5.. The interneuron AIY is required for sleep-dependent memory
(A) Diagram of the AWC olfactory circuit. AWC sensory neurons (red) are inhibited by odor. Smallest arrow indicates 1–10 chemical synapses, medium arrow, 10–100 synapses, and largest arrow, more than 100 synapses, (gap junctions not shown). Figure adapted from Gordus et al. (B–E) Calcium transients were visualized using GCaMP3) in the AWCON of a trapped animal as it is exposed to butanone (gray shaded area) or buffer (white). Blue traces are transients in control-trained and red traces are those of butanone-trained animals. Plots show the change in fluorescence immediately before and after the change in stimulus and each point signifies one worm. ns p > 0.05, *p < 0.05, paired t test. (B and C) Transients measured immediately or (D and E) 16 h after training. (F and G) (F) The CIs and (G) LIs of animals missing no neurons (brick), AIBs (blue), AIYs (yellow) or both AIBs and AIYs (orange) immediately (t = 0) or after 16 h after training. ****p < 0.0001, ***p < 0.001, **p < 0.01, *p < 0.05, and ns p > 0.05, one-way ANOVA with Bonferroni’s correction, n > 5 trials. (H) Model: spaced olfactory conditioning induces sleep and memory in C. elegans. Sleep induced by butanone conditioning is ALA-dependent and benefits memory retention. The signal that butanone has been sensed passes from the AWC neuron to interneurons including AIY and AIB. Memory requires AIY, thus we hypothesize that sleep may act on connections between AWC and AIY neurons. All errors are SEM. Table S1 supports the statistics and Table S2 contains the raw and analyzed data for this figure. See also Figure S5.
Figure 6.
Figure 6.. Odor training and sleep result in AWC-AIY synaptic reductions
(A) Schematic of split GFP-based AWC-AIY NLG-1 GRASP marker. Circles represent cross-sections of the AWC and AIY neurites, and one neurite from each neuron pair is represented for simplicity. Split GFP fragments are linked to the pre- and post-synaptically localized protein NLG-1 (neuroligin 1) and expressed in the AWC and AIY neurons with the selective promoters podr-1 and pttx-3. When synapses form between the neurons, the split GFPs come in contact, reconstitute, and fluoresce.White circles indicate a presynaptic site, and crosshatching represents a post-synaptic site. (B) Schematic of the head of an animal in which NLG-1 GRASP labels synapses between the AWC (red) and AIY (beige) neurites in the nerve ring, which forms an arch in the head of the animal. (C) Schematic and micrographs of an animal carrying the AWC-AIY NLG-1 GRASP marker with the AWC neurons labeled in red with the cytosolic mCherry fluorophore. Synaptic fluorescence is observed in a punctate pattern in AWC axons in the nerve ring. The area in the gray box is expanded in the rightmost image. (D) Micrographs of AWC-AIY NLG-1 GRASP fluorescence 16 h after training with control buffer (Buff) or butanone (Btn) in which sleep was not disrupted after training (left two micrographs), and in which sleep was disrupted by mechanical disturbance for the first 2 h after training (right two micrographs). (E) Micrographs of AWC-AIY NLG-1 GRASP fluorescence 16 h after training with control buffer or butanone in which sleep was not disrupted after training (left two micrographs), and in which sleep was disrupted by removal from food for the first 2 h after training (right two micrographs). (C–E) Scale bars are 1 micron. (F) Quantification of the reduction in AWC-AIY NLG-1 GRASP fluorescence intensity in animals trained with butanone whose sleep was not disrupted, in comparison with animals whose sleep was disrupted by mechanical disturbance and animals trained with control buffer. (G) Quantification of the reduction in AWC-AIY NLG-1 GRASP fluorescence intensity in animals trained with butanone whose sleep was not disrupted, in comparison with animals whose sleep was disrupted by removal from food and animals trained with control buffer. (F and G) Animals were imaged were from populations of buffer-trained or sleep-deprived animals that chemotaxed to butanone (CI > 0.5) or butanone-trained populations allowed to sleep that did not chemotaxis to butanone (CI < 0.5). n > 90 for each box and includes animals trained on four different days. NS p > 0.05, *p < 0.05, ***p < 0.001, Mann-Whitney U test. p values were adjusted for multiple comparisons using the Hochberg procedure. Figure S6 and Tables S3 and S4 support this figure.
Figure 7.
Figure 7.. AWC-AIY synapses are altered during and after sleep
(A) Micrographs of AWC-AIY NLG-1 GRASP fluorescence in animals trained with butanone (Btn) or control buffer (Buff) at 0, 2, and 16 h after training without sleep disruption. Scale bar is 1 micron. (B) Quantification of AWC-AIY NLG-1 GRASP fluorescence intensity at 0, 2, and 16 h post-training in buffer-trained and butanone-trained animals whose sleep was not disrupted. N > 75 for each box and includes animals trained on four different days. NS p > 0.05, *p < 0.05, **p < 0.01 and ***p < 0.001, Mann-Whitney U test. p values were adjusted for multiple comparisons using the Hochberg procedure. Animals were imaged were from populations of buffer-trained animals that chemotaxed to butanone (CI > 0.5) or butanone-trained populations that did not chemotaxis to butanone (CI < 0.5) (Figure S7F). Figure S7 and Tables S3 and S4 support this figure.

Comment in

References

    1. Jenkins JG, and Dallenbach KM (1924). Obliviscence during sleep and waking. Am. J. Psychol 35, 605–612. 10.2307/1414040. - DOI
    1. Crocker A, and Sehgal A (2010). Genetic analysis of sleep. Genes Dev 24, 1220–1235. - PMC - PubMed
    1. Walker MP, Brakefield T, Morgan A, Hobson JA, and Stickgold R (2002). Practice with sleep makes perfect: sleep-dependent motor skil learning. Neuron 35, 205–211. - PubMed
    1. Impey S, Smith DM, Obrietan K, Donahue R, Wade C, and Storm DR (1998). Stimulation of cAMP response element (CRE)-mediate transcription during contextual learning. Nat. Neurosci 1, 595–601. - PubMed
    1. Stubley-Weatherly L, Harding JW, and Wright JW (1996). Effects o discrete kainic acid-induced hippocampal lesions on spatial and contextual learning and memory in rats. Brain Res. 716, 29–38. - PubMed

Publication types

LinkOut - more resources