. 2023 Jul;299(7):104879.
doi: 10.1016/j.jbc.2023.104879. Epub 2023 Jun 1.

The role of microglial LRRK2 kinase in manganese-induced inflammatory neurotoxicity via NLRP3 inflammasome and RAB10-mediated autophagy dysfunction

Affiliations

The role of microglial LRRK2 kinase in manganese-induced inflammatory neurotoxicity via NLRP3 inflammasome and RAB10-mediated autophagy dysfunction

Edward Pajarillo et al. J Biol Chem. 2023 Jul.

Abstract

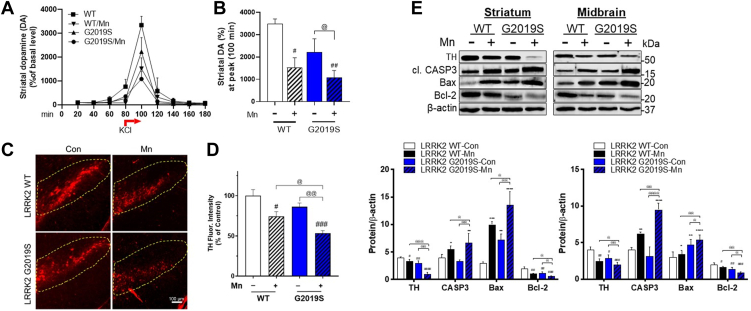
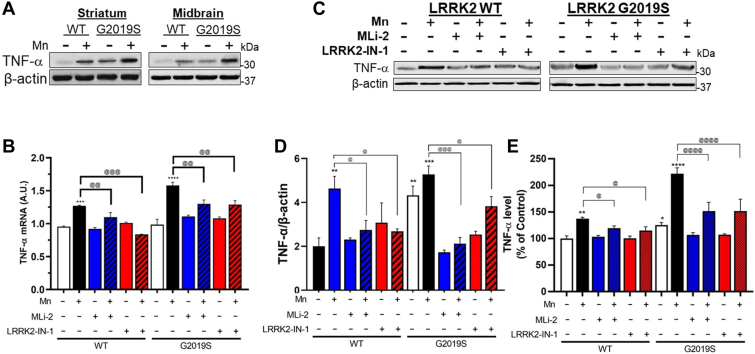
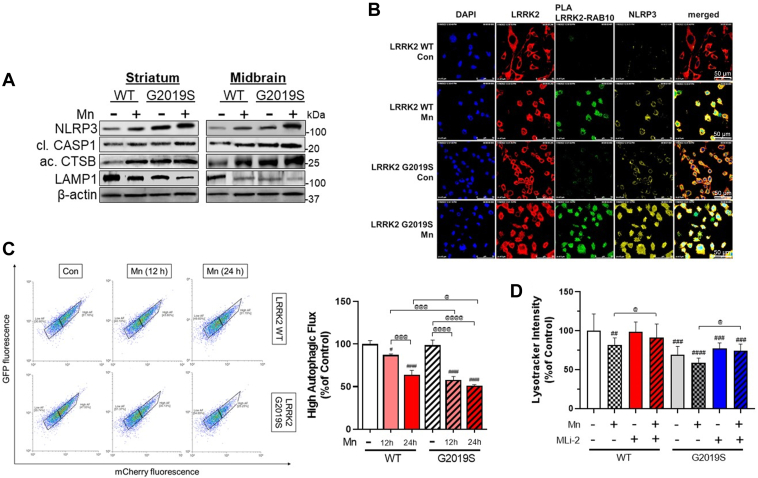
Chronic manganese (Mn) exposure can lead to manganism, a neurological disorder sharing common symptoms with Parkinson's disease (PD). Studies have shown that Mn can increase the expression and activity of leucine-rich repeat kinase 2 (LRRK2), leading to inflammation and toxicity in microglia. LRRK2 G2019S mutation also elevates LRRK2 kinase activity. Thus, we tested if Mn-increased microglial LRRK2 kinase is responsible for Mn-induced toxicity, and exacerbated by G2019S mutation, using WT and LRRK2 G2019S knock-in mice and BV2 microglia. Mn (30 mg/kg, nostril instillation, daily for 3 weeks) caused motor deficits, cognitive impairments, and dopaminergic dysfunction in WT mice, which were exacerbated in G2019S mice. Mn induced proapoptotic Bax, NLRP3 inflammasome, IL-1β, and TNF-α in the striatum and midbrain of WT mice, and these effects were more pronounced in G2019S mice. BV2 microglia were transfected with human LRRK2 WT or G2019S, followed by Mn (250 μM) exposure to better characterize its mechanistic action. Mn increased TNF-α, IL-1β, and NLRP3 inflammasome activation in BV2 cells expressing WT LRRK2, which was elevated further in G2019S-expressing cells, while pharmacological inhibition of LRRK2 mitigated these effects in both genotypes. Moreover, the media from Mn-treated G2019S-expressing BV2 microglia caused greater toxicity to the cath.a-differentiated (CAD) neuronal cells compared to media from microglia expressing WT. Mn-LRRK2 activated RAB10 which was exacerbated in G2019S. RAB10 played a critical role in LRRK2-mediated Mn toxicity by dysregulating the autophagy-lysosome pathway and NLRP3 inflammasome in microglia. Our novel findings suggest that microglial LRRK2 via RAB10 plays a critical role in Mn-induced neuroinflammation.

Keywords: G2019S; LRRK2; NLRP3 inflammasome; RAB10; autophagy; inflammation; lysosome; manganese; microglia.


Conflict of interest statement

Conflict of interest The authors declare no conflicts of interest with the contents of this article.

Figures

Figure 1
Figure 1
Mn-induced movement impairment and locomotor deficits is further worsened in mice with enhanced LRRK2 kinase activity (LRRK2 G2019S KI).AD, After Mn exposure (MnCl2, 30 mg/kg, intranasal instillation, daily for 3 weeks), locomotor activity was measured by open-field traces (A), total distance traveled (B), walking speed (C), and vertical activity count (D). The mouse’s movement is depicted by traces and red dots indicate the location of vertical activity in the open-field arena. E, Motor coordination is measured by fall latency as time spent on the rotating rod. #p < 0.05, ##p < 0.01, ###p < 0.001, compared with the controls; @p < 0.05, @@p < 0.01, @@@p < 0.001, compared with each other (two-way ANOVA followed by Tukey’s post hoc test; n = 5). Data are expressed as mean ± SD.
Figure 2
Figure 2
Mn-induced cognitive impairment is exacerbated in LRRK2 G2019S mice.AC, After Mn exposure (MnCl2, 30 mg/kg, intranasal instillation, daily for 3 weeks), NO recognition was evaluated as described in the Experimental procedures section. A, NO recognition in mice was assessed by comparing the time spent on the NO (bottom-right) compared to the FO (top-left). Traces in the arena depict the mouse’s movement and interaction with FO and NO over a 10-min period. Red dots on the FO and NO shows a point of exploration with an object. BC, The time spent in each object in the open-field arena was used to calculate the NO exploration time (B) and discrimination index (C). #p < 0.05, ###p < 0.001, compared with the controls; @p < 0.05, @@p < 0.01, compared with each other (two-way ANOVA followed by Tukey’s post hoc test; n = 5). Data are expressed as mean ± SD.
Figure 3
Figure 3
Mn-induced dysfunction of nigrostriatal dopaminergic pathway is greater in LRRK2 G2019S than in WT mice.A and B, After acute Mn exposure, extracellular dopamine levels in the mouse striatum were measured by microdialysis and HPLC-ECD, as described in the Experimental procedures section. A, Extracellular dopamine release was stimulated after 100 mM KCl, for dopamine release for 20 min between 80 to 100 min intervals. B, Striatal dopamine levels were compared among different groups. C, After Mn exposure (MnCl2, 30 mg/kg, intranasal instillation, daily for 3 weeks), coronal sections of the substantia nigra were immunostained for TH proteins by IHC as described in the Experimental procedures section. D, TH fluorescence intensities were compared among different treatment groups. E, After Mn exposure (MnCl2, 30 mg/kg, intranasal instillation, daily for 3 weeks), protein levels of TH, cleaved caspase-3, Bcl-2, and Bax were measured in the striatum and midbrain. β-actin was used as a loading control for protein. p < 0.05, ∗∗p < 0.01, ∗∗∗p < 0.001, ∗∗∗∗p < 0.0001, #p < 0.05, ##p < 0.01, ###p < 0.001, ####p < 0.0001, compared with the controls; @p < 0.05, @@p < 0.01, @@@p < 0.001, @@@@p < 0.0001, compared with each other (two-way ANOVA followed by Tukey’s post hoc test; n =3–5). Data are expressed as mean ± SD.
Figure 4
Figure 4
Mn increased microglial LRRK2 expression and LRRK2 activity in the mouse nigrostriatal region.A and B, After Mn exposure (MnCl2, 30 mg/kg, intranasal instillation, daily for 3 weeks), protein levels of LRRK2 and Iba1 were analyzed in the striatum and midbrain regions of mouse brains by Western blotting (A) and IHC of the substantia nigra region (B). A, Protein levels of LRRK2 and Iba1 in striatum and midbrain of Mn-treated WT and G2019S mice. B, Expression and colocalization of LRRK2 and Iba1, a microglial marker, were visualized with red and green fluorescence signals, respectively. White arrows depict the co-localization of LRRK2 and Iba1. C and D, PLA for protein-protein interactions of LRRK2 with RAB10 (C) and LRRK2 with 14-3-3ε (D) in the substantia nigra was visualized with red fluorescence signals. Insets show a higher magnification of the PLA puncta in the substantia nigra region. Yellow arrows depict PLA fluorescence signals showing the interaction of LRRK2 with RAB10 or 14-3-3ε that do not overlap with DAPI. β-actin was used as a loading control for protein. p < 0.05, ∗∗p < 0.01, ∗∗∗p < 0.001, ∗∗∗∗p < 0.0001, compared with the controls; @p < 0.05, @@@p < 0.001, @@@@p < 0.0001, compared with each other (two-way ANOVA followed by Tukey’s post hoc test; n = 3). Data are expressed as mean ± SD.
Figure 5
Figure 5
Mn further increases LRRK2 kinase activity in LRRK2 G2019S-expressing BV2 microglia cells.A and B, Validation of transfection of vectors for LRRK2 WT and G2019S in BV2 microglia. A, Fluorescence imaging of LRRK2 (red) in non-transfected control, LRRK2 WT-, and G2019S-expressing (green) BV2 cells. B, Levels of LRRK2 phosphorylation (p-LRRK2, S1292) and protein in BV2 cells. Following LRRK2 WT and G2019S overexpression, LRRK2 inhibitors MLi-2 (50 nM, 0.5 h) and LRRK2-IN-1 (10 nM, 0.5 h) pre-treatment and Mn exposure, BV2 cells were analyzed for phosphorylation of LRRK2 at S1292 and RAB10 at T73 using western blotting. CE, Mn increased LRRK2 and RAB10 phosphorylation in LRRK2 WT BV2 cells, which were exacerbated in LRRK2 G2019S BV2 cells. Quantification of LRRK2 (D) and RAB10 (E) phosphorylation in BV2 cells. MLi-2 and LRRK2-IN-1 were used as LRRK2 inhibitors. β-actin was used as a loading control for protein. p < 0.05, ∗∗p < 0.01, ∗∗∗∗p < 0.0001, #p < 0.05, ##p < 0.01, compared with the controls; @p < 0.05, @@p < 0.01, @@@@p < 0.0001, compared with each other (two-way ANOVA followed by Tukey’s post hoc test; n = 3). Data are expressed as mean ± SD. The data shown are representative of three independent experiments.
Figure 6
Figure 6
LRRK2 kinase activity plays a role in regulating Mn-induced proinflammatory TNF-α in mice and microglia.A, After Mn exposure (MnCl2, 30 mg/kg, intranasal instillation, daily for 3 weeks), striatum and midbrain regions of mouse brains were analyzed for TNF-α protein levels by western blotting. BE, Following LRRK2 inhibitors MLi-2 (50 nM, 0.5 h) and LRRK2-IN-1 (10 nM, 0.5 h) pre-treatment and Mn exposure (250 μM, 12 h), LRRK2 WT- and G2019S-expressing BV2 cells were analyzed for TNF-α mRNA (B) and protein levels (C and D) by qPCR and western blotting, respectively. GAPDH and β-actin were used as normalization and loading control for RNA and protein, respectively. E, Protein levels of secreted TNF-α were measured by ELISA. p < 0.05, ∗∗p < 0.01, ∗∗∗p < 0.001, ∗∗∗∗p < 0.0001, compared with the controls; @p < 0.05, @@p < 0.01, @@@p < 0.001, @@@@p < 0.0001, compared with each other (two-way ANOVA followed by Tukey’s post hoc test; n = 3–5). Data are expressed as mean ± SD. The data shown in BV2 cells are representative of three independent experiments.
Figure 7
Figure 7
LRRK2 plays a role in Mn-induced NLRP3-IL-1β inflammasome pathway by modulating lysosomal function in mice and microglia.A, After Mn exposure (MnCl2, 30 mg/kg, intranasal instillation, daily for 3 weeks), striatum and midbrain tissues were analyzed for the protein levels of NLRP3, cleaved CASP1, active CTSB, and LAMP1 by western blotting. B, BV2 cells were examined for protein-protein interactions of LRRK2 with RAB10, fluorescence intensity, and colocalization of NLRP3 and LRRK2, RAB10 in the microglia. C, Following Mn exposure for 12 and 24 h, LRRK2 WT and G2019S BV2 cells were assessed for autophagic flux with LC3-mcherry-GFP fluorescence assay. Cells with high autophagic flux were determined and quantified by red fluorescence using flow cytometry. D, Following pre-treatment of LRRK2 inhibitor MLi-2 (50 nM, 0.5 h) and Mn exposure (250 μM, 12 h), LRRK2 WT and G2019S-expressing BV2 cells were analyzed for lysosomal activity by lysotracker assays. #p < 0.05, ##p < 0.01, ###p < 0.001, ####p < 0.0001, compared with the controls; @p < 0.05, @@p < 0.01, @@@p < 0.001, @@@@p < 0.0001, compared with each other (two-way ANOVA followed by Tukey’s post hoc test; n = 3–5). Data are expressed as mean ± SD. The data shown are representative of three independent experiments.
Figure 8
Figure 8
Mn increased NLRP3 inflammasome activation and proinflammatory IL-1β production via CTSB activity.AC, After transfection of LRRK2 WT and G2019S vectors following Mn exposure, BV2 cells were analyzed for the fluorescence intensity and colocalization of p-RAB10, NLRP3, and CTSB in microglia by immunofluorescence. B, BV2 cells were analyzed for proteins by western blotting. C, Protein levels of NLRP3, cleaved CASP1, mature IL-1β, and active CTSB were quantified in BV2 cells. β-actin was used as a loading control for protein. D, Protein levels of secreted IL-1β in BV2 cell-free media were measured using ELISA. p < 0.05, ∗∗p < 0.01, ∗∗∗p < 0.001, ∗∗∗∗p < 0.0001, compared with the controls; @p < 0.05, @@p < 0.01, @@@p < 0.001, @@@@p < 0.0001, compared with each other (two-way ANOVA followed by Tukey’s post hoc test; n = 3–5). Data are expressed as mean ± SD. The data shown are representative of three independent experiments.
Figure 9
Figure 9
Mn alters lysosomal function in microglia via LRRK2-RAB10 activation. BV2 cells were transfected with RAB10 and DN-RAB10 vectors to modulate RAB10 function, followed by exposure to Mn (250 μM, 12 h). A, Validation of RAB10 and DN-RAB10 transfection in BV2 cells visualized with GFP fluorescence. B and C, After Mn exposure, RAB10- and DN-RAB10-expressing BV2 cells were analyzed for proteins by western blotting. B, Proteins for p-RAB10, RAB10, p-LRRK2, and LRRK2 were determined in RAB10- and DN-RAB10-expressing BV2 cells. C and D, Following MLi-2 (50 nM, 0.5 h) pre-treatment and Mn exposure (250 μM, 12 h), RAB10- and DN-RAB10-expressing BV2 cells were assessed for cell viability (C) and lysosomal activity (D) and by resazurin and lysotracker assays, respectively. E, Proteins for NLRP3, cleaved CASP1, LAMP1, active CTSB, and mature IL-1β were assessed in RAB10- and DN-RAB10-expressing BV2 cells after MLi-2 (50 nM, 0.5 h) pre-treatment and Mn exposure (250 μM, 12 h). ##p < 0.01, ####p < 0.0001, compared with the controls; @p < 0.05, @@p < 0.01, @@@p < 0.001, compared with each other (two-way ANOVA followed by Tukey’s post hoc test; n = 5). Data are expressed as mean ± SD. The data shown are representative of three independent experiments.
Figure 10
Figure 10
Microglial LRRK2 kinase activity mediates Mn-induced cytotoxicity in catecholaminergic neuron-like cells using a microglia-neuron co-culture.A, BV2 cells were transfected with LRRK2 WT and G2019S vectors to modulate LRRK2 kinase activity, followed by LRRK2 inhibitors MLi-2 (50 nM, 0.5 h) and LRRK2-IN-1 (10 nM, 0.5 h) pre-treatment and Mn exposure (250 μM). After Mn exposure for 6 h, BV2 experimental media were replaced with fresh media and incubated for an additional 6 h prior to media collection as described in the Methods. These CM were applied to differentiated CAD cells. After CM exposure (12 h for cell viability; 3 h for ROS), CAD cells were analyzed for cell viability was determined by resazurin assays (B) and ROS levels by CM-H2DCFDA fluorescence (C, imaging; D, quantification). ∗∗∗p < 0.001, ∗∗∗∗p < 0.0001, ###p < 0.001, ####p < 0.0001, compared with the controls; @p < 0.05, @@@p < 0.001, compared with each other (two-way ANOVA followed by Tukey’s post hoc test; n = 6). Data are expressed as mean ± SD. The data shown are representative of three independent experiments.
Figure 11
Figure 11
Mn-induced apoptosis is exacerbated by enhanced LRRK2 kinase activity in microglia. BV2 cells were transfected with LRRK2 WT and G2019S vectors to modulate LRRK2 kinase activity, followed by exposure to Mn (250 μM). A, After treatment with LRRK2 inhibitors MLi-2 (50 nM, 0.5 h) and LRRK2-IN-1 (10 nM, 0.5 h) and Mn exposure (250 μM, 12 h) of BV2 cells for 24 h (for cell viability), cell viability was determined by resazurin assays. B and C, After transfection with LRRK2 WT and G2019S, followed by LRRK2 inhibitors MLi-2 (50 nM, 0.5 h) and LRRK2-IN-1 (10 nM, 0.5 h) pre-treatment, and Mn exposure, protein levels for Bcl-2, Bax, active caspase-3 were analyzed by western blotting in BV2 cells. C, Quantification of Bax/Bcl-2 ratio and active CASP3 in LRRK2 WT and G2019S were compared. β-actin was used as a loading control for protein. ∗∗p < 0.01, ∗∗∗p < 0.001, ∗∗∗∗p < 0.0001, ###p < 0.001, ####p < 0.0001, compared with the controls; @p < 0.05, @@p < 0.01, @@@p < 0.001, @@@@p < 0.0001 compared with each other (two-way ANOVA followed by Tukey’s post hoc test; n = 3–6). Data are expressed as mean ± SD. The data shown are representative of three independent experiments.
Figure 12
Figure 12
Proposed mechanism of LRRK2 kinase activity in Mn-induced NLRP3 inflammasome activation via RAB10 dysfunction in autophagy impairment and lysosomal enzyme leakage. Mn increases LRRK2 kinase activity, leading to autophosphorylation and phosphorylation of its target substrate, RAB10. RAB10 dysfunction contributes to Mn-induced autophagy impairment, reducing lysosomal membrane integrity and causing lysosomal cathepsin B (CTSB) leakage. The increased CTSB co-localizes and activates the NLRP3 inflammasome, resulting in the CASP1-mediated maturation of interleukin-1β (IL-1β) and subsequent neurotoxicity. This proposed mechanism provides insight into the potential role of LRRK2 kinase activity in Mn-induced neuroinflammation and highlights potential therapeutic targets for treating Mn-induced neurotoxicity.

Update of

References

    1. Pajarillo E., Johnson J., Jr., Rizor A., Nyarko-Danquah I., Adinew G., Bornhorst J., et al. Astrocyte-specific deletion of the transcription factor Yin Yang 1 in murine substantia nigra mitigates manganese-induced dopaminergic neurotoxicity. J. Biol. Chem. 2020;295:15662–15676. - PMC - PubMed
    1. Robison G., Sullivan B., Cannon J.R., Pushkar Y. Identification of dopaminergic neurons of the substantia nigra pars compacta as a target of manganese accumulation. Metallomics. 2015;7:748–755. - PMC - PubMed
    1. Kornblith E.S., Casey S.L., Lobdell D.T., Colledge M.A., Bowler R.M. Environmental exposure to manganese in air: tremor, motor and cognitive symptom profiles. Neurotoxicology. 2018;64:152–158. - PMC - PubMed
    1. Bowler R.M., Roels H.A., Nakagawa S., Drezgic M., Diamond E., Park R., et al. Dose-effect relationships between manganese exposure and neurological, neuropsychological and pulmonary function in confined space bridge welders. Occup. Environ. Med. 2007;64:167–177. - PMC - PubMed
    1. Bowler R.M., Beseler C.L., Gocheva V.V., Colledge M., Kornblith E.S., Julian J.R., et al. Environmental exposure to manganese in air: associations with tremor and motor function. Sci. Total Environ. 2016;541:646–654. - PMC - PubMed

Publication types

MeSH terms

Substances