. 2023 Jun 3;14(1):3236.
doi: 10.1038/s41467-023-39050-y.

Intrinsic TGF-β signaling attenuates proximal tubule mitochondrial injury and inflammation in chronic kidney disease

Affiliations

Intrinsic TGF-β signaling attenuates proximal tubule mitochondrial injury and inflammation in chronic kidney disease

Merve Kayhan et al. Nat Commun. .

Abstract

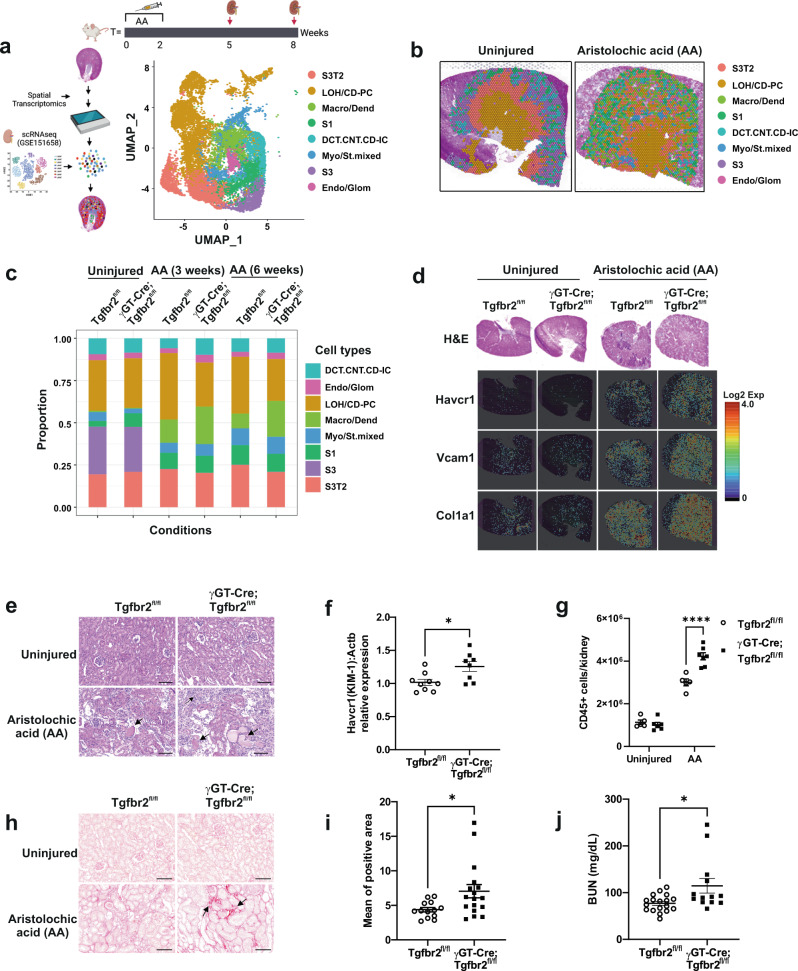
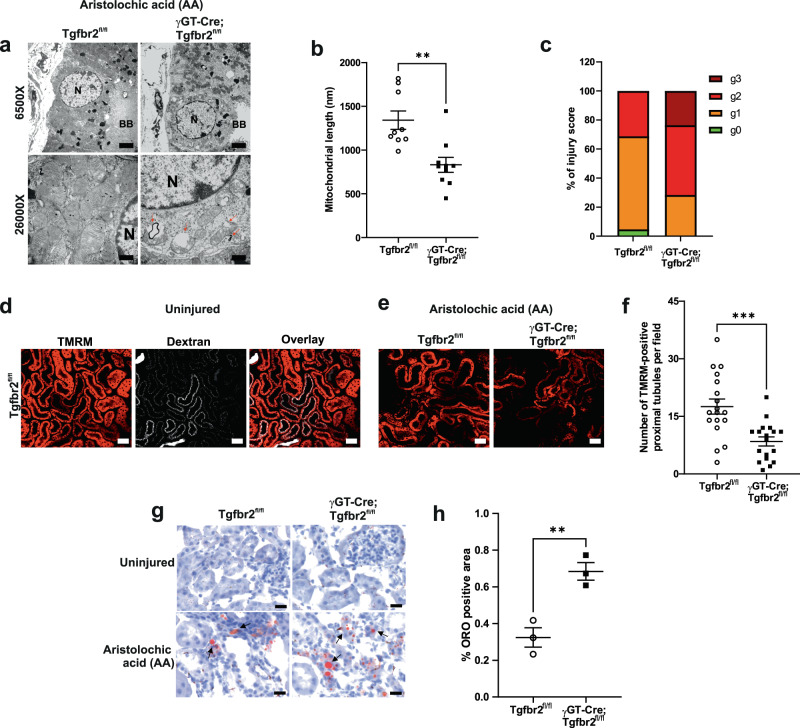
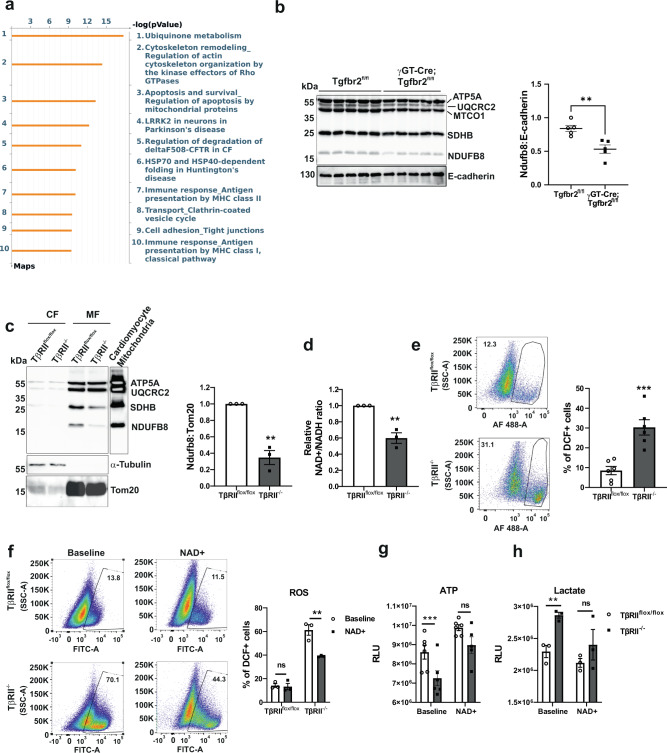
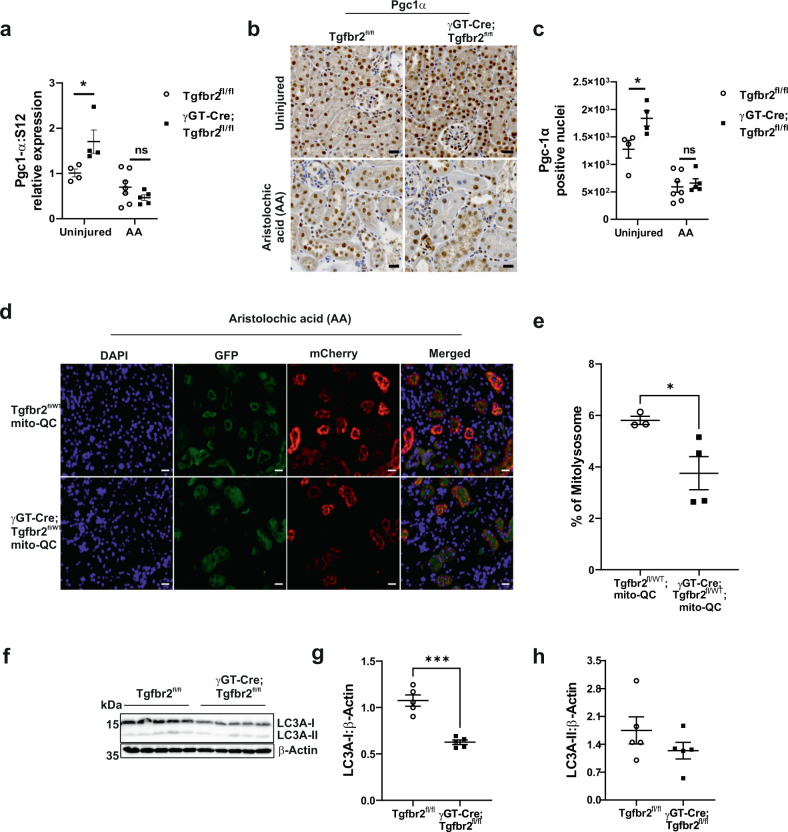
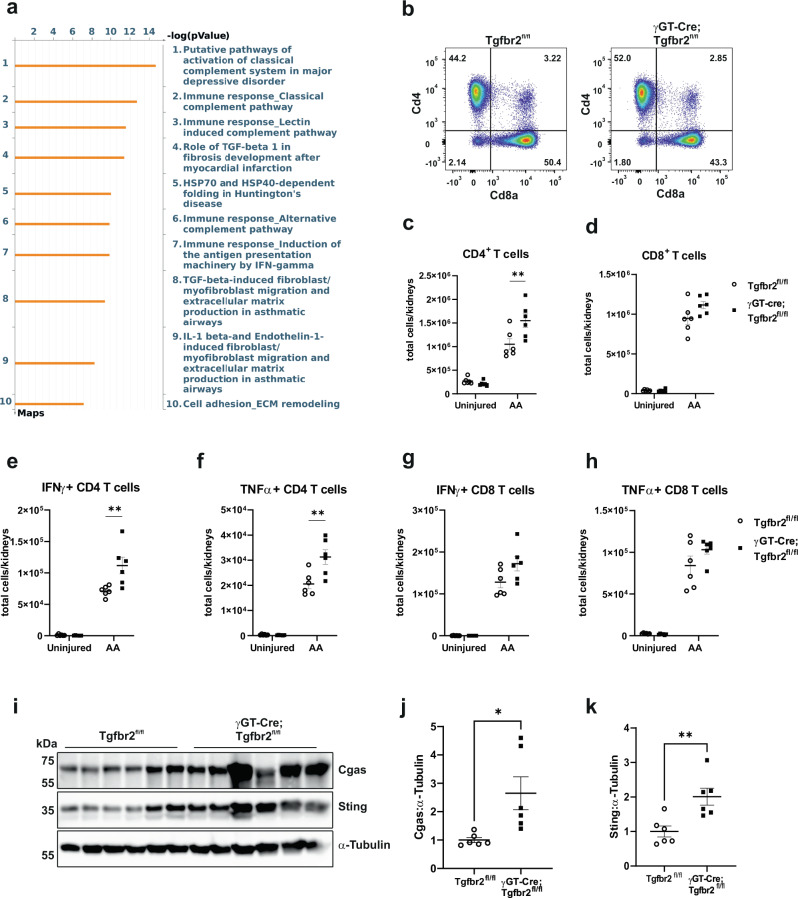
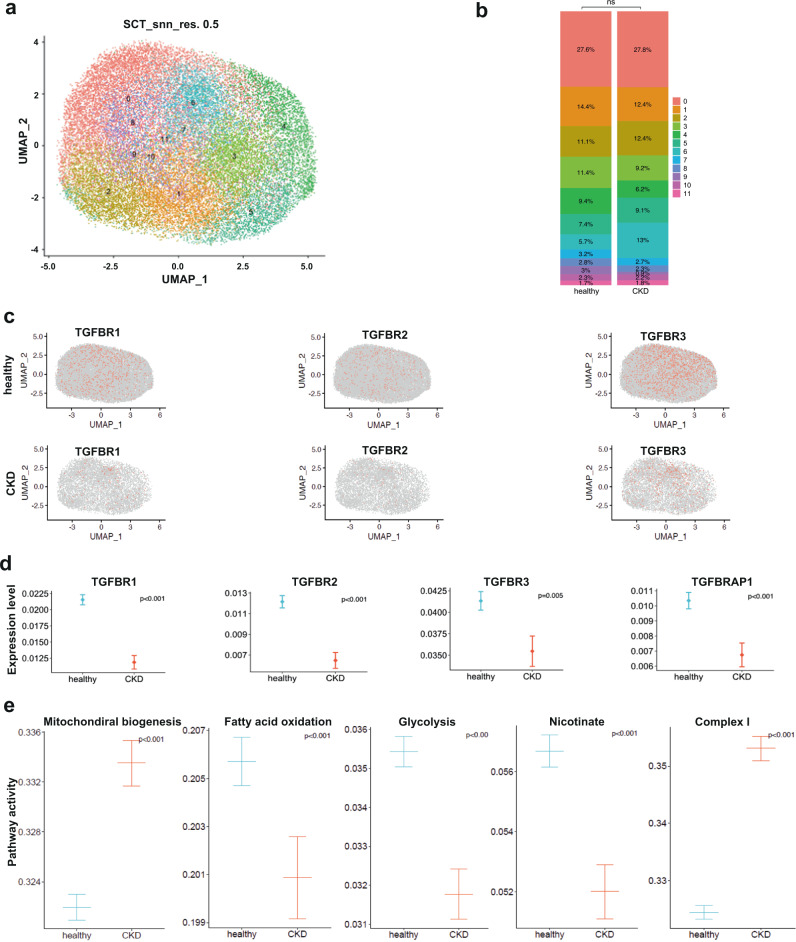
Excessive TGF-β signaling and mitochondrial dysfunction fuel chronic kidney disease (CKD) progression. However, inhibiting TGF-β failed to impede CKD in humans. The proximal tubule (PT), the most vulnerable renal segment, is packed with giant mitochondria and injured PT is pivotal in CKD progression. How TGF-β signaling affects PT mitochondria in CKD remained unknown. Here, we combine spatial transcriptomics and bulk RNAseq with biochemical analyses to depict the role of TGF-β signaling on PT mitochondrial homeostasis and tubulo-interstitial interactions in CKD. Male mice carrying specific deletion of Tgfbr2 in the PT have increased mitochondrial injury and exacerbated Th1 immune response in the aristolochic acid model of CKD, partly, through impaired complex I expression and mitochondrial quality control associated with a metabolic rewiring toward aerobic glycolysis in the PT cells. Injured S3T2 PT cells are identified as the main mediators of the maladaptive macrophage/dendritic cell activation in the absence of Tgfbr2. snRNAseq database analyses confirm decreased TGF-β receptors and a metabolic deregulation in the PT of CKD patients. This study describes the role of TGF-β signaling in PT mitochondrial homeostasis and inflammation in CKD, suggesting potential therapeutic targets that might be used to mitigate CKD progression.


Conflict of interest statement

The authors declare no competing interests.

Figures

Fig. 1
Fig. 1. Tubulo-interstitial remodeling and increased cortical injury and fibrosis in γGT-Cre;Tgfbr2fl/fl mice after AA injury.
a Schemes illustrating AA injury design, integrated data annotation strategy and renal cell types after dataset integration (UMAP plot). S3 type 2 PT cells (S3T2); Loop of Henle and principal cells (LOH/CD-PC); macrophages and dendritic cells (Macro/Dend.); S1 PT cells (S1); distal convoluted tubular, connecting and intercalated cells (DCT.CNT.CD-IC); myofibroblasts and stromal cells (Myo/St. mixed); S3 PT cells (S3); endothelial and glomerular cells (Endo/Glom). b Representative spatial plots of integrated clusters resolved on uninjured and injured kidney slices showing impaired cortico-medullary organization following injury. c Cell type proportions per conditions in the integrated data. d Representative H&E staining and spatial transcriptomics Cloupe browser kidney images with resolution of proximal tubule injury and fibrotic markers at baseline and 3 weeks after AA injury (one uninjured Tgfbr2fl/fl kidney, one uninjured γGT-Cre;Tgfbr2fl/fl kidney, one injured Tgfbr2fl/fl kidney and one injured γGT-Cre;Tgfbr2fl/fl kidney). Scale bars in source data. e Representative H&E images of kidneys from uninjured and 6 weeks AA injured mice. Arrows indicate injured tubules and interstitial cell infiltrate. f Relative Kim-1 mRNA levels in renal cortices 6 weeks after AA injury measured by RT-qPCR using Actb mRNA levels for normalization; n = 9 (Tgfbr2fl/fl) and 8 (γGT-Cre;Tgfbr2fl/fl) mice, p = 0.014. g Quantification of CD45+ cells from uninjured and injured renal leukocytes analyzed by FACS; n = 6 per genotypes of uninjured mice; n = 5 (Tgfbr2fl/fl) and 7 (γGT-Cre;Tgfbr2fl/fl) for injured mice, p < 0.0001. h Sirius red staining of kidneys from uninjured and AA injured mice showing collagen accumulation in red. Arrows indicate fibrotic areas. i Quantification of Sirius red positive area; n = 13 (Tgfbr2fl/fl) and 17 (γGT-Cre;Tgfbr2fl/fl) mice, p = 0.0174 (two-tailed Mann–Whitney test). j Plasma BUN levels measured 6 weeks after AA injury; n = 18 (Tgfbr2fl/fl) and 13 (γGT-Cre;Tgfbr2fl/fl) mice, p = 0.0175 (two-tailed Mann–Whitney test). All scale bars (e and h) represent 100 μm; dots represent the number of animals per group (f, g, i and j). Data are presented as mean values ± SEM. Statistical significance was determined by unpaired Student’s t test (two groups) or two-way ANOVA followed by Sidak’s multiple comparisons test with p < 0.05 considered statistically significant unless otherwise stated. *p < 0.05; ****p < 0.0001. Source data are provided as a Source data file.
Fig. 2
Fig. 2. Increased mitochondrial injury and dysfunction in γGT-Cre;Tgfbr2fl/fl mice 3 weeks after AA injury.
a Representative transmission electron microscopy images showing increased mitochondrial injury (decreased cristae number, increased vacuolization, and myelin figures) in the PT from γGT-Cre;Tgfbr2fl/fl kidneys. Scale bars represent 500 nm; N = nucleus; BB = brush border; arrows highlight vacuolated mitochondria and presence of myelin figures. b, c Quantification of mitochondrial length (n = 9 different areas from 2 different animals per group, p = 0.0014) and injury score (g0: no injury, g1: slight decrease of cristae number or small vacuoles; g2: severe decrease of cristae or big vacuoles formation; g3: severe decrease of cristae, big vacuoles formation and myelin figures) in proximal tubules. The dots represent the mean of PT mitochondria length in the representative cortical area per group. d Representative multiphoton live microscopy images illustrating PT dextran uptake and TMRM incorporation in mitochondria from uninjured kidneys to respectively assess PT absorptive function and mitochondrial membrane potential. Scale bars represent 50 μm. Two groups (4 animals/8 kidneys) were analyzed in two independent experiments. e Representative TMRM images showing decreased mitochondrial membrane potential in the PTs from injured γGT-Cre;Tgfbr2fl/fl. Scale bars represent 50 µm. f Quantification of TMRM in injured PTs. Every dot represents the number of TMRM positive tubules in the field of 900 μm2 (in one capture); n = 2 (Tgfbr2fl/fl) and 2 (γGT-Cre;Tgfbr2fl/fl) mice, p = 0.0004. g Representative image of oil red O staining showing increased lipids deposition (red) in the renal cortex of γGT-Cre;Tgfbr2fl/fl mice. Scale bars represent 50 μm. h Quantification of oil red O positive area in the renal cortex of injured mice; n = 3 (Tgfbr2fl/fl) and 3 (γGT-Cre;Tgfbr2fl/fl) mice, p = 0.0073. The dots represent the number of animals per group in oil red O staining. Data are presented as mean values ± SEM. Statistical significance was determined by unpaired Student’s t test (two groups) with p < 0.05 considered statistically significant. **p < 0.01; ***p < 0.001. Source data are provided as a Source data file.
Fig. 3
Fig. 3. Proximal tubule TβRII deletion disrupts mitochondrial complex I leading to oxidative stress and a metabolic rewiring.
a Metacore pathway analysis of differentially expressed genes in uninjured PT clusters showing the top 10 significantly affected pathways in γGT-Cre;Tgfbr2fl/fl compared to Tgfbr2fl/fl. b Immunoblotting of OXPHOS proteins showing a significant decrease of complex I (NDUFB8) expression in uninjured renal cortices of γGT-Cre;Tgfbr2fl/fl mice compared to their Tgfbr2fl/fl littermates; n = 5 (Tgfbr2fl/fl) and 5 (γGT-Cre;Tgfbr2fl/fl) mice, p = 0.0041. E-cadherin is used as marker of renal parenchyma and loading control. The dots represent the number of animals per group. c Cell fractionation followed by immunoblotting and quantification of OXPHOS proteins showing a significant decrease of complex I (NDUFB8) basal expression in mitochondria of TβRII−/− PT cells (n = 3 independent experiments, p = 0.0015). d Bioluminescence measurement of NAD + /NADH ratios showing a decreased relative ratio in TβRII−/− PT cells (n = 3 independent biological replicates, p = 0.0036). e FACS analysis of DCF-positive cells showing increased basal ROS production in TβRII−/− PT cells (n = 6 independent experiments, p = 0.0006). f NAD+ treatment significantly decreased ROS in TβRII−/− PT cells, assessed with DCF and measured by FACS (n = 3 independent biological replicates, p = 0.0027). g NAD+ treatment increased ATP production in TβRII−/− PT cells to the same level as in TβRIIflox/flox PT cells, measured by a bioluminescence assay (n = 6 independent biological replicates, baseline p = 0.0001 and NAD+ treatment p = 0.4025). h NAD+ treatment decreased lactate production in TβRII−/− PT cells to the level of TβRIIflox/flox PT cells, measured by a bioluminescence assay (n = 3 independent biological replicates, baseline p = 0.0057 and NAD+ treatment p = 0.3175). Data are presented as mean values ± SEM. Statistical significance was determined by unpaired Student’s t test (two groups) or two-way ANOVA followed by Sidak’s multiple comparisons test with p < 0.05 considered statistically significant. *p < 0.05; **p < 0.01; ****p < 0.0001. Source data are provided as a Source data file.
Fig. 4
Fig. 4. Proximal tubule TβRII deletion impairs mitochondrial quality control.
a Relative Pgc1α mRNA levels in renal cortices from uninjured and AA injured (6 weeks) mice, measured by RT-qPCR using S12 as housekeeping control gene; n = 4 uninjured, 7 injured (Tgfbr2fl/fl) and 4 uninjured, 5 injured (γGT-Cre;Tgfbr2fl/fl) mice, uninjured p = 0.05 and injured p = 0.8152. b, c Representative Pgc1α immunohistochemistry (IHC) images and quantification in uninjured and 6 weeks injured renal cortices; n = 4 uninjured, 7 injured (Tgfbr2fl/fl) and 4 uninjured, 5 injured (γGT-Cre;Tgfbr2fl/fl) mice, uninjured p = 0.0436 and injured p = 0.9983. Scale bars represent 20 μm. d, e Representative endogenous fluorescence images and quantification showing decreased mitophagic flux (mCherry) in γGT-Cre;Tgfbr2fl/WT;mito-QC mice compared to Tgfbr2fl/WT;mito-QC mice 6 weeks after AA injury; n = 3 (Tgfbr2fl/WT;mito-QC) and 4 (γGT-Cre;Tgfbr2fl/WT;mito-QC) mice, p = 0.045. Scale bars represent 20 μm. fh LC3A (I/II) immunoblotting and quantification showing significant decrease of LC3A-I expression in γGT-Cre;Tgfbr2fl/fl renal cortices 6 weeks after AA injury; n = 5 (Tgfbr2fl/fl) and 5 (γGT-Cre;Tgfbr2fl/fl) mice, p = 0.0001. Data are presented as mean values ± SEM. Statistical significance was determined by unpaired Student’s t test (two groups) or two-way ANOVA followed by Sidak’s multiple comparisons test, with p < 0.05 considered statistically significant. The dots represent the number of animals per group. *p < 0.05; ***p < 0.001. Source data are provided as a Source data file.
Fig. 5
Fig. 5. Proximal tubule TβRII deletion increases the Th1 inflammatory response 6 weeks after AA injury.
a Metacore pathway analysis of differentially expressed genes in injured PT clusters showing the top 10 significantly affected pathways in γGT-Cre;Tgfbr2fl/fl compared to Tgfbr2fl/fl 6 weeks after AA injury. bd FACS analyses of renal leukocytes showing significant increase of CD4 + T cell number in kidneys of γGT-Cre;Tgfbr2fl/fl mice compared to those from their Tgfbr2fl/fl littermates 6 weeks after AA injury; n = 6 (Tgfbr2fl/fl) and 6 (γGT-Cre;Tgfbr2fl/fl) mice, p = 0.0085. CD8+ T cell numbers were increased in injured Tgfbr2fl/fl compared to γGT-Cre;Tgfbr2fl/fl kidneys, but did not reach statistical significance; n = 6 (Tgfbr2fl/fl) and 6 (γGT-Cre;Tgfbr2fl/fl) mice, p = 0.0984. eh FACS analyses of renal leukocytes showing a significant increase of the number of IFNγ and TNFα producing CD4+ T cells in kidneys of γGT-Cre;Tgfbr2fl/fl mice compared to those from their Tgfbr2fl/fl littermates 6 weeks after AA injury; n = 6 (Tgfbr2fl/fl) and 6 (γGT-Cre;Tgfbr2fl/fl) mice, p = 0.0027 (IFNγ)and p = 0.0016 (TNFα). IFNγ and TNFα producing CD8 + T cell numbers were not statistically different between genotypes; n = 6 (Tgfbr2fl/fl) and 6 (γGT-Cre;Tgfbr2fl/fl) mice, p = 0.0519 (IFNγ) and p = 0.2419 (TNFα). ik Cgas/Sting immunoblotting and quantification showing significantly increased expressions in renal cortices of γGT-Cre;Tgfbr2fl/fl mice compared to those from their Tgfbr2fl/fl littermates 6 weeks after AA injury; n = 6 (Tgfbr2fl/fl) and 6 (γGT-Cre;Tgfbr2fl/fl) mice, Cgas p = 0.185 and Sting p = 0.0061. α-Tubulin was used as loading and blotting control. Data are presented as mean values ± SEM. Statistical significance was determined by unpaired Student’s t test (two groups) or two-way ANOVA followed by Sidak’s multiple comparisons test, with p < 0.05 considered statistically significant. The dots represent the number of animals per group. *p < 0.05; **p < 0.01. Source data are provided as a Source data file.
Fig. 6
Fig. 6. Decreased expression of TGF-β receptors and impaired metabolism in the proximal tubule of CKD patients.
a UMAP plot of normalized data clustering. Numbers represent PT clusters. b Bar plot depicting the proportion of PT cells per clusters in healthy and CKD kidney biopsy datasets. c UMAPs showing TGFBRs (1, 2, and 3) features in healthy and CKD PT cells. d Differential gene expression analysis showing a significant decrease of TGFBRs (1, 2, and 3) and TGFBRAP1 in CKD PT cells as compared to healthy PT cells. e Pathway activity analysis showing impaired mitochondrial biogenesis, complex I activity, and metabolism. N = 5 CKD patients (eGFR<60) and 3 healthy controls. Differential gene expression was evaluated using the Wilcoxon Rank Sum test from the FindMarkers function. Calculation of the pathway scores was performed using REACTOME genesets.

References

    1. Li Y, Sha Z, Peng H. Metabolic reprogramming in kidney diseases: evidence and therapeutic opportunities. Int. J. Nephrol. 2021;2021:5497346. doi: 10.1155/2021/5497346. - DOI - PMC - PubMed
    1. Tinti F, et al. Chronic kidney disease as a systemic inflammatory syndrome: update on mechanisms involved and potential treatment. Life. 2021;11:419. doi: 10.3390/life11050419. - DOI - PMC - PubMed
    1. Amann K, Tyralla K. Cardiovascular changes in chronic renal failure—pathogenesis and therapy. Clin. Nephrol. 2002;58:S62–S72. - PubMed
    1. Bohle A, Kressel G, Muller CA, Muller GA. The pathogenesis of chronic renal failure. Verh. Dtsch. Ges. Pathol. 1989;73:273–300. - PubMed
    1. McMurray JJ, et al. Predictors of fatal and nonfatal cardiovascular events in patients with type 2 diabetes mellitus, chronic kidney disease, and anemia: an analysis of the Trial to Reduce cardiovascular Events with Aranesp (darbepoetin-alfa) Therapy (TREAT) Am. Heart J. 2011;162:748–755.e743. doi: 10.1016/j.ahj.2011.07.016. - DOI - PubMed

Publication types

MeSH terms

Substances