. 2023 Jun 3;14(1):3235.
doi: 10.1038/s41467-023-38867-x.

Sequential intrahost evolution and onward transmission of SARS-CoV-2 variants

Collaborators, Affiliations

Sequential intrahost evolution and onward transmission of SARS-CoV-2 variants

Ana S Gonzalez-Reiche et al. Nat Commun. .

Abstract

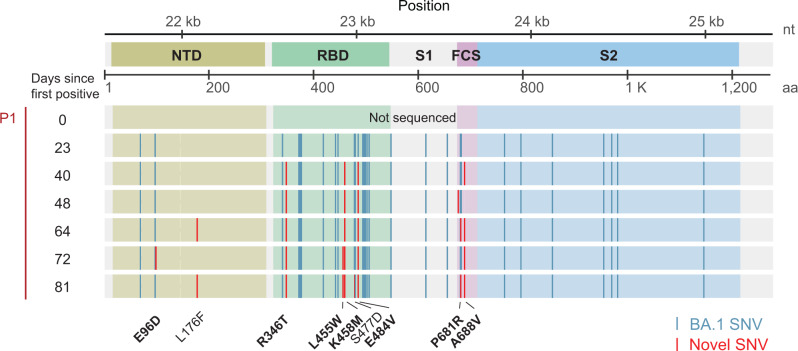
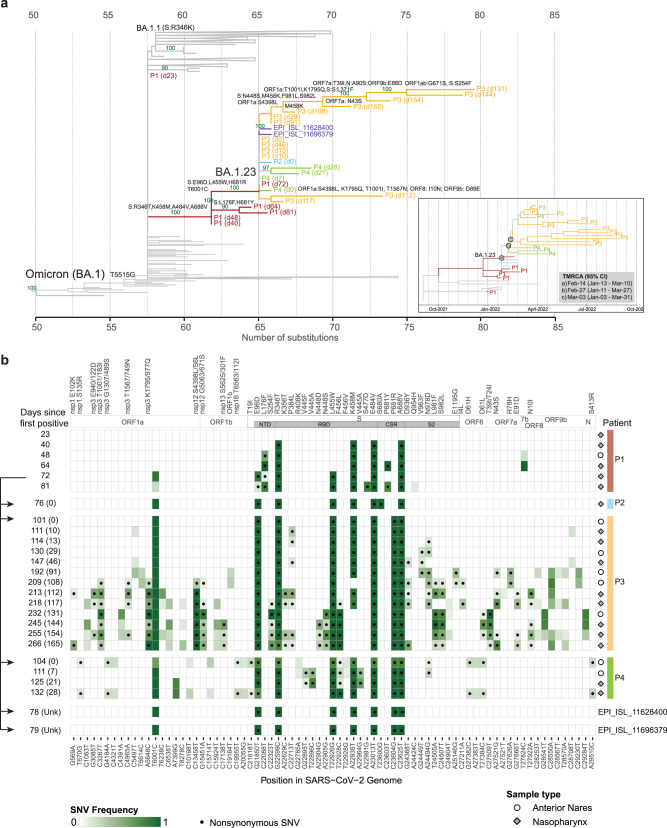
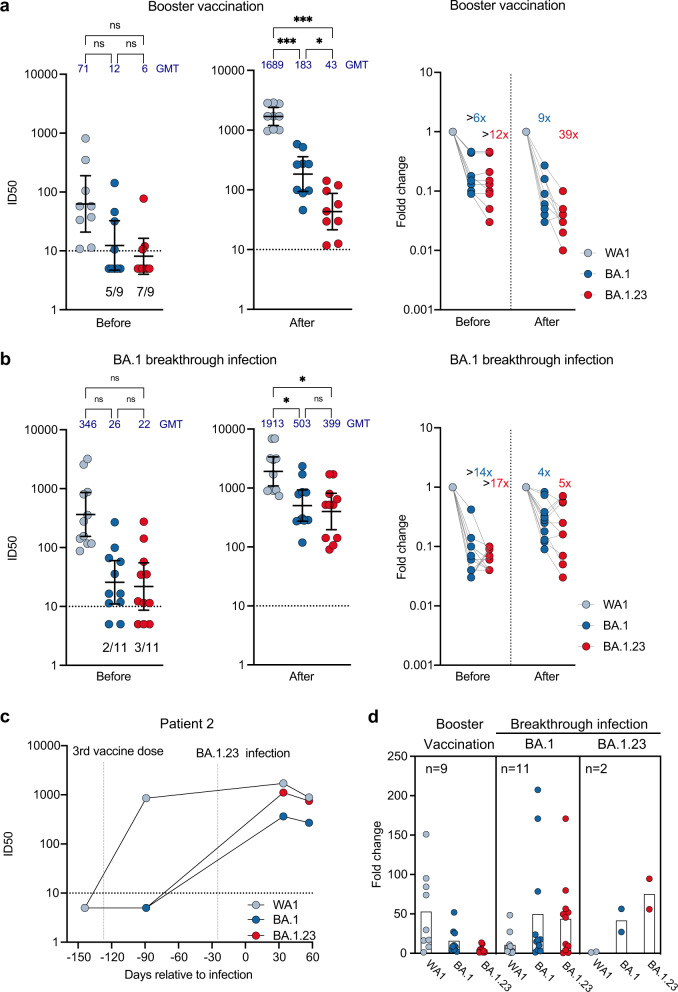
Persistent severe acute respiratory syndrome coronavirus 2 (SARS-CoV-2) infections have been reported in immune-compromised individuals and people undergoing immune-modulatory treatments. Although intrahost evolution has been documented, direct evidence of subsequent transmission and continued stepwise adaptation is lacking. Here we describe sequential persistent SARS-CoV-2 infections in three individuals that led to the emergence, forward transmission, and continued evolution of a new Omicron sublineage, BA.1.23, over an eight-month period. The initially transmitted BA.1.23 variant encoded seven additional amino acid substitutions within the spike protein (E96D, R346T, L455W, K458M, A484V, H681R, A688V), and displayed substantial resistance to neutralization by sera from boosted and/or Omicron BA.1-infected study participants. Subsequent continued BA.1.23 replication resulted in additional substitutions in the spike protein (S254F, N448S, F456L, M458K, F981L, S982L) as well as in five other virus proteins. Our findings demonstrate not only that the Omicron BA.1 lineage can diverge further from its already exceptionally mutated genome but also that patients with persistent infections can transmit these viral variants. Thus, there is, an urgent need to implement strategies to prevent prolonged SARS-CoV-2 replication and to limit the spread of newly emerging, neutralization-resistant variants in vulnerable patients.


Conflict of interest statement

The Icahn School of Medicine at Mount Sinai has filed patent applications relating to SARS-CoV-2 serological assays (U.S. Provisional Application Numbers: 62/994,252, 63/018,457, 63/020,503 and 63/024,436) and NDV-based SARS-CoV-2 vaccines (U.S. Provisional Application Number: 63/251,020) which list Florian Krammer as co-inventor. Viviana Simon is also listed on the serological assay patent application as co-inventor. Patent applications were submitted by the Icahn School of Medicine at Mount Sinai. Mount Sinai has spun out a company, Kantaro, to market serological tests for SARS-CoV-2. Florian Krammer has consulted for Merck and Pfizer (before 2020), and is currently consulting for Pfizer, Third Rock Ventures, Seqirus and Avimex. The Krammer laboratory is also collaborating with Pfizer on animal models of SARS-CoV-2. Robert Sebra is currently a paid consultant and stockholder of GeneDx.

Figures

Fig. 1
Fig. 1. Intrahost emergence of an Omicron BA.1.23 subvariant.
Multiple sequence alignment of the SARS-CoV-2 spike gene indicating the appearance of single nucleotide variants (SNVs) in the consensus sequence of the spike gene in sequential specimens obtained from the index case (Patient 1, P1). Novel SNVs relative to the ancestral BA.1 strain are shown in red and labeled at the bottom of the figure. Bold labels denote signature mutations observed in multiple specimens. Consensus changes in BA.1 compared to the Wuhan-1 strain are shown in blue.
Fig. 2
Fig. 2. Forward transmission of the Omicron BA.1.23 subvariant.
a Maximum likelihood (ML) phylogenetic subtree with SARS-CoV-2 (BA.1) sequences from the persistent infection case P1 (red) and the onward transmissions (P2, P3, P4 in cyan, yellow and green respectively), in a global background of sequences available in GISAID. Branches are colored to identify each patient. The number of days after the first SARS-CoV-2 positive specimen of P1 is indicated in brackets. Sibling clusters are collapsed for easier visualization. The x-axis shows the number of nucleotide substitutions relative to the root of the phylogenetic tree. Bootstrap support values above 70% are shown for the un-collapsed branches. The distinct BA.1 subvariant that was transmitted was designated as PANGO lineage BA.1.23. The bottom-right insert shows a time-scaled ML phylogeny and the estimates for the time of the most recent ancestors (TMRCA) and 95% confidence intervals, for the nodes where the transmissions from the index case are positioned. b Frequency of single nucleotide variants (SNV), and amino acid substitutions for SARS-CoV-2 genomic positions with consensus changes from ancestral Wuhan-1 and Omicron BA.1. Positions with mixed nucleotides below consensus levels are also shown for intrahost SNVs (miSNVs) seen in more than one time point. The sequenced specimens are shown sequentially for P1 with prolonged BA.1 infection and transmission cases of BA.1.23 (P2, P3 and P4). The viral genomes from P1 show progressive accumulation of mutations in the N-terminal domain (NTD), receptor binding domain (RBD), and S1/S2 furin cleavage site (FCS); The same constellation of mutations was subsequently detected in three documented transmission cases (P2, P3 and P4). The number of days since the first positive test in P1 is shown on the left, with the number of days after the first positive test for each patient between brackets. Positions with nonsynonymous SNVs are marked by filled circles. Specimen type is indicated on the right by open circles (anterior nares) or filled diamonds (nasopharynx). Positions are numbered according to the reference genome sequence NC_045512.2. Arrows on the left indicate the likely window of transmission from the index patient between days 64–72. Source data is provided in the Source Data file.
Fig. 3
Fig. 3. Timeline of BA.1.23 evolution compared to antibody levels and treatments.
a The timeline of BA.1.23 infected patients’ positive (red croses) or negative (open blue circles) nucleic acid amplification test (NAAT) for SARS-CoV-2 (top). The N gene target cycle threshold (Ct) values for respiratory specimens, for different diagnostic methods is shown (bottom panel). The NAAT panel only includes data points from positive tests that reported a Ct value. b Number of nucleotide substitutions in the consensus sequence relative to Omicron BA.1 in the sequenced specimens. c SARS-CoV-2 spike-binding IgG antibody levels for P1–P4. Antibody levels are shown in arbitrary units per mL (Arb. units/mL). Documented vaccine administrations are indicated. d Timeline of SARS-CoV-2 antiviral treatments received by P1–P4. Treatment duration is indicated by the length of the bar. Source data provided in the Source Data file.
Fig. 4
Fig. 4. The Omicron BA.1.23 subvariant displays strongly reduced neutralizing activity compared to the parental Omicron variant as well as ancestral SARS-CoV-2 variant.
a Absolute neutralization titers (left) and fold-reduction (right) for WA−1, BA.1 and BA.1.23 variants by paired sera from 9 study participants collected before and after booster vaccination (n = 18). The number of samples with titers below the limit of detection of the serological assay (dashed line) is indicated at the bottom of the graph. The error bars represent the geometric mean with 95% confidence intervals. A one-way RM ANOVA with Tukey’s multiple comparison test was used to compare the neutralization titers before and after booster vaccination. ***p-values < 0.001, *p-value: 0.02. b Absolute neutralization titers (left) and fold-reduction (right) for WA-1, BA.1 and BA.1.23 isolates by sera from study participants who experienced breakthrough infection with BA.1. Data for paired sera from 11 participants collected before and after BA.1 infection (n = 22) are shown. The error bars represent the geometric mean with 95% confidence intervals. A one-way RM ANOVA with Tukey’s multiple comparison test was used to compare the neutralization titers before and after BA.1 breakthrough infection. *p-values: 0.02, ns not significant. c Absolute neutralization titers for each of the isolates (WA-1, BA.1 and BA.1.23) by sera collected from patient P2 before and after BA1.23 infection. The first vertical dotted line (left) represents the time of the third vaccine dose as days relative to the index case. The second vertical dotted line (right) indicates the time of infection with the BA.1.23 variant. d Comparison of neutralization fold-change in inhibitory dilution 50% (ID50) measured before and after booster vaccination (left panel, based on 4a) as well as before and after BA.1 (middle panel, based on 4b) and BA.1.23 (right panel, patient 2, based on 4c) breakthrough infection for each of the three viruses tested (WA-1, BA.1 and BA.1.23). Each dot represents IC50 or fold-change data for a specific serum specimen tested by serial dilution in a single replicate experimental setting. GMT denotes mean geometric mean of the inhibitory dilution 50% (ID50) values. The horizontal dotted line represents the limit of detection (10). Samples with neutralization titers below the level of detection were assigned the neutralization value of 5 (equaling to half of the limit of detection) in the ID50 plots. Source data for this figure is provided in the Source Data file.

References

    1. Nextstrain build for novel coronavirus SARS-CoV-2 (2020).
    1. DeGrace MM, et al. Defining the risk of SARS-CoV-2 variants on immune protection. Nature. 2022;605:640–652. doi: 10.1038/s41586-022-04690-5. - DOI - PMC - PubMed
    1. Flemming A. Omicron, the great escape artist. Nat. Rev. Immunol. 2022;22:75. doi: 10.1038/s41577-022-00676-6. - DOI - PMC - PubMed
    1. Plante JA, et al. The variant gambit: COVID-19’s next move. Cell Host Microbe. 2021;29:508–515. doi: 10.1016/j.chom.2021.02.020. - DOI - PMC - PubMed
    1. VanBlargan LA, et al. An infectious SARS-CoV-2 B.1.1.529 Omicron virus escapes neutralization by therapeutic monoclonal antibodies. Nat. Med. 2022;28:490–495. doi: 10.1038/s41591-021-01678-y. - DOI - PMC - PubMed

Publication types

Substances

Supplementary concepts