. 2023 Jun 3;14(1):3217.
doi: 10.1038/s41467-023-39031-1.

Improvement of cryo-EM maps by simultaneous local and non-local deep learning

Affiliations

Improvement of cryo-EM maps by simultaneous local and non-local deep learning

Jiahua He et al. Nat Commun. .

Abstract

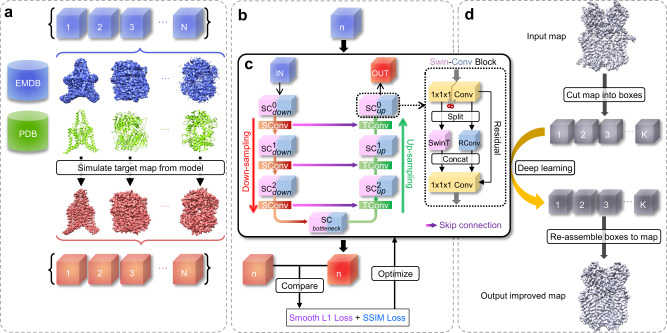
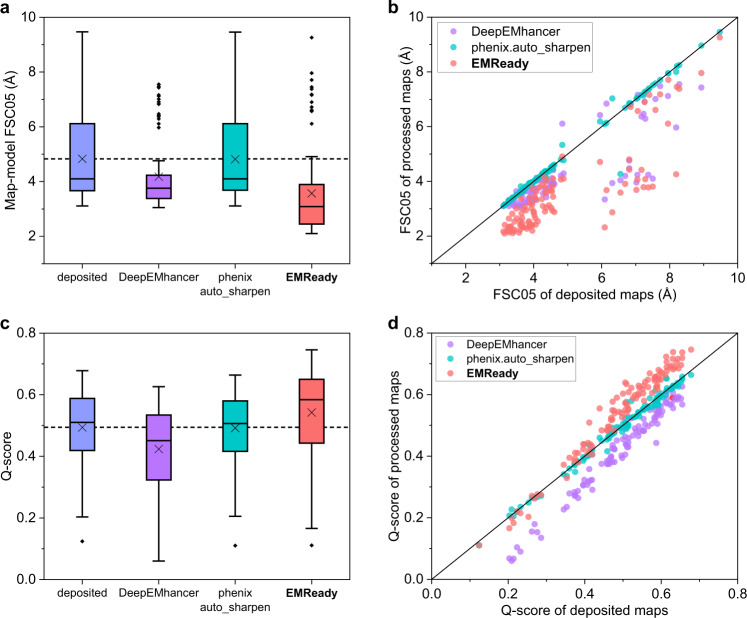
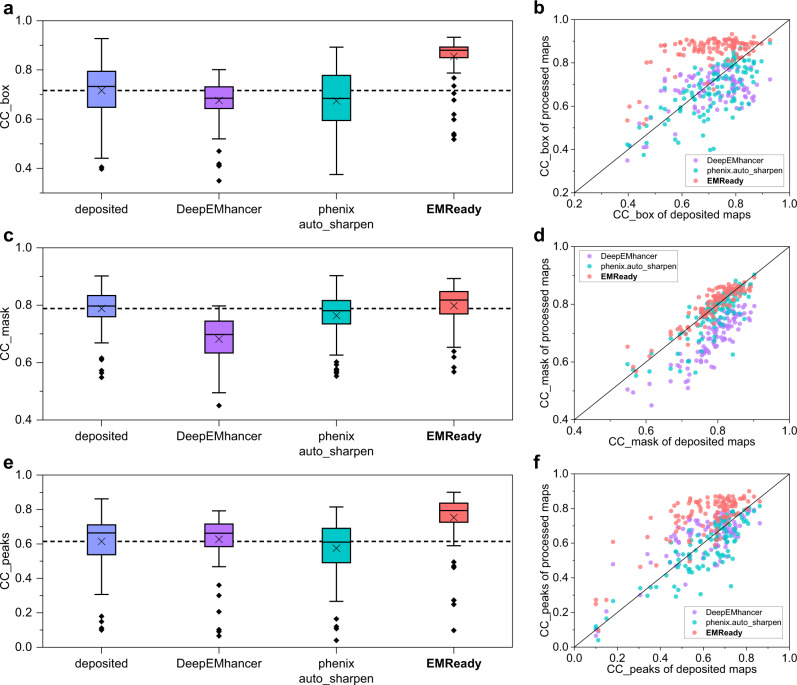
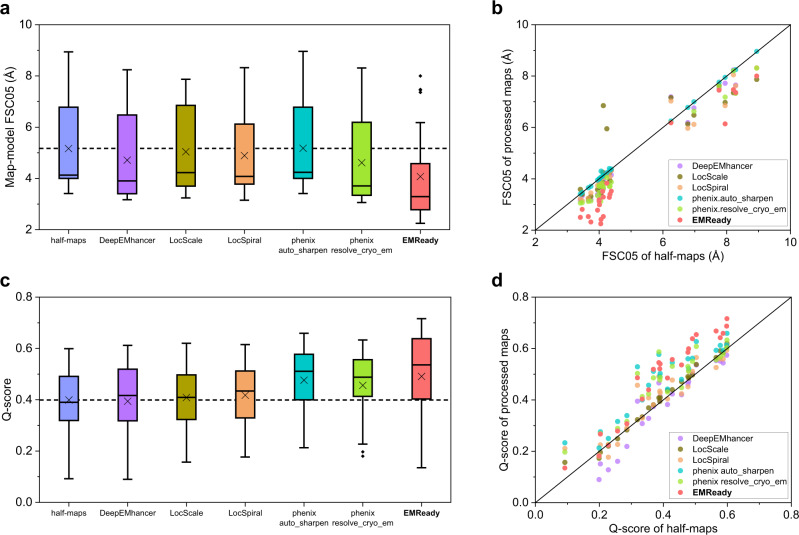
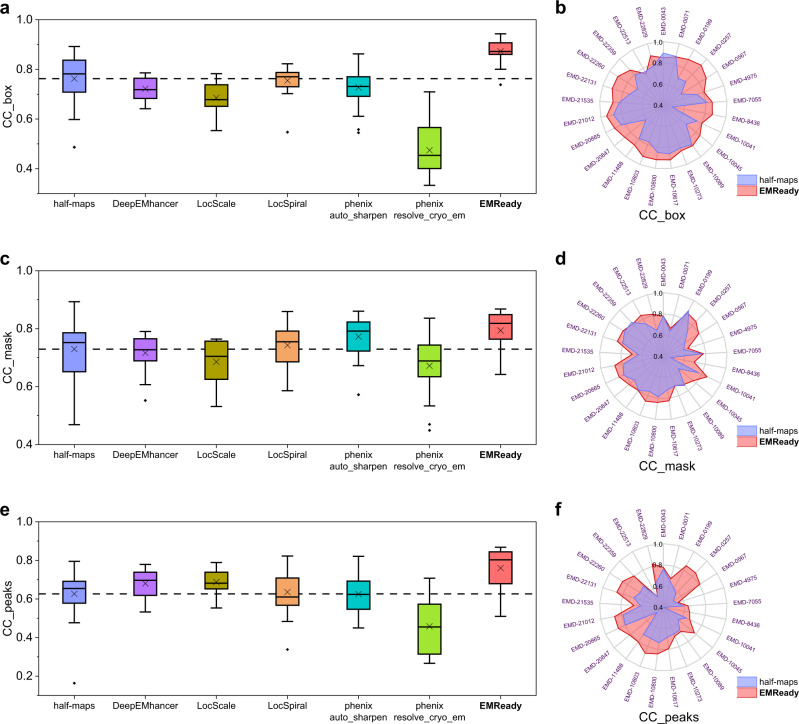
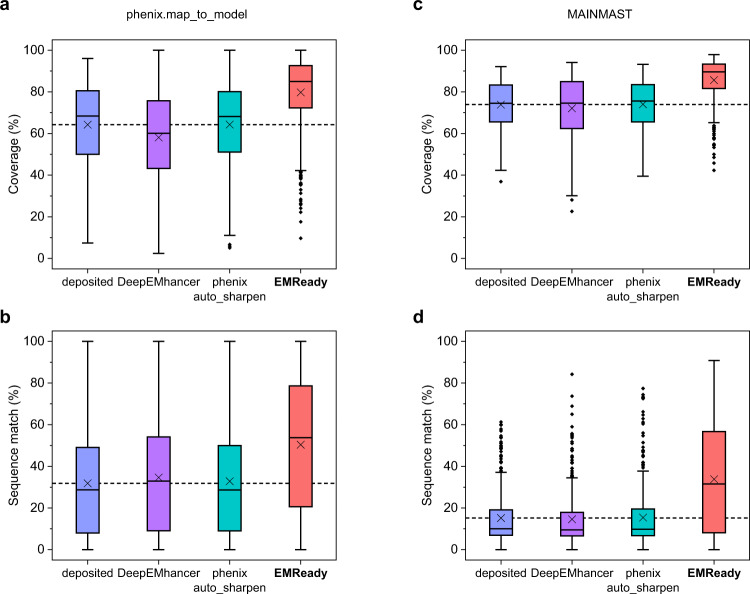
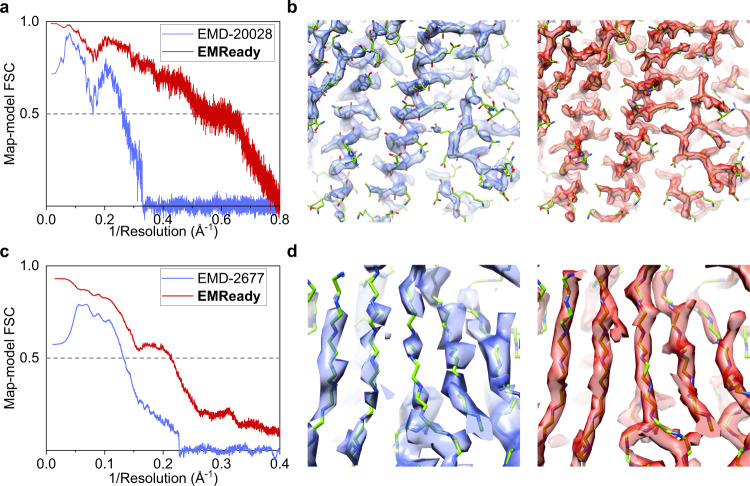
Cryo-EM has emerged as the most important technique for structure determination of macromolecular complexes. However, raw cryo-EM maps often exhibit loss of contrast at high resolution and heterogeneity over the entire map. As such, various post-processing methods have been proposed to improve cryo-EM maps. Nevertheless, it is still challenging to improve both the quality and interpretability of EM maps. Addressing the challenge, we present a three-dimensional Swin-Conv-UNet-based deep learning framework to improve cryo-EM maps, named EMReady, by not only implementing both local and non-local modeling modules in a multiscale UNet architecture but also simultaneously minimizing the local smooth L1 distance and maximizing the non-local structural similarity between processed experimental and simulated target maps in the loss function. EMReady was extensively evaluated on diverse test sets of 110 primary cryo-EM maps and 25 pairs of half-maps at 3.0-6.0 Å resolutions, and compared with five state-of-the-art map post-processing methods. It is shown that EMReady can not only robustly enhance the quality of cryo-EM maps in terms of map-model correlations, but also improve the interpretability of the maps in automatic de novo model building.


Conflict of interest statement

The authors declare no competing interests.

Figures

Fig. 1
Fig. 1. Overview of the EMReady deep learning framework.
a Preparation of the training data. EM density maps and their associated PDB models are downloaded from the EMDB and PDB, respectively. Target maps are simulated from the PDB models. The experimental maps and simulated maps are then cut into pairs of experimental boxes and simulated boxes. b The training procedure of EMReady. In each training round, an experimental box is input to the deep learning model, and the processed box is compared with its corresponding simulated box. A combination of local smooth L1 loss and non-local SSIM loss is used to optimize the deep learning model through backpropagations. c The schematic of the SCUNet architecture used in EMReady. A given input EM density box will go through a UNet-like encoder-decoder network, where swin-conv (SC) blocks are used as the main building block. Swin transformer (SwinT) for non-local modeling and residual convolution (RConv) for local modeling are implemented in parallel in each SC block. d The map processing workflow of EMReady. For a given input EM density map, EMReady first cuts it into boxes. All the boxes are processed by the trained deep learning model in (c), and then re-assembled to the output processed map.
Fig. 2
Fig. 2. Comparison of the unmasked map-model FSC-0.5 and Q-score on the test set of 110 deposited primary maps.
a, c Box-whisker plots of unmasked FSC-0.5 (a) and Q-score (c) for the deposited, DeepEMhancer-processed, phenix.auto_sharpen-processed, and EMReady-processed maps (n = 110 individual test cases). The center line is the median, the cross is the mean, lower and upper hinges represent the first and third quartile, the whiskers stretch to 1.5 times the interquartile range from the corresponding hinge, and the outliers are plotted as diamonds. Dashed lines stand for the average values of deposited primary maps. b, d Comparison of unmasked FSC-0.5 (b) and Q-score (d) between the deposited and processed maps on each test case. Source data are provided as a Source Data file.
Fig. 3
Fig. 3. Comparison of the CC values on the test set of 110 deposited primary maps.
a, c, e Box-whisker plots of CC_box (a), CC_mask (c), and CC_peaks (e) for the deposited, DeepEMhancer-processed, phenix.auto_sharpen-processed, and EMReady-processed maps (n = 110 individual test cases). The center line is the median, the cross is the mean, lower and upper hinges represent the first and third quartile, the whiskers stretch to 1.5 times the interquartile range from the corresponding hinge, and the outliers are plotted as diamonds. Dashed lines stand for the average CC values of deposited primary maps. b, d, f Comparison of CC_box (b), CC_mask (d), and CC_peaks (f) between the deposited and processed maps on each test case. Source data are provided as a Source Data file.
Fig. 4
Fig. 4. Examples of the improved EM maps by EMReady.
The deposited primary maps are colored in blue, the EMReady-processed maps are in red, and the PDB structures are in green. a EMD-22216 (associated PDB ID: 6XJX) at 4.6 Å resolution, where the Left panel is for lower contour level and the Right panel is for higher contour level. b EMD-22131 (associated PDB ID: 6XD3) at 3.3 Å resolution. The enlarged views at the center compare the density regions around a ligand (Chemical ID: V0G). c Map-model Fourier shell correlation versus the inverse resolution for EMD-22216. d Map-model Fourier shell correlation versus the inverse resolution for EMD-22131. e EMD-10213 (associated PDB ID: 6SJ7) at 3.5 Å resolution, of which two different β-sheet regions are shown in the top and bottom rows, respectively. f EMD-0257 (associated PDB ID: 6HRA) at 3.7 Å resolution, where the left panel is for the average map of two half-maps and the right panel is for the EMReady-processed map. Source data are provided as a Source Data file.
Fig. 5
Fig. 5. Comparison of the unmasked map-model FSC-0.5 and Q-score on the test set of 25 pairs of half-maps.
a, c Box-whisker plots of unmasked map-model FSC-0.5 (a) and Q-score (c) for the average maps of half-maps and the maps processed by DeepEMhancer, LocScale, LocSpiral, phenix.auto_sharpen, phenix.resolve_cryo_em (density modification), and EMReady (n = 25 individual test cases). The center line is the median, the cross is the mean, lower and upper hinges represent the first and third quartile, the whiskers stretch to 1.5 times the interquartile range from the corresponding hinge, and the outliers are plotted as diamonds. Dashed lines stand for the average values of deposited half-maps. b, d Comparison of unmasked FSC-0.5 (b) and Q-score (d) between the deposited and processed maps on each test case. Source data are provided as a Source Data file.
Fig. 6
Fig. 6. Comparison of the CC values on the test set of 25 pairs of half-maps.
a, c, e Box-whisker plots of CC_box (a), CC_mask (c), and CC_peaks (e) for the average maps of half-maps, the maps processed by DeepEMhancer, LocScale, LocSpiral, phenix.auto_sharpen, phenix.resolve_cryo_em (density modification) and EMReady (n = 25 individual test cases). The center line is the median, the cross is the mean, lower and upper hinges represent the first and third quartile, the whiskers stretch to 1.5 times the interquartile range from the corresponding hinge, and the outliers are plotted as diamonds. Dashed lines stand for the average CC values of deposited half-maps. b, d, f Comparison of CC_box (b), CC_mask (d), and CC_peaks (f) between the deposited map and EMReady-processed map on each test case. Source data are provided as a Source Data file.
Fig. 7
Fig. 7. Improvement in map interpretability.
a, b Box-whisker plots of residue coverage percentage (a) and sequence match percentage (b) for the models built by phenix.map_to_model for the deposited, DeepEMhancer-processed, phenix.auto_sharpen-processed and EMReady-processed maps on the test set of n = 682 individual chains. c, d Box-whisker plots of residue coverage percentage (c) and sequence match percentage (d) for the models built by MAINMAST for the deposited, DeepEMhancer-processed, phenix.auto_sharpen-processed and EMReady-processed maps on the test set of n = 385 individual protein chains. For the box-whisker plots, the center line is the median, the cross is the mean, lower and upper hinges represent the first and third quartile, the whiskers stretch to 1.5 times the interquartile range from the corresponding hinge, and the outliers are plotted as diamonds. The dashed lines represent the mean values of deposited maps. Source data are provided as a Source Data file.
Fig. 8
Fig. 8. Applying EMReady to lower-resolution maps and evaluating against higher-resolution PDB structures.
a, b Evaluation of an apoferritin 3.1 Å cryo-EM map (EMD-20028) using an apoferritin 1.52 Å X-ray structure (PDB ID: 3AJO) built into a 1.8 Å cryo-EM map (EMD-20026). c, d Evaluation of a 4.5 Å cryo-EM map (EMD-2677) for human γ-secretase using a 3.4 Å reference structure (PDB ID: 5A63; EMD-3061). a, c The unmasked map-model Fourier shell correlation curves versus the inverse resolution. b, d Comparison of the density volumes between the deposited maps (blue) and EMReady-processed maps (red). The higher-resolution reference PDB structures are colored in green. Source data are provided as a Source Data file.

References

    1. Nogales E. The development of cryo-EM into a mainstream structural biology technique. Nat. Methods. 2016;13:24–27. doi: 10.1038/nmeth.3694. - DOI - PMC - PubMed
    1. Frank J. Advances in the field of single-particle cryo-electron microscopy over the last decade. Nat. Protoc. 2017;12:209–212. doi: 10.1038/nprot.2017.004. - DOI - PMC - PubMed
    1. Cheng Y. Single-particle cryo-EM-How did it get here and where will it go. Science. 2018;361:876–880. doi: 10.1126/science.aat4346. - DOI - PMC - PubMed
    1. Berman HM, et al. The Protein Data Bank. Nucleic Acids Res. 2000;28:235–242. doi: 10.1093/nar/28.1.235. - DOI - PMC - PubMed
    1. Lawson CL, et al. EMDataBank unified data resource for 3DEM. Nucleic Acids Res. 2016;44:D396–D403. doi: 10.1093/nar/gkv1126. - DOI - PMC - PubMed