. 2023 Jun 3;13(1):9038.
doi: 10.1038/s41598-023-36193-2.

Oligonucleotide mapping via mass spectrometry to enable comprehensive primary structure characterization of an mRNA vaccine against SARS-CoV-2

Affiliations

Oligonucleotide mapping via mass spectrometry to enable comprehensive primary structure characterization of an mRNA vaccine against SARS-CoV-2

Brian C Gau et al. Sci Rep. .

Abstract

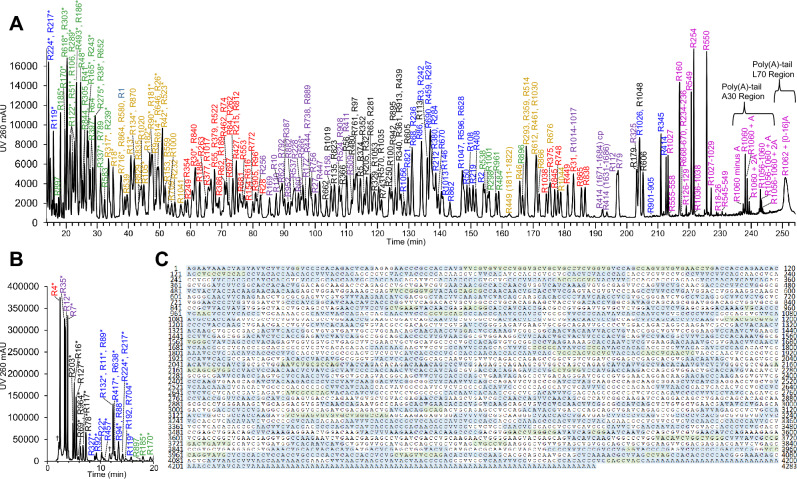
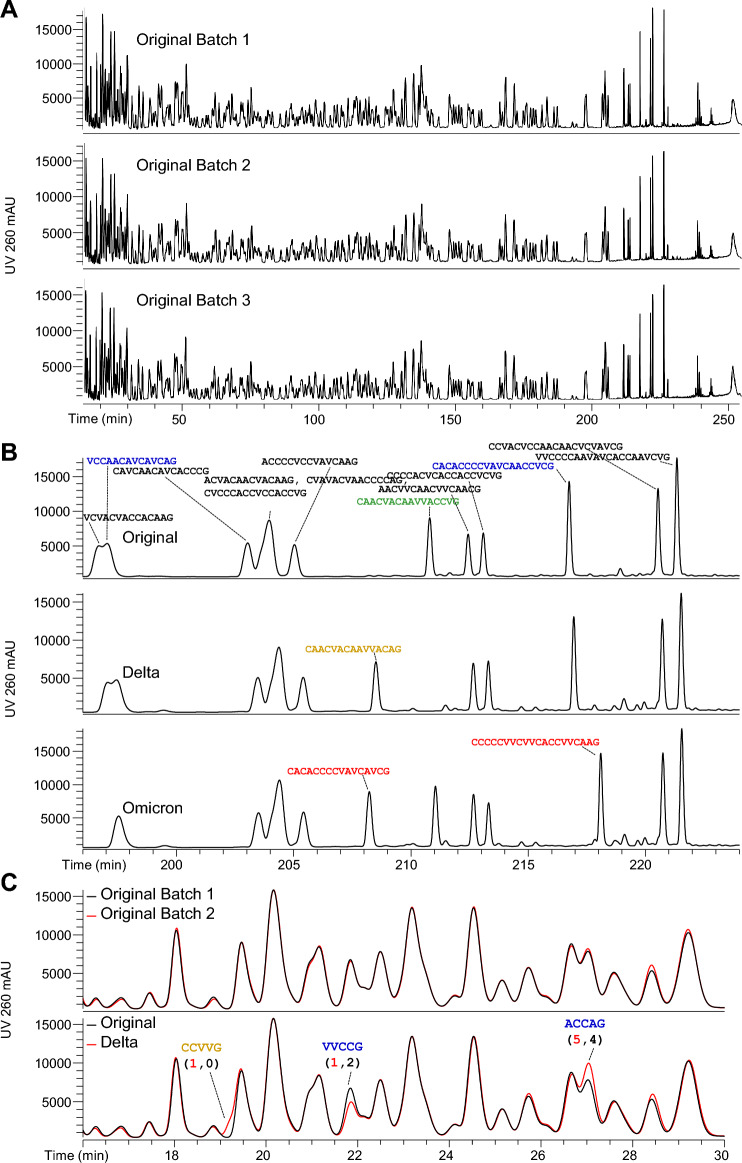
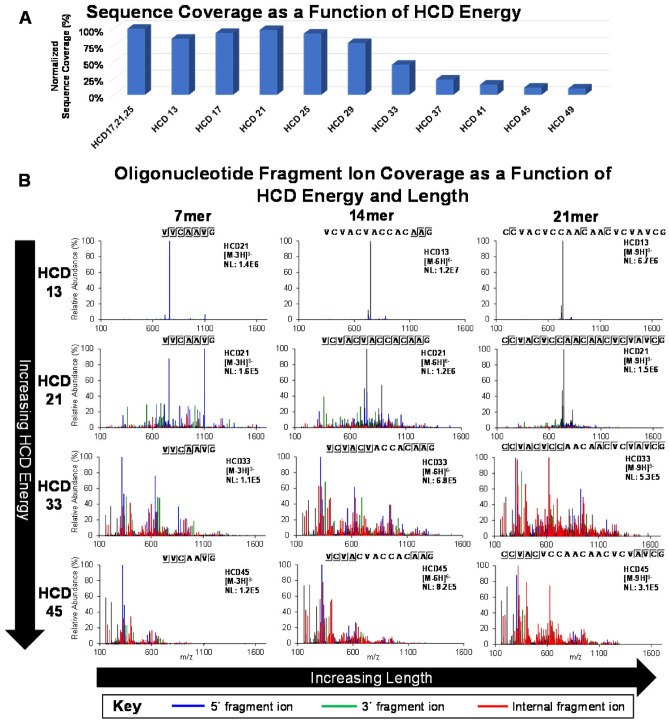
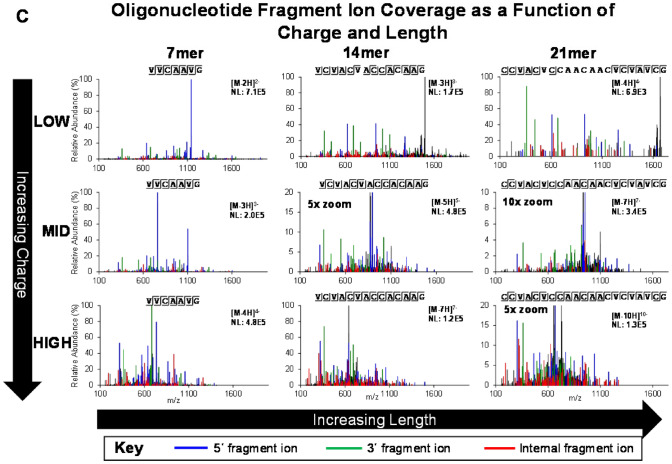
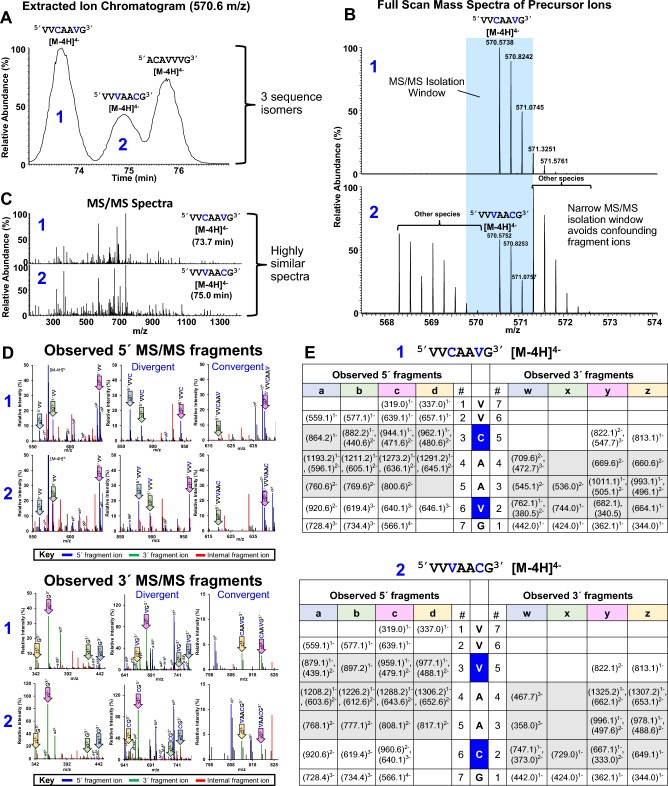
Oligonucleotide mapping via liquid chromatography with UV detection coupled to tandem mass spectrometry (LC-UV-MS/MS) was recently developed to support development of Comirnaty, the world's first commercial mRNA vaccine which immunizes against the SARS-CoV-2 virus. Analogous to peptide mapping of therapeutic protein modalities, oligonucleotide mapping described here provides direct primary structure characterization of mRNA, through enzymatic digestion, accurate mass determinations, and optimized collisionally-induced fragmentation. Sample preparation for oligonucleotide mapping is a rapid, one-pot, one-enzyme digestion. The digest is analyzed via LC-MS/MS with an extended gradient and resulting data analysis employs semi-automated software. In a single method, oligonucleotide mapping readouts include a highly reproducible and completely annotated UV chromatogram with 100% maximum sequence coverage, and a microheterogeneity assessment of 5' terminus capping and 3' terminus poly(A)-tail length. Oligonucleotide mapping was pivotal to ensure the quality, safety, and efficacy of mRNA vaccines by providing: confirmation of construct identity and primary structure and assessment of product comparability following manufacturing process changes. More broadly, this technique may be used to directly interrogate the primary structure of RNA molecules in general.


Conflict of interest statement

All authors are employees of Pfizer.

Figures

Figure 1
Figure 1
RNase T1 Oligonucleotide Map of BNT162b2 Original DS. (A) IP RP-UHPLC-UV-MS/MS RNase T1 oligonucleotide map of BNT162b2 Original DS, 14–254 min. “R” represents oligonucleotide RNase T1 digestion products indexed from the 5′ to 3′ end. “*” denotes a sequence-repeat oligonucleotide, where the single peak assignment represents all identical oligonucleotides in the sequence. Each color distinguishes the number of nucleotides per digestion product: blue: 4, 10 and 16; green: 5 and 11; gold: 6 and 12; red: 7 and 13, purple: 8 and 14, black: 9 and 15, magenta: > 16. For graphical clarity, not all observed oligonucleotides are annotated on the chromatogram; a complete list is in Supplementary Data Table 1. (B) IP RP-UHPLC/UV/MS/MS RNase T1 oligonucleotide map of BNT162b2 Original DS, 0–20 min. “R” represents oligonucleotide RNase T1 digestion products indexed from the 5′ to 3′ end. “*” denotes a sequence-repeat oligonucleotide, where the single peak assignment represents all identical oligonucleotides in the sequence. Each color distinguishes the number of nucleotides per digestion product: red: 1; purple: 2; black: 3; blue: 4; green: 5. For graphical clarity, not all observed oligonucleotides are annotated on the chromatogram; a complete list is in Supplementary Data Table 1. (C) The 55.6% unique sequence coverage is illustrated as shaded by blue and green, based on 314 observed unique-sequence oligonucleotides. Blue nucleotides comprise unique-sequence RNase T1 oligonucleotides; green nucleotides comprise unique-sequence missed-cleavage and fragment oligonucleotides. Green and white nucleotides also comprise repeat-sequence RNase T1 oligonucleotides, based on 74 observed repeat-sequence oligonucleotides. “V” is N1-methyl pseudouridine.
Figure 2
Figure 2
Batch Comparability and Construct Identity Assayed by Oligonucleotide Mapping. (A) Three GMP-manufactured BNT162b2 Original DS batches were evaluated by oligonucleotide mapping. The resulting UV chromatograms are visually comparable, demonstrating process consistency. Supplementary Data Fig. 3 provides a six-segment magnification of these data. Batch 3 was made at small scale; Batches 1 and 2 were made by the same GMP process. (B) Partial oligonucleotide maps of the BNT162b2 Original, BNT162b2 Delta, and BNT162b2 Omicron mRNA DS. RNase T1-digest oligonucleotide sequences shown in black are shared by all 3 variant constructs; blue sequences are shared by BNT162b2 Original and BNT162b2 Delta constructs; green is shared by BNT162b2 Original and BNT162b2 Omicron constructs; and orange and red oligonucleotides are unique to the BNT162b2 Delta and BNT162b2 Omicron constructs, respectively. (C) Partial oligonucleotide maps of two batches of BNT162b2 Original overlaid (top pane), and one BNT162b2 Original batch overlaid with BNT162b2 Delta (bottom pane). Differences between the BNT162b2 Original and BNT162b2 Delta construct chromatograms are annotated with the oligonucleotides accounting for the difference. Blue oligonucleotides are shared by BNT162b2 Original and BNT162b2 Delta constructs; the orange oligonucleotide is unique to the BNT162b2 Delta construct. The numbers in parentheses count the number of sequence repeats in each construct sequence: red signifies the number of occurrences in the BNT162b2 Delta construct and black signifies the number of occurrences in the BNT162b2 Original construct.
Figure 3
Figure 3
Oligonucleotide Mapping of mRNA Enables Simultaneous Characterization of the 5′ and 3′ Termini Without Affinity Purification. (A) Extracted ion chromatograms ([M-1H]1–, [M-2H]2–) of uncapped (5′ppp-AG) and capped (5′ cap-AG) versions of the 5′ terminal oligonucleotide for BNT162b2 variant constructs Original, Delta, and Omicron. (B, C) Deconvoluted, zero-charge mass spectra of uncapped (5′ppp-AG) and capped (5′ cap-AG) versions, respectively, of the 5′ terminal oligonucleotide for BNT162b2 variant constructs Original, Delta, and Omicron. The spectra are deconvoluted from the summation of scans within the regions highlighted in panel A, using Byos v4.4 (Protein Metrics). Observed masses (monoisotopic) agree with theoretical masses to within 3 ppm, which is consistent with the accuracy and precision of Orbitrap mass spectrometers. (D) UV chromatograms (260 nm) of the poly(A)tail region for BNT162b2 variant constructs Original, Delta, and Omicron: the A30 and L70 poly(A) oligonucleotide regions consisting of the generic formulas C[A]nG, and ACV[A]n, are labeled accordingly. Chromatographically separated A30 poly(A) peaks are labeled according to the number of adenosines detected in each oligonucleotide. The asterisk (*) denotes a separate A30 poly(A) oligonucleotide distribution resulting from missed cleavage of the A30 poly(A) oligonucleotide, consisting of the generic formula CCACACCCVGGAGCVAGC[A]nG. The blue box highlights the chromatographic distribution of L70 poly(A) oligonucleotides (unseparated) which are further described in panels (E and F). (E) Deconvoluted, zero-charge mass spectra of the L70 poly(A) oligonucleotide distribution from the summation of scans within the blue boxed region highlighted in panel (D). Mass spectral peaks are labeled according to the number of adenosines detected in each L70 poly(A) oligonucleotide. The double asterisk (**) denotes separate L70 poly(A) oligonucleotide distributions resulting from artefactual degradation of the L70 poly(A) oligonucleotides during sample preparation. Observed masses (monoisotopic) agree with theoretical masses to within 5 ppm, which is consistent with the accuracy and precision of Orbitrap mass spectrometers. ~ 1 and 2 Da mass errors from de-isotoping occurred on certain species in the L70 poly(A) distributions because of the trace-level relative abundance of these species or signal interference from other species; more specifically, insufficient signal-to-noise or interference results in non-statistical isotope distributions leading to errors in the monoisotopic mass determination. (F) Extracted deconvolved chromatograms (XDCs) of BNT162b2 Original L70 poly(A) oligonucleotide distribution highlighted in panel (E). Colored shading on each oligonucleotide in panel (E) corresponds to its XDC.
Figure 4
Figure 4
Optimal HCD energy and charge density drive proper fragmentation. (A) Relative BNT162b2 Original maximum sequence coverage determined by oligonucleotide mapping as a function of HCD energy. The maximum sequence coverage resulting from each condition is normalized to the final recommended condition (stepped HCD 17, 21, 25). Maximum sequence coverage was restricted only to oligonucleotides identified by BioPharma Finder using a confidence score parameter restriction of 100%. (B) MS/MS spectra and fragment ion coverage of 3 oligonucleotides, presented as a function of HCD energy and oligonucleotide length. The MS/MS spectra are generated using HCD energies: 13, 21, 33, and 45, as applied to 7mer, 14mer, and 21mer oligonucleotides. Fragment ions identified as 5′ (a,b,c,d), 3′ (w,x,y,z), and internal fragments are annotated by color-coding as defined in the key. Identification and annotation of fragment ions was performed using a Visual Basic Excel tool developed in-house. (C) MS/MS spectra and fragment ion coverage of 3 oligonucleotides, presented as a function of oligonucleotide charge and length. MS/MS spectra are generated using a single stepped energy HCD method (17, 21, 25) on low, middle, and high charge states of the same 7mer, 14mer, and 21mer oligonucleotides presented in panel B. Fragment ions identified as 5′ (a,b,c,d), 3′ (w,x,y,z), and internal fragments are annotated by color-coding as defined in the key. Identification and annotation of fragment ions was performed using a Visual Basic Excel tool developed in-house.
Figure 4
Figure 4
Optimal HCD energy and charge density drive proper fragmentation. (A) Relative BNT162b2 Original maximum sequence coverage determined by oligonucleotide mapping as a function of HCD energy. The maximum sequence coverage resulting from each condition is normalized to the final recommended condition (stepped HCD 17, 21, 25). Maximum sequence coverage was restricted only to oligonucleotides identified by BioPharma Finder using a confidence score parameter restriction of 100%. (B) MS/MS spectra and fragment ion coverage of 3 oligonucleotides, presented as a function of HCD energy and oligonucleotide length. The MS/MS spectra are generated using HCD energies: 13, 21, 33, and 45, as applied to 7mer, 14mer, and 21mer oligonucleotides. Fragment ions identified as 5′ (a,b,c,d), 3′ (w,x,y,z), and internal fragments are annotated by color-coding as defined in the key. Identification and annotation of fragment ions was performed using a Visual Basic Excel tool developed in-house. (C) MS/MS spectra and fragment ion coverage of 3 oligonucleotides, presented as a function of oligonucleotide charge and length. MS/MS spectra are generated using a single stepped energy HCD method (17, 21, 25) on low, middle, and high charge states of the same 7mer, 14mer, and 21mer oligonucleotides presented in panel B. Fragment ions identified as 5′ (a,b,c,d), 3′ (w,x,y,z), and internal fragments are annotated by color-coding as defined in the key. Identification and annotation of fragment ions was performed using a Visual Basic Excel tool developed in-house.
Figure 5
Figure 5
Proper MS/MS fragmentation & interpretation is critical for oligonucleotide mapping. (A) Extracted ion chromatogram of 3 oligonucleotide sequence isomers ([M-4H]4−). (B) Full scan mass spectra of sequence isomers “1” and “2” ([M-4H]4−) as denoted in panel (A). The blue shading defines the precursor isolation window used for subsequent MS/MS fragmentation. (C) MS/MS fragmentation spectra derived from sequence isomers “1” and “2” ([M-4H]4−). (D) Zoomed sections of sequence isomers “1” and “2” ([M-4H]4−) in MS/MS spectra, with annotation of select 5′ and 3′ fragment ions. The 1st, 2nd, and 3rd columns in the observed 5′ MS/MS fragments pane (top) highlight 5′ fragments identified for positions 2, 3, and 6, respectively. The 1st, 2nd, and 3rd columns in the observed 3′ MS/MS fragments pane (bottom) highlight 3′ fragments identified for positions 1, 2, and 5, respectively. For each panel, the “divergent” label denotes that the masses of the same fragment ions between sequences isomers “1” and “2” diverge at that position, indicating they contain different nucleotides at that position. The “convergent” label denotes that the masses of the same fragment ions between sequences isomers “1” and “2” converge at that position, again indicating they contain different nucleotides at that position. Color-coding of the spectral peaks is defined in the key. Unique colored shading of each arrow highlighting fragment ions corresponds to the colors as defined in panel (E). (E) Observed fragment ion mass tables for sequence isomers “1” and “2” ([M-4H]4−). Unique colored shading defines each type of 5′ fragment ion and its 3′ pair and matches the shaded arrows in panel (D). The dark blue shading highlights the two bases which change position between the two sequence isomers. The gray shading highlights the fragment ion masses which differentiate the two sequence isomers from each other.
Figure 6
Figure 6
Decoy sequence search technique developed as a suitability assessment for oligonucleotide mapping workflow. (A) Venn diagram of the shared and unique oligonucleotide fragments of a theoretical RNase T1 digestion of BNT162b2 Original construct and its reverse-sequence construct. This is one example of a decoy construct. The theoretical digestion predicts 302 unique-sequence oligonucleotides (74%) for each and 78 shared oligonucleotides (26%). (B) Venn diagram of the shared-mass and unique-mass oligonucleotide fragments of a theoretical RNase T1 digestion of BNT162b2 Original construct and of its reserve-sequence construct. The theoretical digestion predicts 147 unique-mass oligonucleotides for each. Of these, 145 oligonucleotides (99%) are shared. (C) Decoy construct identification overlay on the base peak ion chromatogram of the BNT162b2 Original RNase T1 digest acquisition. Each colored bar marks an oligonucleotide feature identified by the BioPharma Finder automated software as originating from the RNase T1 digest of a decoy construct. The decoy constructs are random sequences containing the nucleotide composition of BNT162b2 Original. The common sequence elution region contains shorter oligonucleotides, most of which are common to any decoy constructs as well as the true construct when subjected to RNaseT1 digestion. The unique sequence elution region contains longer oligonucleotides, most of which are unique to the true construct. The true construct oligonucleotides are similar enough to decoy sequence oligonucleotides for the automated software to provide decoy oligonucleotide assignments. The identifications in the unique sequence elution region are not preferentially assigned to a single decoy construct, demonstrating that none of the decoy constructs are the true construct. (D) Target and decoy construct identification overlay on the base peak ion chromatogram of the BNT162b2 Original RNase T1 digest acquisition. Each colored bar marks an oligonucleotide feature identified by the BioPharma Finder automated software as originating from the RNase T1 digest of a decoy or target construct. Oligonucleotides in the unique sequence elution region are mostly identified (> 95%) as belonging to the BNT162b2 Original construct. This confirms the identity of the true construct and verifies the oligonucleotide mapping workflow’s ability to correctly identify oligonucleotides via LC-MS/MS.

References

    1. Lamb YN. BNT162b2 mRNA COVID-19 vaccine: First approval. Drugs. 2021;81:495–501. doi: 10.1007/s40265-021-01480-7. - DOI - PMC - PubMed
    1. Baden LR, et al. Efficacy and safety of the mRNA-1273 SARS-CoV-2 vaccine. N. Engl. J. Med. 2020;384:403–416. doi: 10.1056/NEJMoa2035389. - DOI - PMC - PubMed
    1. Zheng J. SARS-CoV-2: An emerging coronavirus that causes a global threat. Int. J. Biol. Sci. 2020;16:1678–1685. doi: 10.7150/ijbs.45053. - DOI - PMC - PubMed
    1. Sahin U, Karikó K, Türeci Ö. mRNA-based therapeutics—developing a new class of drugs. Nat. Rev. Drug Discov. 2014;13:759–780. doi: 10.1038/nrd4278. - DOI - PubMed
    1. Xia X. Detailed dissection and critical evaluation of the Pfizer/BioNTech and moderna mRNA vaccines. Vaccines. 2021;9:734. doi: 10.3390/vaccines9070734. - DOI - PMC - PubMed