. 2023 Jun 3;14(1):3232.
doi: 10.1038/s41467-023-38947-y.

Dynamic pathogen detection and social feedback shape collective hygiene in ants

Affiliations

Dynamic pathogen detection and social feedback shape collective hygiene in ants

Barbara Casillas-Pérez et al. Nat Commun. .

Abstract

Cooperative disease defense emerges as group-level collective behavior, yet how group members make the underlying individual decisions is poorly understood. Using garden ants and fungal pathogens as an experimental model, we derive the rules governing individual ant grooming choices and show how they produce colony-level hygiene. Time-resolved behavioral analysis, pathogen quantification, and probabilistic modeling reveal that ants increase grooming and preferentially target highly-infectious individuals when perceiving high pathogen load, but transiently suppress grooming after having been groomed by nestmates. Ants thus react to both, the infectivity of others and the social feedback they receive on their own contagiousness. While inferred solely from momentary ant decisions, these behavioral rules quantitatively predict hour-long experimental dynamics, and synergistically combine into efficient colony-wide pathogen removal. Our analyses show that noisy individual decisions based on only local, incomplete, yet dynamically-updated information on pathogen threat and social feedback can lead to potent collective disease defense.


Conflict of interest statement

The authors declare no competing interests.

Figures

Fig. 1
Fig. 1. Individual and collective hygiene are triggered by pathogen exposure.
a Experimental setup of six treatment groups, each consisting of four untreated ants (nestmates) and two ants treated with varying pathogen load (red F, high; yellow f, low; gray C, control). Group spore load based on the exposure loads applied to F- and f-treated ants (as determined directly after exposure for n = 30 individuals each) and initial spore load difference between the two treated ants are shown per treatment group (medians depicted, see “Methods” section for interquartile ranges). Treatment-induced behavioral changes, reported as difference from the pre-treatment period (zero line) in fraction of effective time spent in b selfgrooming their body (resp. head, Supplementary Table 2), c performed and d received allogrooming, for treated ants and their untreated nestmates (blue N). Mean ± sem depicted in opaque colors, shades show 95% CI, n = 594 ants, 99 replicates, Supplementary Table 1). Two-sided p-values adjusted for multiple testing of paired Wilcoxon tests post- vs pre-treatment depicted by ***p ≤ 0.001 (details given in Supplementary Table 2), *p = 0.023, n.s. p = 0.105. Source data are provided as a Source Data file.
Fig. 2
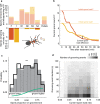
Fig. 2. Sanitary care behavior depends on pathogen load.
a Ff-treatment group example of measured final spore loads remaining on each ant’s body or acquired by transmission (opaque), and removed (translucent color) by collection into the ant’s head or as disposed pellets. Red indicates spores originally applied to the F-individual, yellow to the f-individual. b Inferred spore load dynamics for the two pathogen-treated ants in panel a. Horizontal lines show back-computed initial loads of the F- and f-individual; arrow depicts exemplified current spore load difference. c Distribution of the proportion of the spore load on the groomed individual (out of total spores on both spore-treated ants), assembled across all nestmate allogrooming events (gray bars), when compared to chance (black line) reveals the ants’ preference to groom higher-load ants (bootstrapped Kolmogorov-Smirnov test, D = 0.053, two-sided p = 1.632e−6 (shown by *** as ≤0.001), green line depicts smoothed observed to expected-by-chance difference; see also Supplementary Fig. 6). d Duration of individual allogrooming events (grooming events of duration <2 min [90% of events] depicted) does not systematically depend of the current load proportion (42/45 pairwise Kruskal–Wallis tests two-sided adjusted for multiple testing p > 0.05); c, d based on n = 196 N from the 49 FF, Ff, ff replicates. Source data are provided as a Source Data file.
Fig. 3
Fig. 3. Stochastic model of individual ant decisions identifies key factors that modulate and direct allogrooming activity.
a At each moment, an ant is either inactive (IDLE state), selfgrooming (SELF) or grooming another ant (ALLO). Stochastic transitions between states (arrows) depend on a range of factors to be identified. (b) Model selection identified predictive factors that the ant experienced in the recent past, such as performed (P) and received (R) allogrooming, and encountered spore load (L), by minimizing prediction error on 5 independent replicate simulation sets for the time-resolved activity across all ant classes (F,f,C,N) and treatment combinations. The best model (green) uses factors R and L, c an individual disturbance factor (ρ) by which all treated ants (F,f,C) equally suppress their allogrooming compared to untreated ants, as well as d a sequential-choice rule with dynamic updating of spore load information (rule 5, green bar) to pick a target for grooming. This rule is favored by model selection (bars at left) over alternative rules (rules 1-4; all rules schematized at right, see Supplementary Note 1 for details). In alternative rule 1, ants pick grooming targets uniformly at random. Alternative rule 2 is a variant of the sequential-choice rule with the same parameters as its dynamic counterpart (green bar), but with loads being the initial rather than dynamically-updated current loads. Alternative rule 3 uses static probabilities for picking each ant depending on its treatment; probabilities have been optimized for best fit to data. Alternative rule 4 assumes each ant has access to global current load information to deterministically groom the ant with the currently maximal load (circle darkness reflects spore load intensity). In b-d, bars represent the mean of the 5 individual simulations (each depicted by a circle; error bar shows ±std), relative to the constant rates model (dashed horizontal line). e Schematic of the identified best model. Ants amplify allogrooming when recently having perceived high spore load on others, and suppress it after having received grooming. Transition to allogrooming is additionally suppressed (ρ) in all treated ants.
Fig. 4
Fig. 4. Stochastic model of individual ant decisions predicts sanitary care behaviors across the length of the entire experiment.
Side-by-side view of experimental data (left) and stochastic simulations (right), aggregated and exemplified for individual ants. a Averaged activity traces binned into 30s windows. Circles depict the means, shaded areas the sem centered around the means, which are magnified for better visibility in the plot by a magnification factor of 1.5x for the treated [F, n = 66, red; f, n = 65, yellow; C, n = 67, gray] and 3x for the nestmate [N, n = 396, blue] ants of the 99 replicates), partitioned by grooming type (selfgrooming, performed and received allogrooming) and by ant treatment, shown pre- and post-treatment. b Detailed activity rasters for each ant (F, f, and 4N as rows within each raster for a Ff example). (Top) Inferred current spore load on F- and f- ants decreases due to grooming in data and simulation on a comparable time-scale. (Bottom) Grooming networks for the four 30-min intervals of the experiment (pre: 30 min pre-treatment period; post-treatment period separated into three 30 min periods: post 0–30, 30–60, and 60–90 min after treatment; edge thickness = total duration of received allogrooming events per ant).
Fig. 5
Fig. 5. Illustration of the exploration-exploitation tradeoff in a simplified model of ant decision making.
Ants incur a time-cost tE per encounter to estimate the spore load on a target ant (exploration) and tG to groom it (exploitation). The inferred sequential-choice rule (SEQ, partial information) outperforms the maximal rule (MAX, complete information) as the colony size grows for any nonzero tE/tG, in terms of time needed to remove 90% of pathogen.
Fig. 6
Fig. 6. Grooming decisions depend on spore load difference and social feedback.
a Evidence for grooming bias towards the higher-load ant. Nestmates’ preference to groom the higher-load ant increases with the difference in current spore load between two treated ants towards saturation (data bins based on 328 N from 82 replicates (except CC); Spearman-rank correlation; black line: theoretical expectation; see also Supplementary Fig. 9). Two-sided p-value p = 1.515e−6 (depicted by *** as ≤0.001). b Evidence for social feedback. An ant’s transition to allogrooming is suppressed if it received grooming in the recent past (pre-treatment: all ants black, n = 594; post-treatment: nestmates blue, n = 328; treated ants brown, n = 164; for separate F,f,C see Supplementary Fig. 10). Time-dependence assessed by Spearman-Rank correlation (rho given; mean ± std over 5 s bins; solid lines display exponential fits), two-sided p-values: nestmates p < 1 e −11, treated individuals p < 1 e −11, pre-treatment: p = 2.1 e−7 (all depicted by *** for 0.001). Source data are provided as a Source Data file.
Fig. 7
Fig. 7. Grooming choices biased towards higher-load individuals result in efficient pathogen removal.
a Groups in the main experiment in which nestmates groomed the higher-load individual more (high model-predicted grooming preference, mean ± std over 5 simulations per replicate) remove more spores by nestmate allogrooming and pellet formation (measured means ± std using estimated detection error; n = 82 replicates; r2 of linear functional model given; see also Supplementary Fig. 11). b Functional knock-out experiment in which ants were prevented from choosing (i.e., nestmates only faced one treated ant) compared to a choice situation (i.e., nestmates had two treated ants to choose from). The ratio of the total removed spores (collected in nestmate heads and expelled as pellets per group, n = 98 groups, 14 each of 4 free-choice and 3 no-choice situations; green dot at right shows the mean across different choice scenarios at left) is higher in free-choice compared to the matched no-choice situations (comparison to the null distribution in pale green, calculated by bootstrapping, n = 105, one-sided p = 0.047; see Supplementary Notes 3). Importantly, all choice situations – difficult (two spore-treated individuals, both with high initial load; two black ants), moderate (two spore-treated individuals with different initial spore load; black plus gray ant), or easy choice (only one of the two individuals treated with a high load of spores, the other being control-treated; black plus white ant) – show similar ratios of spore removal with vs. without choice. Source data are provided as a Source Data file.

References

    1. Petkova MD, Tkačik G, Bialek W, Wieschaus EF, Gregor T. Optimal decoding of cellular identities in a genetic network. Cell. 2019;176:844–855.e815. doi: 10.1016/j.cell.2019.01.007. - DOI - PMC - PubMed
    1. Tkačik G, et al. Searching for collective behavior in a large network of sensory neurons. PLoS Comput. Biol. 2014;10:e1003408. doi: 10.1371/journal.pcbi.1003408. - DOI - PMC - PubMed
    1. Schneidman E, Berry MJ, Segev R, Bialek W. Weak pairwise correlations imply strongly correlated network states in a neural population. Nature. 2006;440:1007–1012. doi: 10.1038/nature04701. - DOI - PMC - PubMed
    1. Boocock D, Hino N, Ruzickova N, Hirashima T, Hannezo E. Theory of mechanochemical patterning and optimal migration in cell monolayers. Nat. Phys. 2021;17:267–274. doi: 10.1038/s41567-020-01037-7. - DOI
    1. Gregor T, Fujimoto K, Masaki N, Sawai S. The onset of collective behavior in social amoebae. Science. 2010;328:1021–1025. doi: 10.1126/science.1183415. - DOI - PMC - PubMed

Publication types