. 2023 Jun 4;23(2):196.
doi: 10.1007/s10142-023-01122-z.

ITGA3 acts as a purity-independent biomarker of both immunotherapy and chemotherapy resistance in pancreatic cancer: bioinformatics and experimental analysis

Affiliations

ITGA3 acts as a purity-independent biomarker of both immunotherapy and chemotherapy resistance in pancreatic cancer: bioinformatics and experimental analysis

Xiaohao Zheng et al. Funct Integr Genomics. .

Retraction in

Abstract

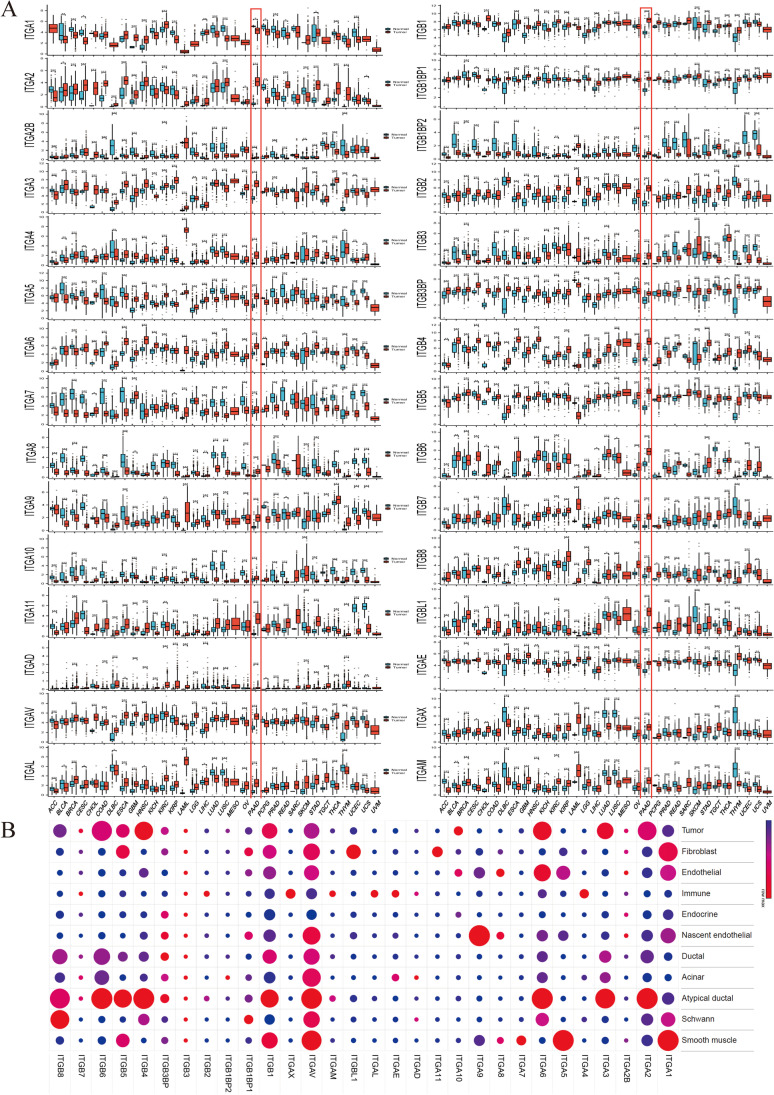
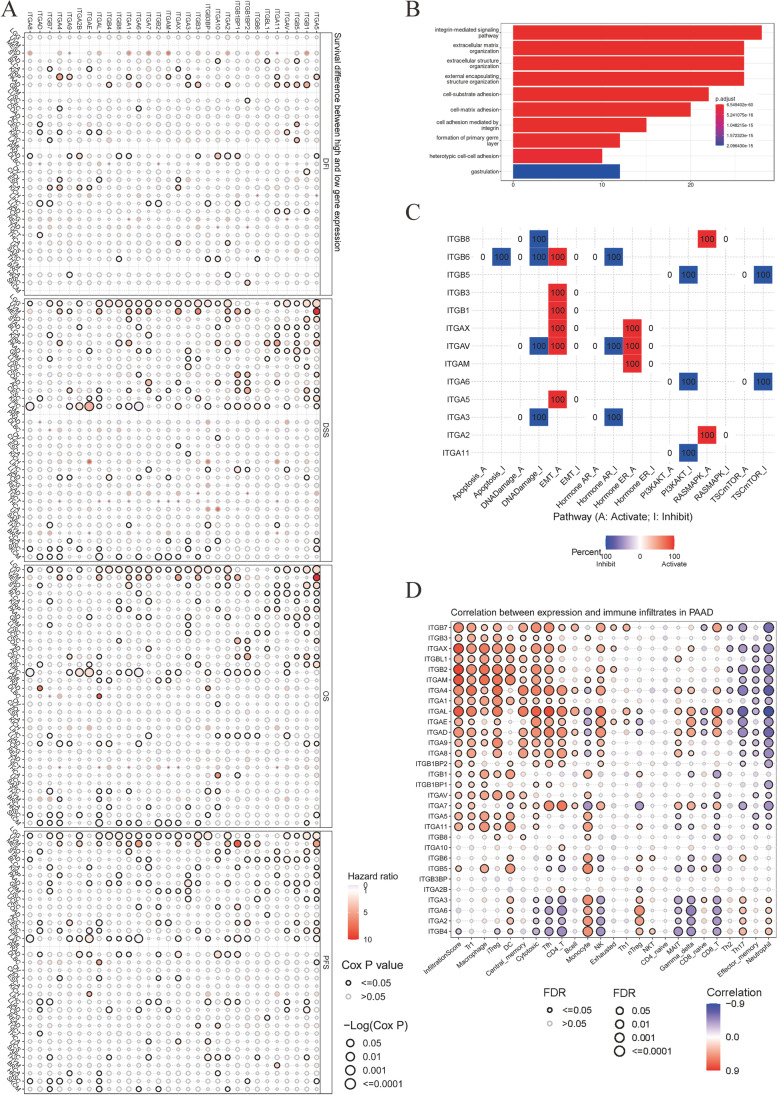
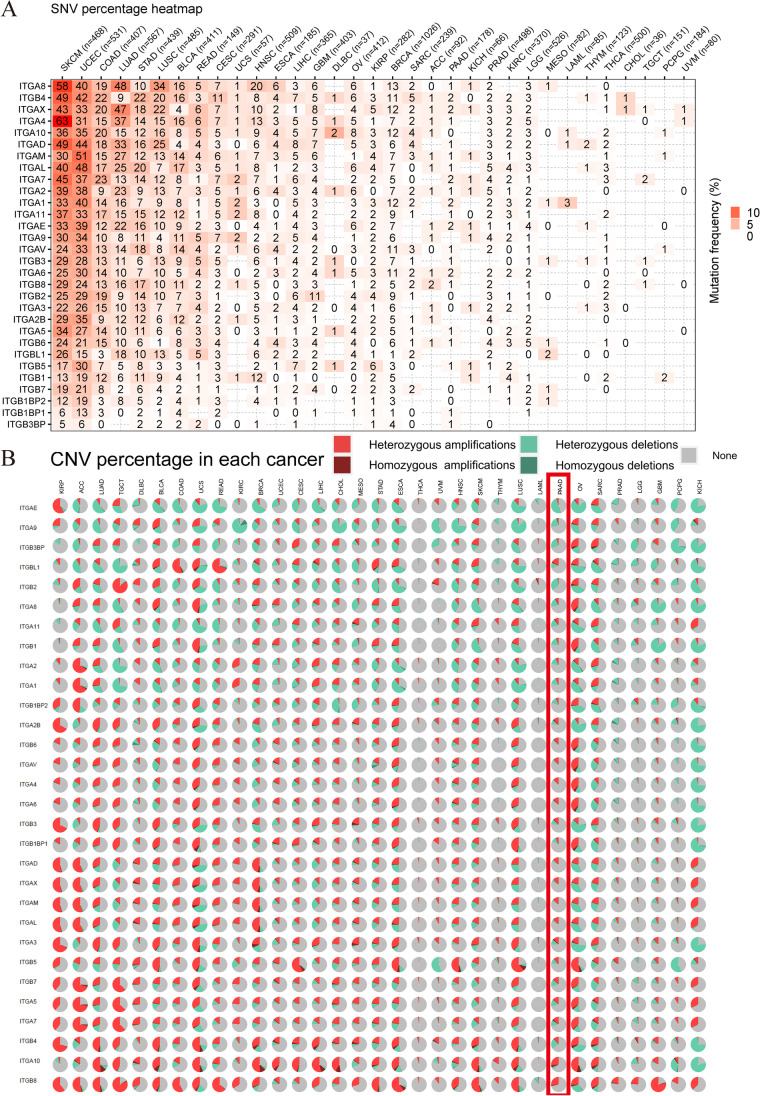
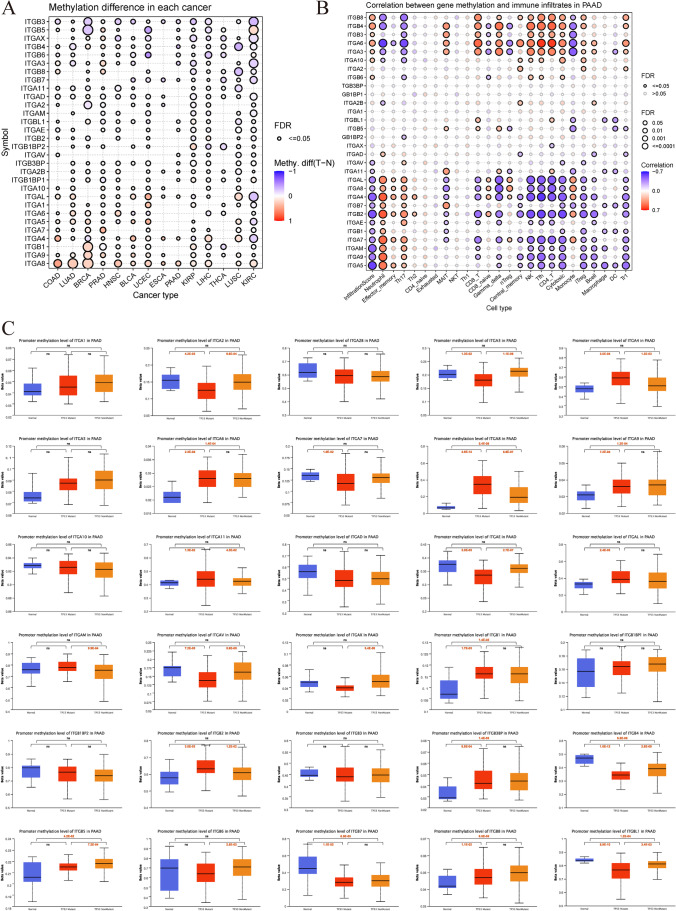
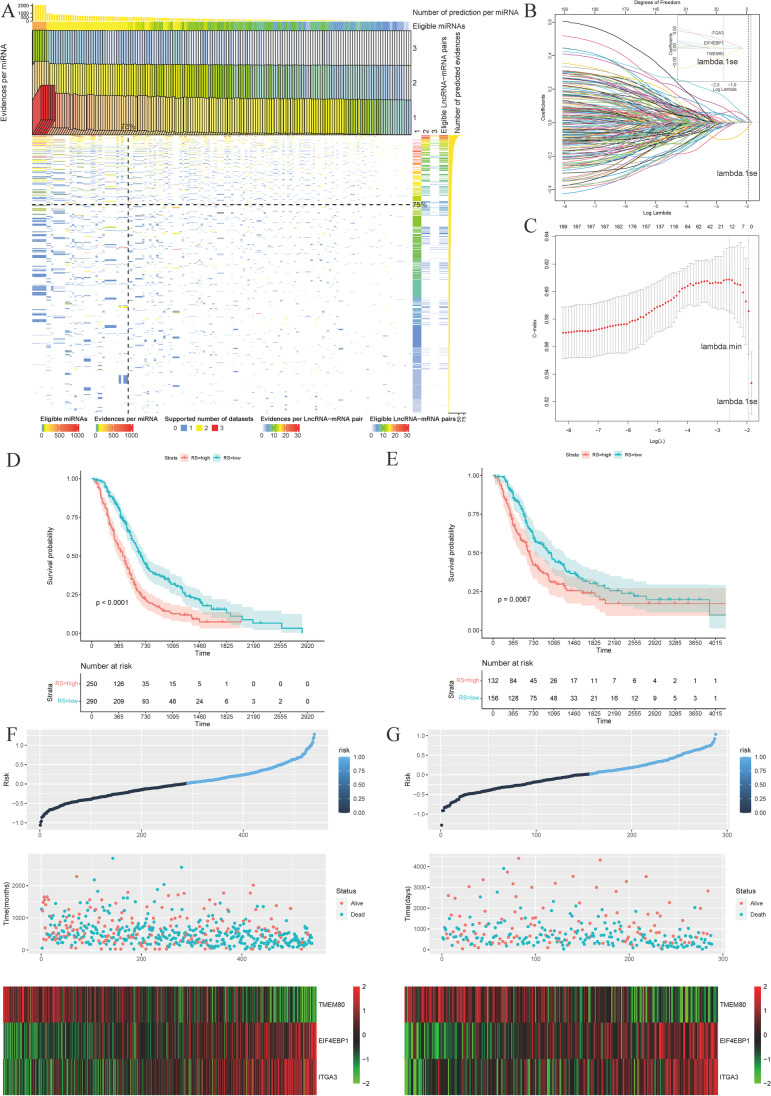
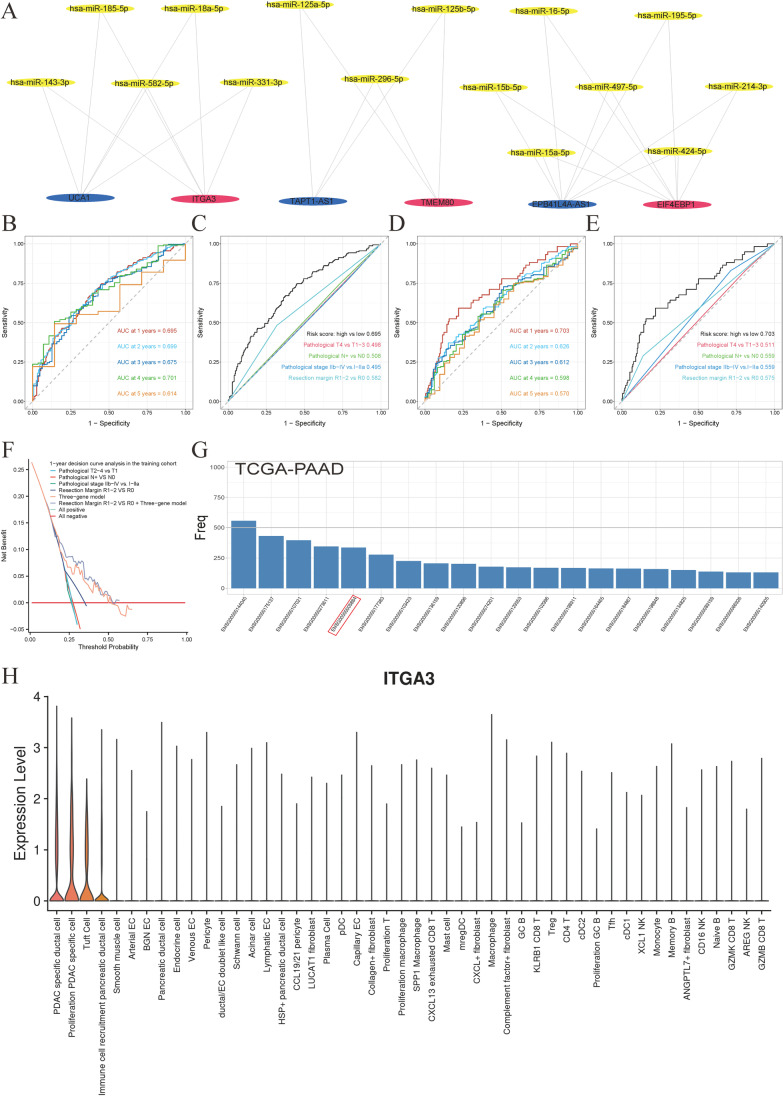
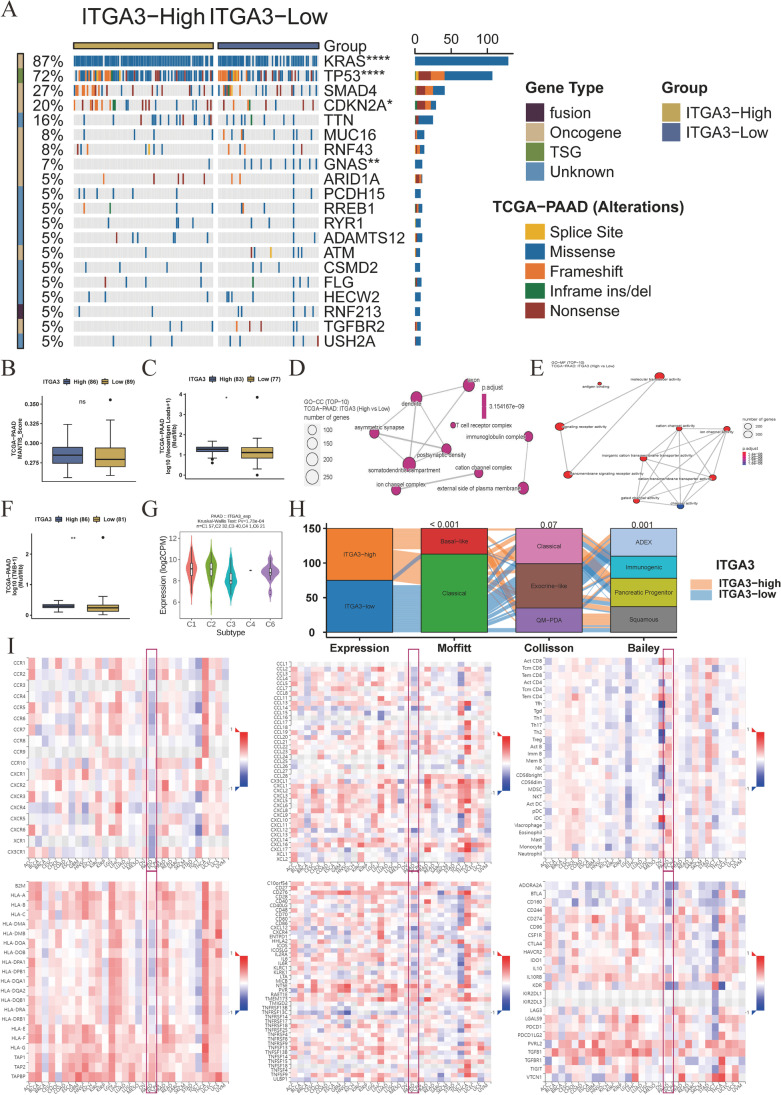
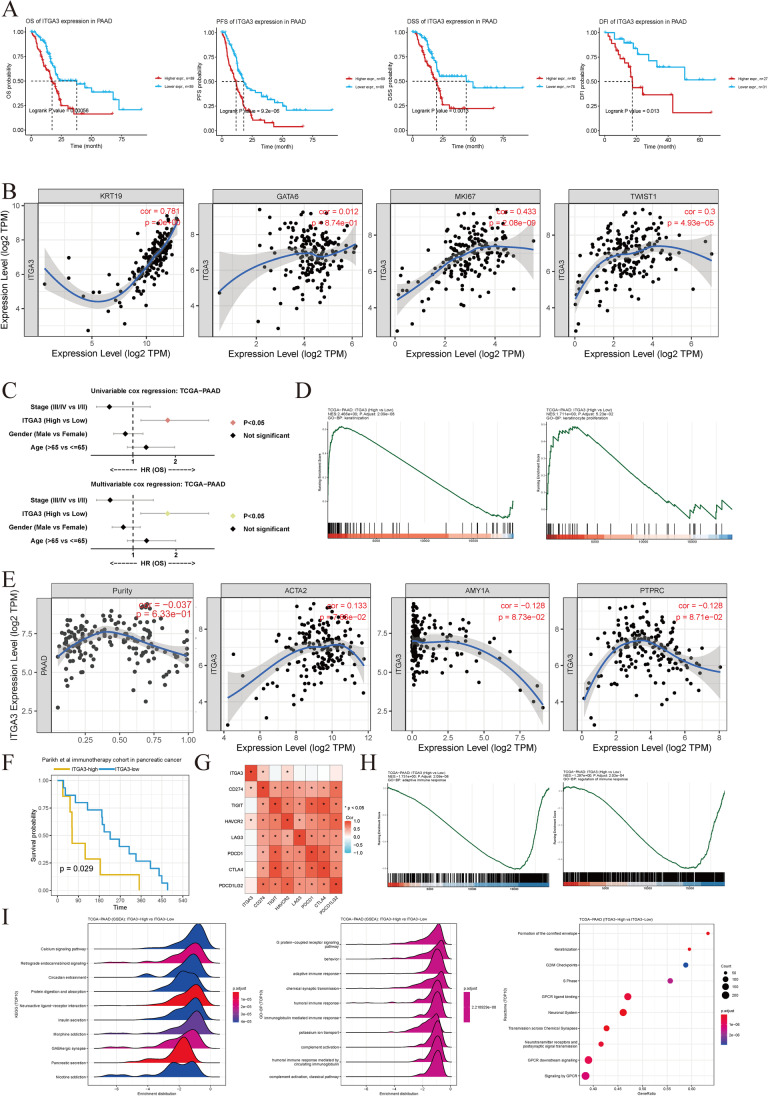
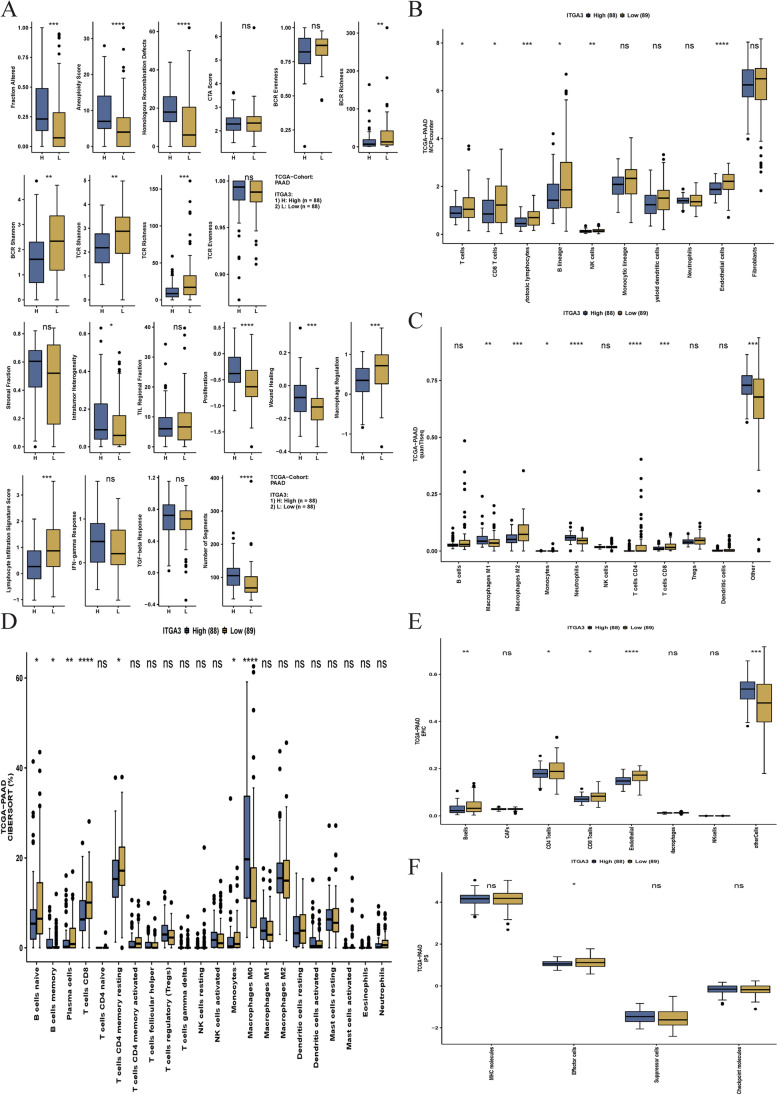
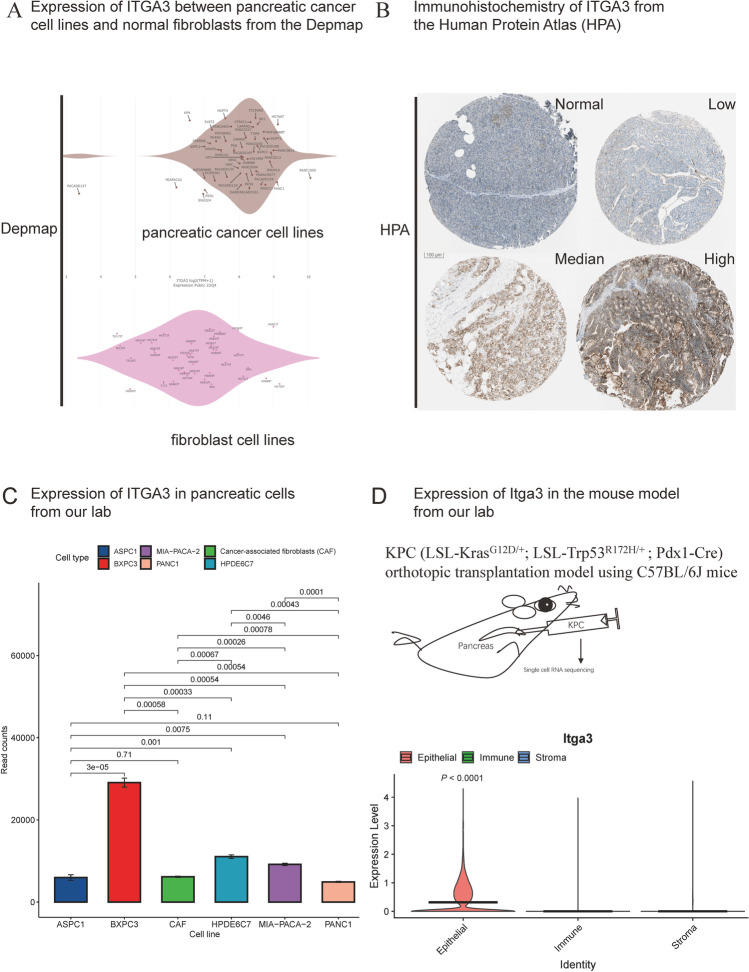
Contribution of integrin superfamily genes to treatment resistance remains uncertain. Genome patterns of thirty integrin superfamily genes were analyzed of using bulk and single-cell RNA sequencing, mutation, copy number, methylation, clinical information, immune cell infiltration, and drug sensitivity data. To select the integrins that are most strongly associated with treatment resistance in pancreatic cancer, a purity-independent RNA regulation network including integrins were constructed using machine learning. The integrin superfamily genes exhibit extensive dysregulated expression, genome alterations, epigenetic modifications, immune cell infiltration, and drug sensitivity, as evidenced by multi-omics data. However, their heterogeneity varies among different cancers. After constructing a three-gene (TMEM80, EIF4EBP1, and ITGA3) purity-independent Cox regression model using machine learning, ITGA3 was identified as a critical integrin subunit gene in pancreatic cancer. ITGA3 is involved in the molecular transformation from the classical to the basal subtype in pancreatic cancer. Elevated ITGA3 expression correlated with a malignant phenotype characterized by higher PD-L1 expression and reduced CD8+ T cell infiltration, resulting in unfavorable outcomes in patients receiving either chemotherapy or immunotherapy. Our findings suggest that ITGA3 is an important integrin in pancreatic cancer, contributing to chemotherapy resistance and immune checkpoint blockade therapy resistance.

Keywords: Chemotherapy resistance; ITGA3; Immunotherapy resistance; Integrin; Machine learning; Pancreatic cancer.


Conflict of interest statement

The authors declare no competing interests.

Figures

Fig. 1
Fig. 1
Expression landscape of integrin superfamily genes in multiple cancer types using bulk RNA sequencing data and pancreatic cancer using the single-nucleus RNA sequencing dataset of Hwang et al. A Boxplots depicting integrin expression in normal and tumor tissue samples from The Cancer Genome Atlas (TCGA) and Genotype-Tissue Expression (GTEx) datasets (n = 20876), with significance assessed using the Wilcoxon sum test. TCGA-pancreatic ductal adenocarcinoma (PAAD) project is highlighted in red. Boxes represent the interquartile range, horizontal lines indicate the median, and whiskers represent 1.5 times the interquartile range. Outliers are represented by individual points. B Dot plot illustrating integrin superfamily gene expression across multiple cell types from the single-cell RNA sequencing dataset of treatment naïve PAAD of Hwang et al (n = 18). Each circle’s size corresponds to the percentage of cells exhibiting gene expression. Gene expression refers to the average expression values of genes rescaled by all cell types. Statistical significance is denoted as follows: *P < 0.05, **P < 0.01, and ***P < 0.001. Cancer project abbreviations are available on the website: https://gdc.cancer.gov/resources-tcga-users/tcga-code-tables/tcga-study-abbreviations
Fig. 2
Fig. 2
Association between survival and prognosis and the enrichment pathways of integrin superfamily genes. A Cox proportional hazard regression modeling showing the association between overall survival (OS, n = 11505), progression-free survival (PFS, n = 11505), disease-specific survival (DSS, n = 10947), and disease-free interval (DFI, n = 5790) with integrin superfamily gene expression. B Bar plot displaying the top 10 Gene Ontology terms for biological processes associated with all integrins (n = 30). C Grid diagram illustrating the cancer pathways of the integrin superfamily genes. Red and blue shades represent the activated and inhibited pathways, respectively (n = 123). D Bubble plot illustrating the Spearman’s correlation between integrin superfamily gene expression and immune infiltration in in pancreatic ductal adenocarcinoma (PAAD, n = 183), adjusted using false discovery rate (FDR). Higher color intensity reflects a stronger correlation, while bubble size represents FDR significance. Bubbles with black borders have FDRs < 0.05. Abbreviations for the cancer project are available at https://gdc.cancer.gov/resources-tcga-users/tcga-code-tables/tcga-study-abbreviations. Abbreviations and definitions for infiltrated immune cells were provided by the Immune Cell Abundance Identifier (ImmuCellAI)
Fig. 3
Fig. 3
Mutation and alteration landscapes of integrin superfamily genes across multiple cancer types. A Deleterious mutations in integrin superfamily genes. The numbers within the boxes represent the number of deleterious gene mutations in different cancer types. An increase in color intensity indicates an increase in the percentage of deleterious mutations (n = 10234). B Pie charts showing the proportions of copy number alterations across cancer types (n = 11461). The red rectangle highlights information related to copy number variations in pancreatic ductal adenocarcinoma (PAAD, n = 184). CNV copy number variation, SNV single-nucleotide variation. The abbreviations for the cancer projects are available on the website: https://gdc.cancer.gov/resources-tcga-users/tcga-code-tables/tcga-study-abbreviations
Fig. 4
Fig. 4
DNA methylation of integrins in human cancers. A Bubble plot comparing methylation levels (β values) of integrin superfamily genes in normal and tumor tissues across multiple cancer types from The Cancer Genome Atlas (TCGA). Cancer types with < 10 normal samples were excluded (n = 6560). Bubble color represents methylation level differences between tumor and normal samples, ranging from blue to red. P values were estimated using the two-tailed unpaired t test and adjusted using the false discovery rate (FDR). Bubbles with black borders indicate FDRs < 0.05. Bubble size indicates FDR significance, while color intensity increases with correlation. B Spearman’s correlation between DNA methylation levels (β values) and cell infiltration degree for each cancer type from TCGA, evaluated using ImmuCellAI (n = 183). P values were adjusted using FDR. Color intensity increases with correlation. Bubbles with black borders represent FDRs < 0.05. Bubble size indicates FDR significance. C Boxplots showing the distribution of DNA methylation levels (β values) of integrins among normal pancreatic tissues, TP53 wild-type, and TP53 mutant pancreatic cancer tissues (n = 192). P values were calculated using the two-tailed unpaired t-test. Boxes indicate the interquartile range, horizontal lines represent the median, and whiskers indicate values 1.5 times the interquartile range. Abbreviations for cancer projects are available at https://gdc.cancer.gov/resources-tcga-users/tcga-code-tables/tcga-study-abbreviations. Abbreviations and definitions for infiltrated cells were provided by Immune Cell Abundance Identifier (ImmuCellAI). Methy.diff methylation difference, ns no significance
Fig. 5
Fig. 5
Construction and validation of the purity-independent regulatory network. A Heatmap displaying eligible lncRNA–miRNA–mRNA pairs supported by GDCRNAtools. Only experiments confirming RNA relationships were included. RNA relationships with consistent evidence support across datasets with varying tumor purity levels were considered preserved in pancreatic cancer (n = 3). B Model coefficients (top axis) versus the logarithm of lambda (bottom axis) for LASSO analysis of the construction group (n = 540). The coefficients of three genes were non-zero at lambda.1se, which represents the lambda value generating the most regularized model with cross-validated errors within one standard error of the minimum. C Three-fold cross-validation C-indexes versus the logarithm of lambda (bottom axis) and the number of non-zero coefficients (top axis) in the construction group (n = 540). D Kaplan–Meier curve illustrating the high- and low-risk groups in the construction model using the three-gene model (n = 540, log-rank test, P < 0.0001). E Kaplan–Meier curve illustrating the high- and low-risk groups in the validation model using the three-gene model (n = 288, log-rank test, P = 0.0067). F Risk score (RS) panel of the construction model (n = 540). G Risk score (RS) panel of the validation model (n = 288)
Fig. 6
Fig. 6
Prognosis-related purity-independent three-gene network visualization. A Purity-independent regulatory network constructed using 3 prognosis-related mRNAs, 15 miRNAs, and 3 lncRNAs. B Time-dependent receiver operating characteristic (ROC) curves of the construction group (n = 540) for overall survival prediction using the three-gene model. C One-year time-dependent ROC curves for overall survival, showing higher area under the curve (AUC) values for the three-gene model compared to other clinic al factors in the validation groups (n = 288). D Time-dependent ROC curves of the validation group (n = 288) for overall survival prediction using the three-gene model. E One-year time-dependent ROC curves for overall survival, demonstrating higher AUC values for the three-gene model compared to other clinical factors in the validation groups (n = 288). F Decision curve analysis of the three-gene model, clinical models, and the combined model at 12 months post-pancreatectomy in the construction group (n = 540). G Frequency count of variables selected using the LASSO algorithm, repeated 1000 times in The Cancer Genome Atlas (TCGA) using BLASSO (n = 160). H Violin plot of ITGA3 expression constructed using the single-cell pancreatic cancer dataset of Peng et al. Cell types are arranged from left to right based on decreasing ITGA3 expression (n = 35)
Fig. 7
Fig. 7
Association of ITGA3 with genomic and molecular characteristics of pancreatic cancer. A Mutation landscape of the ITGA3-high and ITGA3-low expression groups. The Fisher’s exact test was used to determine statistical differences between groups (n = 175). B Microsatellite Analysis for Normal-Tumor InStability (MANTIS) scores in the ITGA3-high and ITGA3-low groups (n = 175). C Neoantigen loads in the ITGA3-high and ITGA3-low groups (n = 160). D Gene Ontology (GO) analysis of cell component (CC) in the ITGA3-high and ITGA3-low groups (n = 179). E GO analysis of molecular function (MF) in the ITGA3-high and ITGA3-low groups. Adjusted P values were calculated using the one-sided Fisher’s exact test and corrected for multiple hypotheses using the Benjamini–Hochberg false discovery rate (FDR) of 5% (n = 179). F Tumor mutation burden (TMB) in the ITGA3-high and ITGA3-low groups (n = 167). G Differential expression of ITGA3 among immune subtypes (n = 151). H High expression of ITGA3 in common molecular subtypes, including Moffit basal subtypes, Collisson quasimesenchymal subtypes (QM-PDA), and Bailey squamous subtypes. Differences between groups were assessed using the chi-square test (n = 150). I Spearman’s correlation analysis between ITGA3 and receptors, chemokines, tumor-infiltrating lymphocytes, MHC molecules, immune stimulators, and inhibitors in pan-cancer analysis. Blue squares indicate negative correlations, while red squares indicate positive correlations; darker colors indicate stronger correlations (n = 179). B, C, F, and G: Data represented as boxplots, and differences in immune-related scores or immune cells were compared using the Mann–Whitney U test. Boxes represent interquartile ranges, horizontal lines within each box represent the median, and whiskers represent values 1.5 times the interquartile range. Black dots indicate outliers. Statistical significance is indicated as follows: *P < 0.05, **P < 0.01, ***P < 0.001, and ****P < 0.0001
Fig. 8
Fig. 8
Association of ITGA3 expression with chemotherapy and immunotherapy resistance. A ITGA3 is a risk factor for overall survival (OS, n = 178), progression-free survival (PFS, n = 178), disease-specific survival (DSS, n = 158), and disease-free interval (DFI, n = 58) (P values determined using log-rank tests). B Correlation of ITGA3 with KRT19 (malignant ductal cell marker, Spearman’s correlation coefficient: 0.781, P < 0.001), MKI67 (cell proliferation marker, Spearman’s correlation coefficient: 0.433, P < 0.001), and TWIST (EMT marker, Spearman’s correlation coefficient: 0.3, P < 0.001). ITGA3 expression is independent of GATA6 expression (pancreatic cancer basal-classical subtype marker, Spearman correlation, P > 0.05). n = 179 C ITGA3 is a superior univariable and multivariable hazard factor compared to clinical markers (stage, age, and sex) based on CAMOIP. D Gene set enrichment analysis (GSEA) of Gene Ontology (GO) terms for biological processes in the ITGA3-high and ITGA3-low expression groups. Adjusted P values were calculated using the one-sided Fisher’s exact test and corrected for multiple hypotheses using the Benjamini–Hochberg false discovery rate (FDR) of 5% (n = 179). E Spearman’s correlation analysis of ITGA3 expression and cell component markers (ACTA2, AMY1A, and PTPRC), indicating the purity independence of ITGA3 expression in pancreatic cancer (P > 0.05, n = 179). F ITGA3 was associated with immunotherapy resistance for OS (Parikh et al., , n = 23). P values determined using log-rank tests (P < 0.05). G Positive correlation between ITGA3 expression and the immunotherapy genes CD274 (PD-L1) and HAVCR2 (Spearman’s correlation, P < 0.05). n = 179 H GSEA of GO terms for biological processes indicating the suppression of adaptive immunity in patients with high ITGA3 expression. n = 179 I GSEA of Kyoto Encyclopedia of Genes and Genomes (KEGG) pathways and GO terms for biological processes, as well as Reactome analysis in patients with high ITGA3 expression (n = 179). Adjusted P values were calculated using the one-sided Fisher's exact test and corrected for multiple hypotheses using FDR
Fig. 9
Fig. 9
Effect of ITGA3 expression on immune response pathways and cell composition in pancreatic cancer tissue. A Gene set variation analysis (GSVA) comparing immune response pathways in ITGA3-high and ITGA3-low groups (n = 176). BE Deconvolution results of cell components using bulk RNA sequencing with The Cancer Genome Atlas-pancreatic ductal adenocarcinoma (TCGA–PAAD) dataset (n = 177). Cell composition analyzed using MCPcounter (B), quanTIseq (C), CIBERSORT (D), EPIC (E), and IPS (F) in samples with high and low ITGA3 expression. Boxplots illustrate the data, and the Mann–Whitney U test was used to compare immune-related scores or immune cells. Boxes represent the interquartile range, horizontal lines represent the median, and whiskers indicate values 1.5 times the interquartile range. Outliers are depicted as black dots. Note: ns no significance; *P < 0.05, **P < 0.01, and ***P < 0.001
Fig. 10
Fig. 10
Validation of ITGA3 expression in pancreatic cancer. A Expression of ITGA3 in pancreatic cancer cell lines and normal fibroblasts from the Cancer Dependency Map Project (DepMap, n = 88). B Immunohistochemistry of ITGA3 in pancreatic tissue and cancer samples from the Human Protein Atlas (HPA, n = 4). C ITGA3 expression in pancreatic cells (PANC-1, BxPC3, HPDE6C7, ASPC1, MIA-PACA-2, and cancer-associated fibroblasts [CAFs]) in our laboratory; each sequencing analysis was performed three times. Gene expression differences among cell lines were compared using the t-test, n = 3. D Validation of Itga3 expression using single-cell RNA sequencing in a mouse model developed in our laboratory. The violin plot illustrates significantly higher expression of Itga3 in epithelial cells than in immune cells (P < 0.0001) and stroma cells (P < 0.0001). Gene expression differences between epithelial cells and other cells were compared using the Mann–Whitney U test, n = 4

Similar articles

Cited by

References

    1. Abdollahzadeh R, Daraei A, Mansoori Y, Sepahvand M, Amoli MM, Tavakkoly-Bazzaz J. Competing endogenous RNA (ceRNA) cross talk and language in ceRNA regulatory networks: A new look at hallmarks of breast cancer. J Cell Physiol. 2019;234(7):10080–10100. doi: 10.1002/jcp.27941. - DOI - PubMed
    1. Akagbosu B, Tayyebi Z, Shibu G, Paucar Iza YA, Deep D, Parisotto YF, Fisher L, Pasolli HA, Thevin V, Elmentaite R, Knott M, Hemmers S, Jahn L, Friedrich C, Verter J, Wang ZM, van den Brink M, Gasteiger G, Grunewald TGP, Marie JC, Leslie C, Rudensky AY, Brown CC. Novel antigen-presenting cell imparts T (reg)-dependent tolerance to gut microbiota. Nature. 2022;610(7933):752–760. doi: 10.1038/s41586-022-05309-5. - DOI - PMC - PubMed
    1. Aran D, Looney AP, Liu L, Wu E, Fong V, Hsu A, Chak S, Naikawadi RP, Wolters PJ, Abate AR, Butte AJ, Bhattacharya M. Reference-based analysis of lung single-cell sequencing reveals a transitional profibrotic macrophage. Nat Immunol. 2019;20(2):163–172. doi: 10.1038/s41590-018-0276-y. - DOI - PMC - PubMed
    1. Athar A, Fullgrabe A, George N, Iqbal H, Huerta L, Ali A, Snow C, Fonseca NA, Petryszak R, Papatheodorou I, Sarkans U, Brazma A. ArrayExpress update - from bulk to single-cell expression data. Nucleic Acids Res. 2019;47(D1):D711–D715. doi: 10.1093/nar/gky964. - DOI - PMC - PubMed
    1. Badheeb M, Abdelrahim A, Esmail A, Umoru G, Abboud K, Al-Najjar E, Rasheed G, Alkhulaifawi M, Abudayyeh A, Abdelrahim M. Pancreatic tumorigenesis: precursors, genetic risk factors and screening. Curr Oncol. 2022;29(11):8693–8719. doi: 10.3390/curroncol29110686. - DOI - PMC - PubMed

Publication types