. 2023 Sep;165(3):656-669.e8.
doi: 10.1053/j.gastro.2023.05.041. Epub 2023 Jun 2.

Hypusination Maintains Intestinal Homeostasis and Prevents Colitis and Carcinogenesis by Enhancing Aldehyde Detoxification

Affiliations

Hypusination Maintains Intestinal Homeostasis and Prevents Colitis and Carcinogenesis by Enhancing Aldehyde Detoxification

Alain P Gobert et al. Gastroenterology. 2023 Sep.

Abstract

Background & aims: The amino acid hypusine, synthesized from the polyamine spermidine by the enzyme deoxyhypusine synthase (DHPS), is essential for the activity of eukaryotic translation initiation factor 5A (EIF5A). The role of hypusinated EIF5A (EIF5AHyp) remains unknown in intestinal homeostasis. Our aim was to investigate EIF5AHyp in the gut epithelium in inflammation and carcinogenesis.

Methods: We used human colon tissue messenger RNA samples and publicly available transcriptomic datasets, tissue microarrays, and patient-derived colon organoids. Mice with intestinal epithelial-specific deletion of Dhps were investigated at baseline and in models of colitis and colon carcinogenesis.

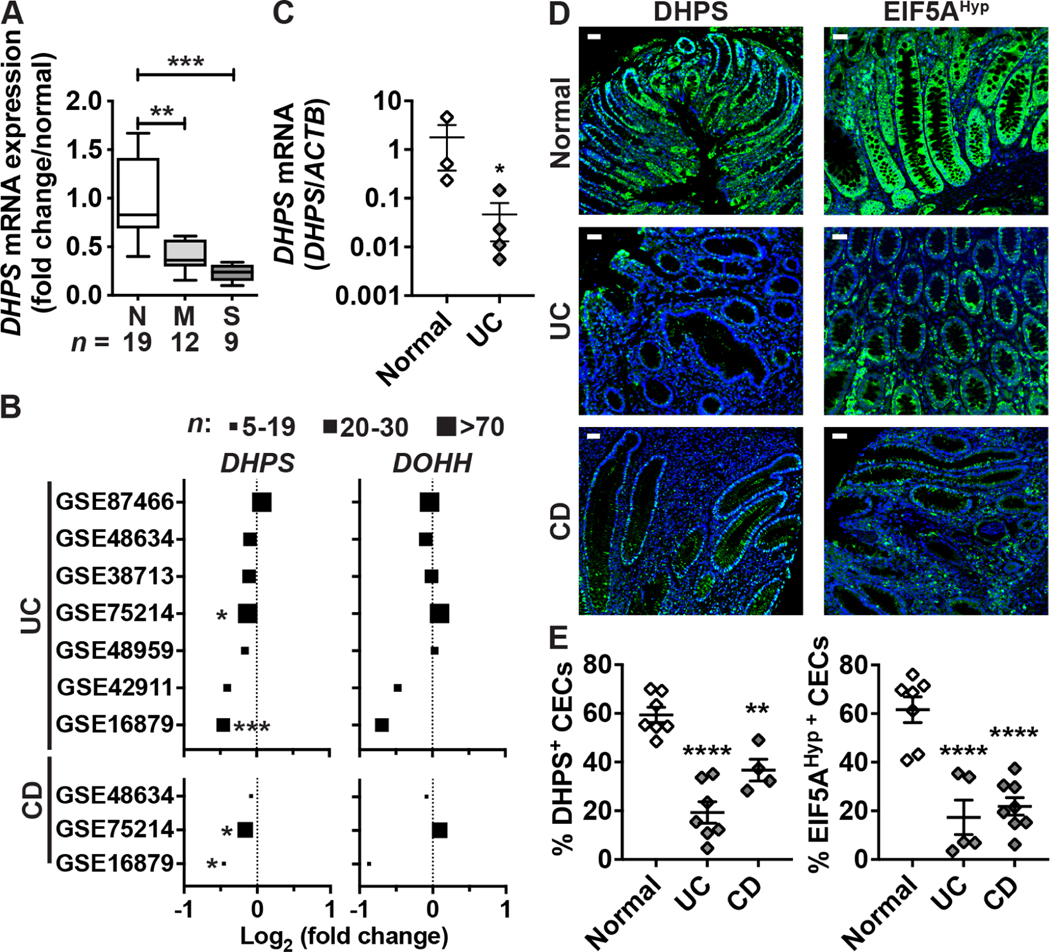
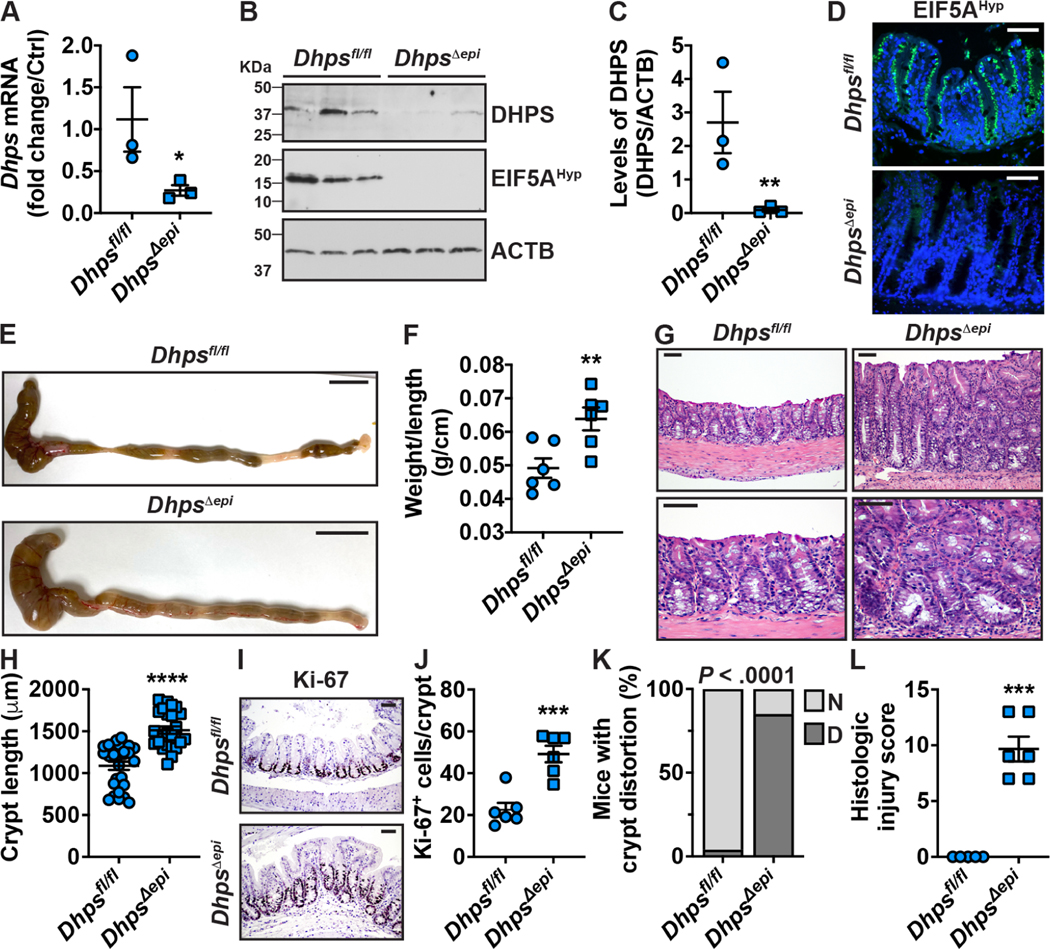
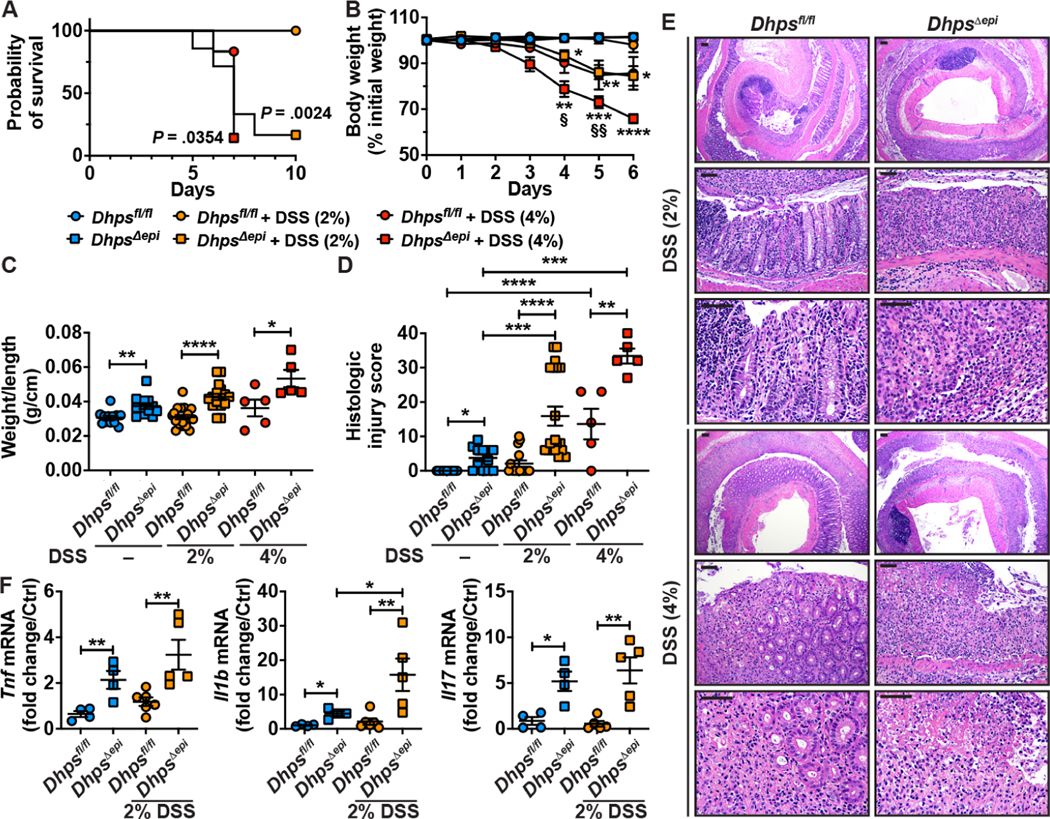
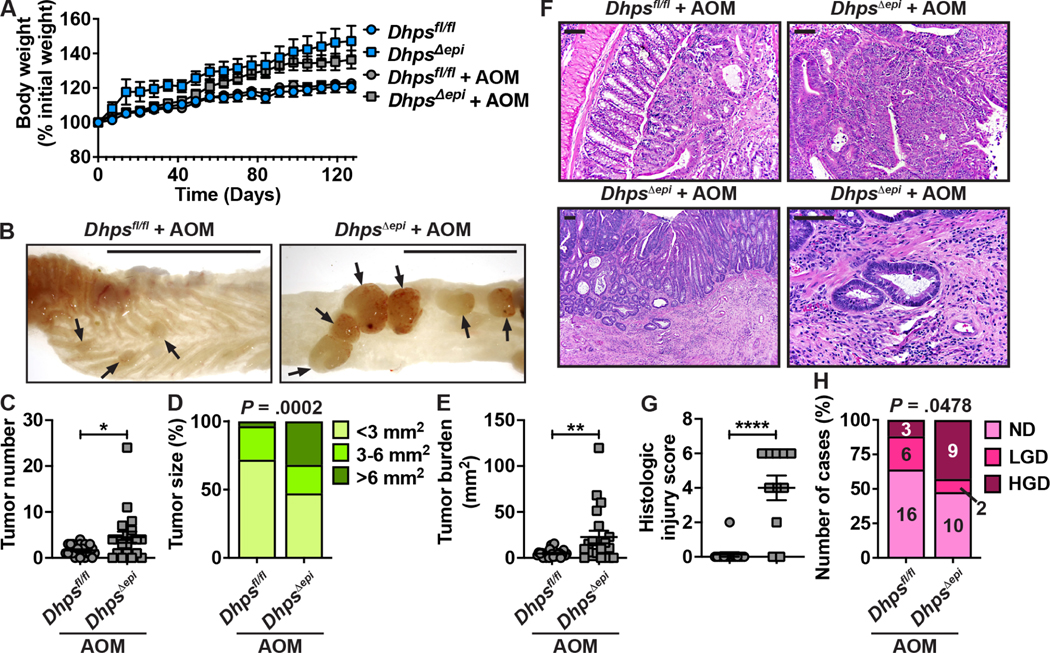
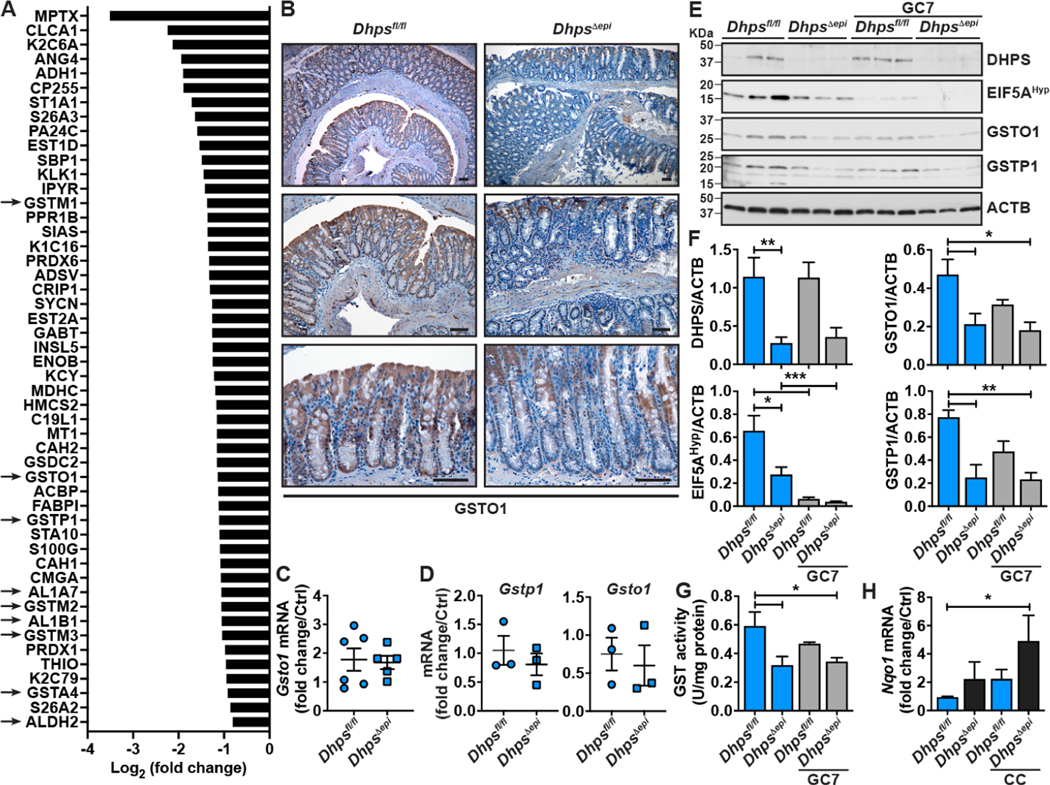
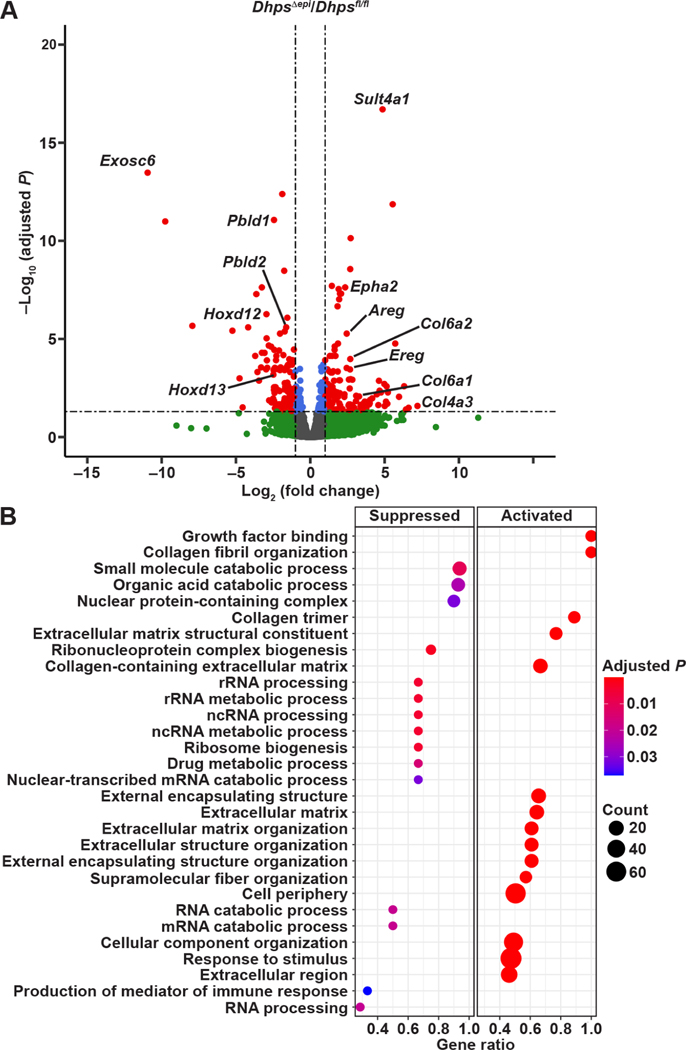
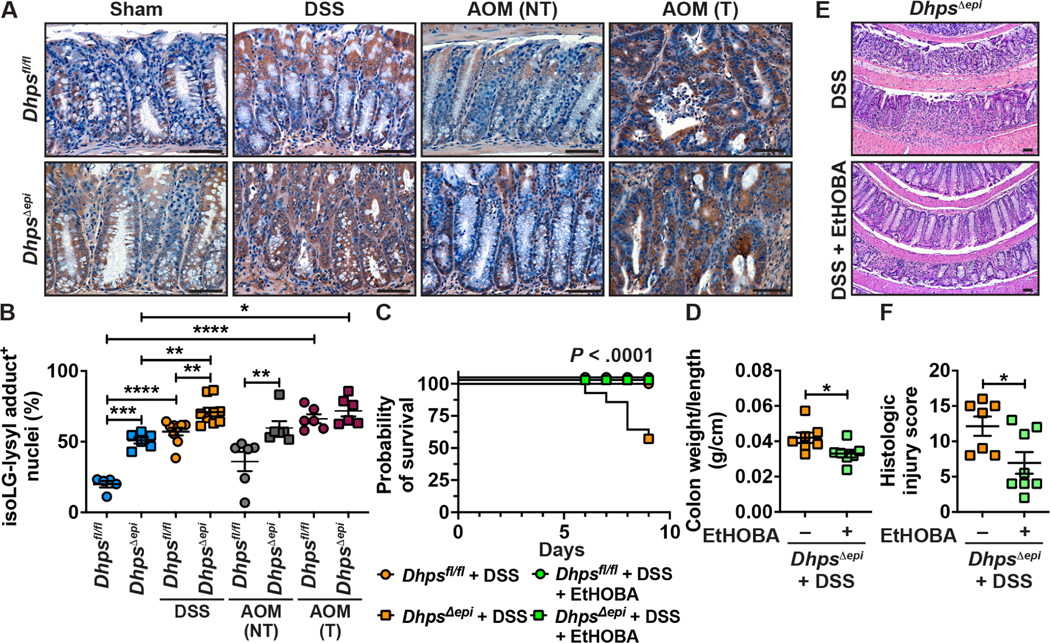
Results: We found that patients with ulcerative colitis and Crohn's disease exhibit reduced colon levels of DHPS messenger RNA and DHPS protein and reduced levels of EIF5AHyp. Similarly, colonic organoids from colitis patients also show down-regulated DHPS expression. Mice with intestinal epithelial-specific deletion of Dhps develop spontaneous colon hyperplasia, epithelial proliferation, crypt distortion, and inflammation. Furthermore, these mice are highly susceptible to experimental colitis and show exacerbated colon tumorigenesis when treated with a carcinogen. Transcriptomic and proteomic analysis on colonic epithelial cells demonstrated that loss of hypusination induces multiple pathways related to cancer and immune response. Moreover, we found that hypusination enhances translation of numerous enzymes involved in aldehyde detoxification, including glutathione S-transferases and aldehyde dehydrogenases. Accordingly, hypusination-deficient mice exhibit increased levels of aldehyde adducts in the colon, and their treatment with a scavenger of electrophiles reduces colitis.

Conclusions: Hypusination in intestinal epithelial cells has a key role in the prevention of colitis and colorectal cancer, and enhancement of this pathway via supplementation of spermidine could have a therapeutic impact.

Keywords: Colon Cancer; Hypusine; Inflammation; Intestinal Epithelial Cells.


Figures

Figure 1.
Figure 1.
Expression of DHPS in patients with colitis. (A) Total RNA was extracted from colon biopsies from normal (N; n = 19) or UC patients with moderate (M; n = 12) or severe (S; n = 9) colitis. DHPS mRNA levels were determined by RT-real-time PCR. **P < .01, ***P < .001 by ANOVA and Tukey test. (B) RNA-Seq data was interrogated from published studies using the GEO data repository to determine the expression of the genes DHPS and DOHH in patients with UC or CD compared to normal individuals. n indicates the number of patients with colitis in each study. *P < .05, ***P < .001 by the Benjamini & Hochberg test adjusted for false discovery rate. (C) DHPS mRNA expression was assessed by quantitative RT-PCR in colon organoids from normal or UC tissues. Each dot represents the mean of 2–3 experiments performed with colonoids from each patient; *P < .05 using the unpaired t test. (D-E) Tissues sections of two TMAs were immunostained for DHPS or EIF5AHyp and representative images of normal tissues (n = 7) or tissues from patients with UC (n = 7) or CD (n = 4) are shown in (D) with scale bar, 50 μm; (E) Quantification using QuPath of DHPS+ and EIF5AHyp+ epithelial cells among total CECs on the TMAs. **P < .01, ****P < .0001 by ANOVA and Dunnett’s test.
Figure 2.
Figure 2.
Effect on the colon of the selective depletion of Dhps in IECs. CECs from 7-wk-old Dhpsfl/fl and DhpsΔepi mice were isolated and the expression of Dhps mRNA was assessed by RT-real time PCR (A). The level of DHPS and EIF5AHyp was analyzed by Western blot (B) followed by densitometry (C). (D) IF for EIF5AHyp in the colon; representative image of 3 mice/genotype. The colon of these animals (3 males and 3 females per genotype) was removed (E) and length and weight were measured (F). Longitudinal sections were stained by H&E (G). Crypt length was determined using ImageJ 1.53a (n = 25–27 crypts counted from 6 different mice per genotype) (H). Proliferation was determined by IHC for Ki-67 (I) and quantification of Ki-67-positive nuclei (J); a total of 100 crypts were counted per mouse. The number of animals (n = 26/genotype) exhibiting normal crypt (N) or crypt distortion (D) (K) and the histologic injury scores (L) were evaluated by our pathologist in a blinded manner. In all the panels with dot plots, *P < .05, **P < .01, ***P < .001, ****P < .0001 by unpaired Student’s t test; in K, P was calculated using the Fisher’s exact test. Scale bars represent 1 cm (E) or 50 μm (D, G, H).
Figure 3.
Figure 3.
DSS-induced colitis in Dhpsfl/fl and DhpsΔepi mice. Animals were treated or not with 2% or 4% DSS. (A) Kaplan-Meier curves of DSS-treated mice; the P value was obtained using the Log-rank test (n = 7–20 mice/group). (B) Body weights were measured daily and are depicted as percentage of initial body weight; *P < .05, **P < .01, ***P < .001, ****P < .0001 compared to untreated DhpsΔepi mice, and §P < .05, §§P < .01 versus Dhpsfl/fl + 4% DSS, by two-way ANOVA and Tukey test. (C) Colons were harvested, washed, weighed, and measured. (D) Histological injury was determined from H&E staining (E); the scale bars on the low-power and high-power photomicrographs correspond to 100 μm and 50 μm, respectively. (F) mRNA expression from the colonic mucosa; Dhpsfl/fl mice were used as control for the semi-quantitative analysis. In all panels with dot plots, *P < .05, **P < .01, ***P < .001 by two-way ANOVA and Tukey test.
Figure 4.
Figure 4.
Effect of epithelial Dhps deletion on colon carcinogenesis. Dhpsfl/fl (n = 25) and DhpsΔepi mice (n = 22) were given 6 i.p. injections of 12.5 mg/kg AOM. Note that two DhpsΔepi mice died between day 119 and 127 (P = 0.132), and that none of the control animals that did not receive AOM developed tumors. (A) Body weights are depicted as percentage of initial body weight. (B-E) Colons were harvested, opened longitudinally (B) and tumors (arrow) were counted (C) and measured (D); in D, the percentages were determined from a total of 57 and 91 tumors in Dhpsfl/fl and DhpsΔepi mice, respectively. Tumor burden (E) corresponds to the sum of the surface area of all the tumors in each mouse. (F-H) H&E staining (F) was used to assess histologic injury (G) and the grade of dysplasia (H). In F, the photomicrographs in the upper panels for Dhpsfl/fl and DhpsΔepi mice show LGD and HGD, respectively; the lower panels depict an invasive carcinoma; scale bars, 50 μm. *P < .05, **P < .01, ****P < .0001 by Student’s t test; in D and H, the P values were calculated using the Chi-square test.
Figure 5.
Figure 5.
Effect of hypusination on the proteome of CECs. (A) iTRAQ was used to determine the differential expression of the proteins from isolated Dhpsfl/fl and DhpsΔepi CECs (n = 3 mice per group). This figure depicts a list of 50 proteins significantly downregulated in DhpsΔepi CECs compared to Dhpsfl/fl control CECs; the arrows highlight the proteins involved in aldehyde detoxification. (B) IHC for GSTO1 in the colon of Dhpsfl/fl and DhpsΔepi mice. These photomicrographs are representative of 6 animals per genotype; scale bars, 50 μm. The images are representatives of 5 mice/condition. (C-D) Gsto1 and Gstp1 mRNA levels in the colon (C) and in colonoids (D) of Dhpsfl/fl and DhpsΔepi mice. (E-F) The level of DHPS, EIF5AHyp, GSTO1, and GSTP1 was assessed by Western blot in colonoids from Dhpsfl/fl and DhpsΔepi mice, cultured or not for 24 h with 25 μM GC7 (E), followed by densitometry (F). (G) Total GST activity was determined in the same colonoids ± GC7. (H) Expression of the gene Nqo1 in Dhpsfl/fl and DhpsΔepi colonoids stimulated for 24 h with a cytokine cocktail (CC) composed of IFN-γ, IL-1β, and TNF-α. In bar graphs, *P < .05, **P < .01, ***P < .001 by one-way ANOVA and Dunnett’s test.
Figure 6.
Figure 6.
Transcriptomic changes orchestrated by DHPS in CECs. (A) RNA extracted from CECs from Dhpsfl/fl and DhpsΔepi (n = 3 mice per group) was sequenced, and the volcano plot corresponding to the DEGs in DhpsΔepi mice compared to Dhpsfl/fl animals was generated using R; red dots correspond to genes significantly (P < .05) up- or downregulated by 2–fold or more. All the genes are provided in Supplementary Table 4. (B) Pathway analysis of DEGs by GSEA; the complete list of pathways is shown in Supplementary Table 5.
Figure 7.
Figure 7.
Levels and role of reactive aldehydes associated with Dhps deletion. (A-B) The levels of isoLG-lysyl adducts in the colon of Dhpsfl/fl and DhpsΔepi mice (n = 2–3 per group), treated or not with DSS or AOM, was assessed by immunostaining with D11 Ab and the images presented are representative of 2–3 mice/group. (A); the quantification of cells with positive staining for isoLG-lysyl adducts in the nucleus is shown in B. Each dot represents a crypt; *P < .05, **P < .01, ***P < .001, and ****P < .0001 by one-way ANOVA and Tukey test. (C-F) DhpsΔepi mice were given 2% DSS (n = 15) or DSS ± EtHOBA (n = 19). Survival was assessed by Kaplan-Meier curves and the P value was calculated by the Log-rank test (C); only the female mice died in this experiment. The weight and length of the colons of DhpsΔepi mice + DSS ± EtHOBA were measured and expressed as a ratio (D). H&E staining (E) was used to score histologic injury in male mice (F). *P < .05 by Student’s t test. Dhpsfl/fl treated with 2% DSS did not develop significant increase in histologic injury score compared to control animals, and EtHOBA had no significant effect on these mice. In A and E, the scale bars represent 50 μm.

References

    1. Dahlhamer JM, Zammitti EP, Ward BW, et al. Prevalence of Inflammatory Bowel Disease Among Adults Aged >/=18 Years - United States, 2015. MMWR Morb Mortal Wkly Rep 2016; 65:1166–1169. - PubMed
    1. Singh P, Ananthakrishnan A, Ahuja V. Pivot to Asia: inflammatory bowel disease burden. Intestinal research 2017; 15:138–141. - PMC - PubMed
    1. Munkholm P. Review article: the incidence and prevalence of colorectal cancer in inflammatory bowel disease. Aliment Pharmacol Ther 2003; 18 Suppl 2:1–5. - PubMed
    1. Wang Y, Devereux W, Woster PM, et al. Cloning and characterization of a human polyamine oxidase that is inducible by polyamine analogue exposure. Cancer Res 2001; 61:5370–5373. - PubMed
    1. Gobert AP, Al-Greene NT, Singh K, et al. Distinct immunomodulatory effects of spermine oxidase in colitis induced by epithelial injury or infection. Front Immunol 2018; 9:1242. - PMC - PubMed

Publication types