. 2023 Aug:74:101749.
doi: 10.1016/j.molmet.2023.101749. Epub 2023 Jun 2.

Maresin 1 activates brown adipose tissue and promotes browning of white adipose tissue in mice

Affiliations

Maresin 1 activates brown adipose tissue and promotes browning of white adipose tissue in mice

Laura M Laiglesia et al. Mol Metab. 2023 Aug.

Abstract

Objective: Maresin 1 (MaR1) is a docosahexaenoic acid-derived proresolving lipid mediator with insulin-sensitizing and anti-steatosis properties. Here, we aim to unravel MaR1 actions on brown adipose tissue (BAT) activation and white adipose tissue (WAT) browning.

Methods: MaR1 actions were tested in cultured murine brown adipocytes and in human mesenchymal stem cells (hMSC)-derived adipocytes. In vivo effects of MaR1 were tested in diet-induced obese (DIO) mice and lean WT and Il6 knockout (Il6-/-) mice.

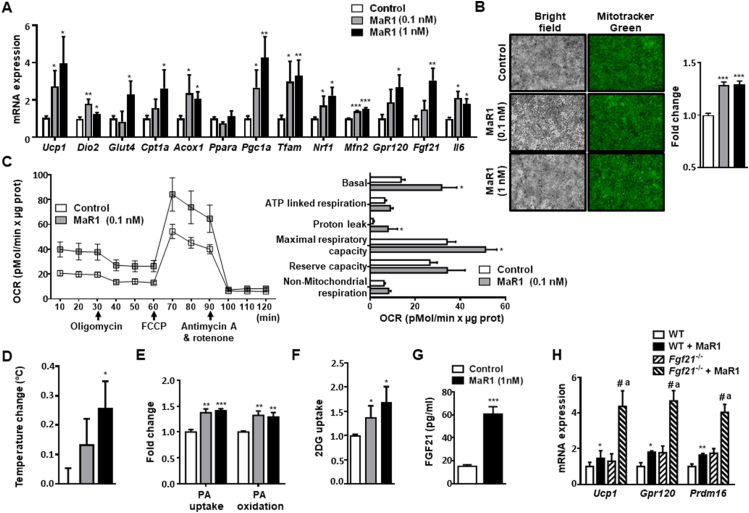
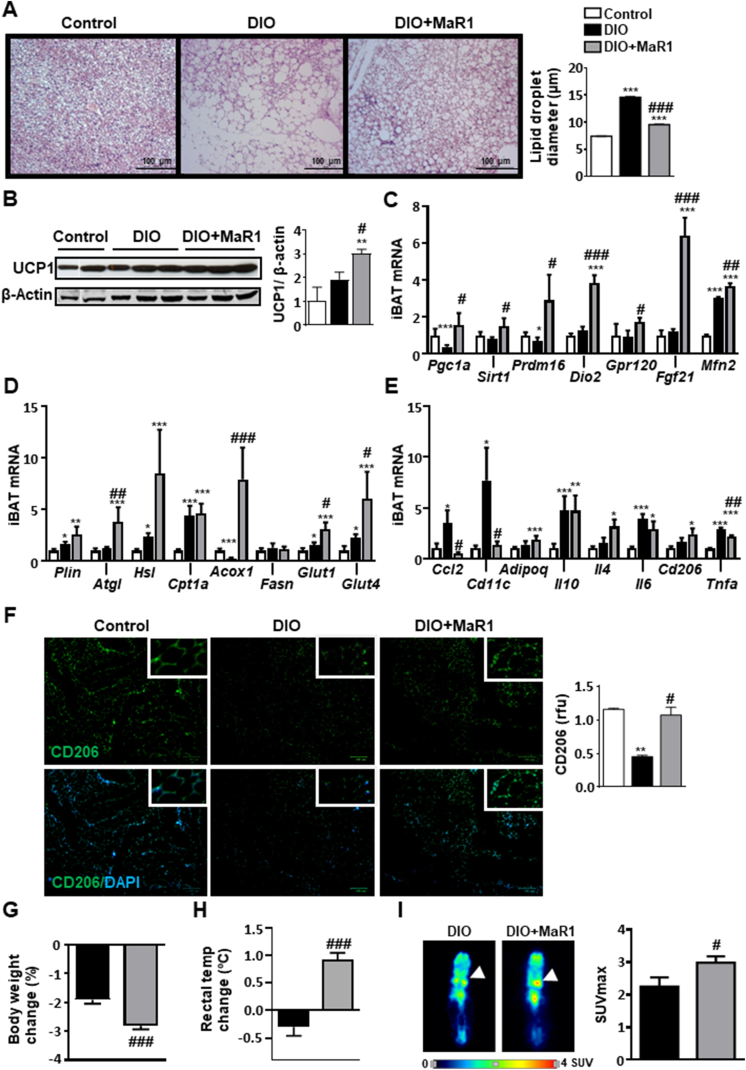
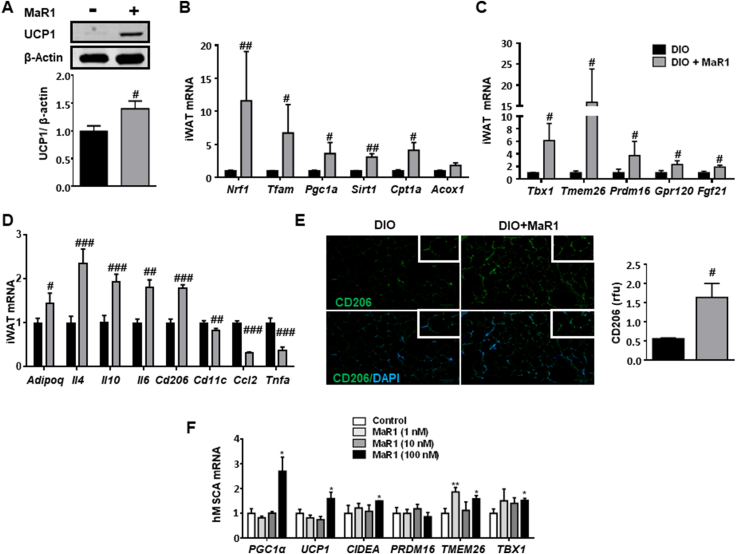
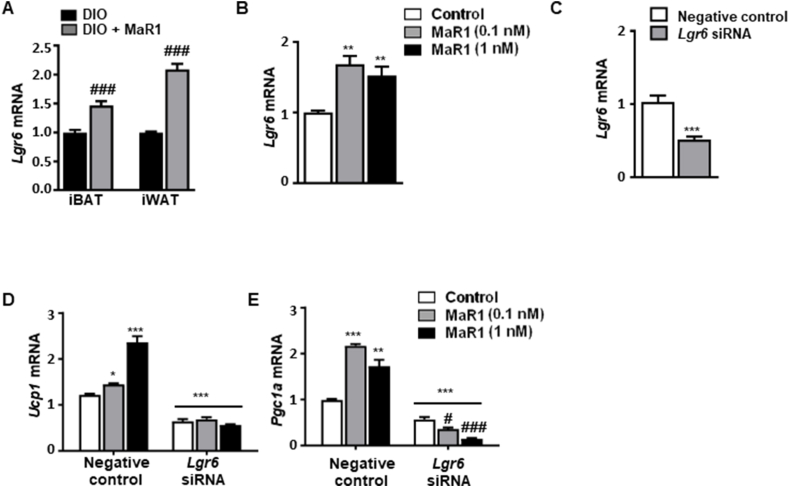
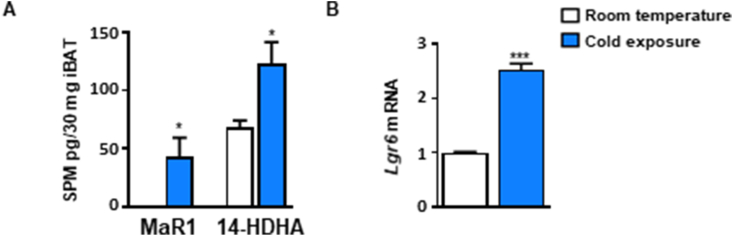
Results: In cultured differentiated murine brown adipocytes, MaR1 reduces the expression of inflammatory genes, while stimulates glucose uptake, fatty acid utilization and oxygen consumption rate, along with the upregulation of mitochondrial mass and genes involved in mitochondrial biogenesis and function and the thermogenic program. In Leucine Rich Repeat Containing G Protein-Coupled Receptor 6 (LGR6)-depleted brown adipocytes using siRNA, the stimulatory effect of MaR1 on thermogenic genes was abrogated. In DIO mice, MaR1 promotes BAT remodeling, characterized by higher expression of genes encoding for master regulators of mitochondrial biogenesis and function and iBAT thermogenic activation, together with increased M2 macrophage markers. In addition, MaR1-treated DIO mice exhibit a better response to cold-induced BAT activation. Moreover, MaR1 induces a beige adipocyte signature in inguinal WAT of DIO mice and in hMSC-derived adipocytes. MaR1 potentiates Il6 expression in brown adipocytes and BAT of cold exposed lean WT mice. Interestingly, the thermogenic properties of MaR1 were abrogated in Il6-/- mice.

Conclusions: These data reveal MaR1 as a novel agent that promotes BAT activation and WAT browning by regulating thermogenic program in adipocytes and M2 polarization of macrophages. Moreover, our data suggest that LGR6 receptor is mediating MaR1 actions on brown adipocytes, and that IL-6 is required for the thermogenic effects of MaR1.

Keywords: Brown/beige adipose tissue; Interleukin-6; LGR6; Maresin 1; Obesity.


Conflict of interest statement

Declaration of competing interest The authors declare that they have no known competing financial interests or personal relationships that could have appeared to influence the work reported in this paper.

Figures

Figure 1
Figure 1
MaR1 upregulates thermogenic genes and promotes glucose uptake and fatty acid utilization in cultured fully differentiated murine brown adipocytes. (A) mRNA expression levels of genes involved in metabolism and function in murine brown adipocytes treated with MaR1 (0.1, 1 nM) for 24 h (n = 3–12). (B) Analysis of mitochondrial content by mitotracker green staining. Representative images and fluorescence intensity quantification of live cell imaging of mitochondria stained with mitotracker green FM probe (100 nM, 30 min) in murine brown adipocytes treated with MaR1 (0.1, 1 nM) for 24 h (n = 6). (C) Oxygen consumption rate (OCR) was measured in brown adipocytes (control and treated with MaR1 for 24 h) with a Seahorse technology. Left panel shows a representative experiment. Right panel: Bioenergetic parameters were inferred from the OCR traces. FCCP (carbonyl cyanide-p-trifluoromethoxyphenyl-hydrazon) (n = 3–4). (D) Changes in brown adipocytes temperature measured by highly sensitive thermography in mature brown adipocytes treated with vehicle or MaR1 (0.1, 1 nM) for 24 h (n = 8). (E–F) Palmitic acid (PA) uptake (14C 2-Bromopalmitate incorporation) and Palmitate (PA) oxidation rates (E) and 2-Deoxy-d-glucose (2DG) uptake (F) in MaR1-treated brown adipocytes (n = 6–17). (G) FGF21 secretion levels in cultured media of brown adipocytes treated with vehicle or MaR1 (1 nM, 24 h) (n = 4). (H) Expression of thermogenic genes in differentiated brown adipocytes from wild type (WT) and Fgf21−/− mice treated with vehicle or MaR1 (1 nM, 24 h) (n = 3–4). Data are mean ± SEM (n = 3–17). mRNA expression, PA uptake and oxidation, and 2DG uptake data are expressed as fold change relative to control or WT cells-treated with vehicle and considered as 1. ∗p < 0.05; ∗∗p < 0.01; ∗∗∗p < 0.001 vs. Control or WT (vehicle-treated) adipocytes; #p < 0.05 vs. MaR1-treated brown adipocytes. ap < 0.05 vs. Fgf21−/− (vehicle-treated) brown adipocytes.
Figure 2
Figure 2
MaR1 promotes brown adipose tissue (BAT) activation in DIO mice. Twenty weeks-old DIO mice were daily treated either with MaR1 (50 μg/kg) or vehicle by oral gavage for 10 days. (A) Representative photomicrographs (magnification 100×) of iBAT sections stained with H&E dye (left panel) and lipid droplet size quantification (right panel) (n = 3). (B) Representative blot and densitometry analysis of iBAT UCP1 (band densities were normalized to β-Actin (n = 3–6). (C–E) mRNA expression levels of master mitochondrial biogenesis and function regulators and iBAT activator genes (C), and of genes involved in iBAT lipid metabolism and glucose uptake (D) as well as in inflammation and macrophage type markers (E) (n = 5–8). Data (mean ± SEM) are expressed as fold change relative to control (vehicle-treated) mice and considered as 1. (F) Representative images of IHF labelling of CD206 in iBAT (left), and quantification of immunoreactive signals (right panel) (n = 2). (G–H) Body weight changes and rectal temperature changes after acute (1 h) cold exposure (4 °C) in DIO mice treated with MaR1 (n = 5). (I) 18F-FDG uptake using microPET 1 h after 18F-FDG injection in mice pre-exposed for 1 h at 4 °C. Left panel: coronal sections of mice. White arrow: iBAT pads. Right panel: maximum standardized uptake value (SUVmax) (n = 3–5). Data (mean ± SEM). ∗p < 0.05; ∗∗p < 0.01; ∗∗∗p < 0.001 vs. Control (vehicle-treated) mice; #p < 0.05; ##p < 0.01; ###p < 0.001 vs. DIO (vehicle-treated) mice.
Figure 3
Figure 3
MaR1 induces beige adipocyte markers in iWAT of DIO mice and in human mesenchymal stem cells (hMSC)-derived adipocytes. (A–D) UCP1 protein (A), and mRNA expression levels of key regulators of mitochondrial biogenesis and fatty acid oxidation genes (B), and of beige/browning characteristic genes (C) as well as of genes related with inflammation and macrophage polarization (D) in iWAT from 20 weeks-old DIO mice treated with MaR1 (50 μg/kg) or vehicle by oral gavage for 10 days. Data (mean ± SEM) are expressed as fold change relative to DIO mice-treated with vehicle and considered as 1. (n = 5–8). #p < 0.05,##p < 0.01, ###p < 0.001 vs. DIO mice. (E) Representative images of IHF labelling of CD206, and quantification of immunoreactive signals in iWAT of 20 weeks-old DIO mice treated with MaR1 (50 μg/kg) or vehicle by oral gavage for 10 days. (n = 2–3). #p < 0.05 vs. DIO mice. (F) mRNA expression levels of genes characteristics of the beiging process in hMSC treated along the differentiation process with MaR1 (1–100 nM). Determinations were carried out in fully differentiated hMSC-derived adipocytes. Data (mean ± SEM) are expressed as fold change relative to control cells, treated with vehicle and considered as 1. (n = 2–5). ∗p < 0.05; ∗∗p < 0.01 vs. vehicle-treated adipocytes.
Figure 4
Figure 4
IL-6 is required for the stimulatory effect of MaR1 on BAT and WAT browning. (A) Acute MaR1 treatment (24 h, 50 μg/kg; i. p.) upregulates Il6 mRNA levels in iBAT of cold-exposed (4 °C, 24 h) lean WT mice. Data are expressed as mean ± SEM (n = 7). ∗∗∗p < 0.001 vs. WT (vehicle-treated) mice. (B) MaR1 (1 nM) stimulates thermogenic genes/proteins in ex vivo iBAT explants of lean WT, but not in Il6−/− mice. (n = 4–7). Data are expressed as fold change relative to WT mice-treated with vehicle and considered as 1. ∗p < 0.05; ∗∗p < 0.01; ∗∗∗p < 0.001 vs. WT (vehicle-treated) mice; ##p < 0.01 vs. Il6−/− (vehicle-treated) mice. (C) BAT activity assessed by 18F-FDG microPET in lean WT or Il6−/− mice treated with MaR1 (50 μg/kg; i. p.) or vehicle, and then exposed for 1 h at 4 °C, prior injection of 18F-FDG. Left panel: coronal sections of mice. White arrow: iBAT pads. Right panel: maximum standardized uptake value (SUVmax). (n = 3–5). ∗p < 0.05 vs. WT (vehicle-treated) mice. (D) Temperature of the skin BAT area measured by infrared thermal images after 1 h cold exposure with or without MaR1 (50 μg/kg, i. p.) in lean WT or Il6−/− mice. (n = 4–9). ∗p < 0.05 vs. WT (vehicle-treated) mice. (E) Changes in rectal temperature in lean WT or Il6−/− mice treated (i.p.) with MaR1 (50 μg/kg) or vehicle and exposed for 24 h at 4 °C. (n = 6–7). ∗p < 0.05 vs. WT (vehicle-treated) mice. (F–G) Expression of thermogenic genes/proteins in iBAT (F) and iWAT (G) of lean WT or Il6−/− mice treated with MaR1 (50 μg/kg; i. p.) or vehicle and exposed for 24 h at 4 °C. (n = 3–7). ∗p < 0.05; ∗∗p < 0.01; ∗∗∗p < 0.001 vs. WT (vehicle-treated) mice; #p < 0.05; ##p < 0.01; ###p < 0.001 vs. Il6−/− (vehicle-treated) mice. (H–I) Administration of recombinant IL-6 (rIL-6) (3.2 ng/kg, twice, every 12 h, i. p.) restores the stimulatory effect of MaR1 on thermogenic genes in iBAT (H) and iWAT (I) of lean Il6−/− mice exposed for 24 h at 4 °C. Data are expressed as fold change relative to Il6−/− mice treated with vehicle and rIL-6 and considered as 1. (n = 5). ∗p < 0.05, ∗∗p < 0.01 vs.Il6−/− (vehicle + rIL-6-treated) mice.
Figure 5
Figure 5
MaR1 promotes upregulation of thermogenic genes via LGR6 in fully differentiated murine brown adipocytes. (A–B) Expression of Lgr6 in (A) iBAT and iWAT from 20 weeks-old DIO mice daily treated with MaR1 (50 μg/kg) or vehicle by oral gavage for 10 days (n = 5) and (B) mature brown adipocytes treated with vehicle or MaR1 (0.1, 1 nM) for 24 h (n = 4). ###p < 0.001 vs. DIO mice; ∗∗p < 0.01 vs. control (vehicle-treated) brown adipocytes. (C) Reduced Lgr6 mRNA levels in Lgr6 siRNA-transfected brown adipocytes (n = 6). (D–E) Ucp1 (D) and Pgc1a (E) mRNA levels in Lgr6-silenced brown adipocytes treated with vehicle or MaR1 (0.1, 1 nM) for 24 h (n = 5). Data are mean ± SEM. ∗p < 0.05; ∗∗p < 0.01; ∗∗∗p < 0.001 vs. negative control siRNA brown adipocytes. #p < 0.01; ###p < 0.001 vs. Lgr6 siRNA brown adipocytes.
Figure 6
Figure 6
Cold exposure increases MaR1 and Lgr6 levels in iBAT of lean mice. (A–B) Levels of MaR1 and 14-HDHA (A) and of Lgr6 mRNA (B) in iBAT of sixteen-week-old male mice housed at room temperature or cold (4 °C) for 24 h. Data are mean ± SEM. (n = 3–6). ∗p < 0.05; ∗∗∗p < 0.001 vs. room temperature.

References

    1. Yoneshiro T., Aita S., Matsushita M., Kayahara T., Kameya T., Kawai Y., et al. Recruited brown adipose tissue as an antiobesity agent in humans. J Clin Invest. 2013;123:3404–3408. doi: 10.1172/JCI67803. - DOI - PMC - PubMed
    1. Bartelt A., Bruns O.T., Reimer R., Hohenberg H., Ittrich H., Peldschus K., et al. Brown adipose tissue activity controls triglyceride clearance. Nat Med. 2011;17:200–205. doi: 10.1038/nm.2297. - DOI - PubMed
    1. Chondronikola M., Volpi E., Børsheim E., Porter C., Annamalai P., Enerbäck S., et al. Brown adipose tissue improves whole-body glucose homeostasis and insulin sensitivity in humans. Diabetes. 2014;63:4089–4099. doi: 10.2337/db14-0746. - DOI - PMC - PubMed
    1. Guerra C., Navarro P., Valverde A.M., Arribas M., Brüning J., Kozak L.P., et al. Brown adipose tissue–specific insulin receptor knockout shows diabetic phenotype without insulin resistance. J Clin Invest. 2001;129:437. doi: 10.1172/jci126191. - DOI - PMC - PubMed
    1. Townsend K.L., Tseng Y.H. Brown fat fuel utilization and thermogenesis. Trends Endocrinol Metabol. 2014;25:168–177. doi: 10.1016/j.tem.2013.12.004. - DOI - PMC - PubMed

Publication types

Substances