. 2023 Jun 5;11(1):128.
doi: 10.1186/s40168-023-01544-8.

The composition of environmental microbiota in three tree fruit packing facilities changed over seasons and contained taxa indicative of L. monocytogenes contamination

Affiliations

The composition of environmental microbiota in three tree fruit packing facilities changed over seasons and contained taxa indicative of L. monocytogenes contamination

M Laura Rolon et al. Microbiome. .

Abstract

Background: Listeria monocytogenes can survive in cold and wet environments, such as tree fruit packing facilities and it has been implicated in outbreaks and recalls of tree fruit products. However, little is known about microbiota that co-occurs with L. monocytogenes and its stability over seasons in tree fruit packing environments. In this 2-year longitudinal study, we aimed to characterize spatial and seasonal changes in microbiota composition and identify taxa indicative of L. monocytogenes contamination in wet processing areas of three tree fruit packing facilities (F1, F2, F3).

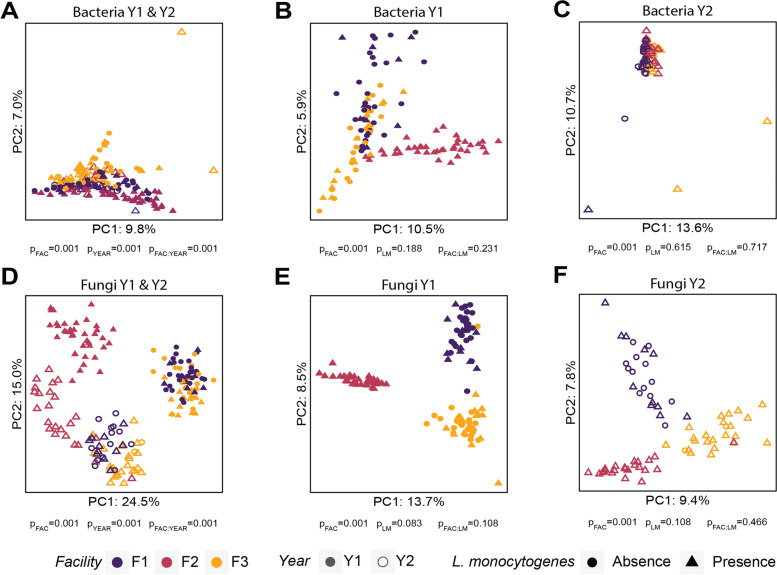
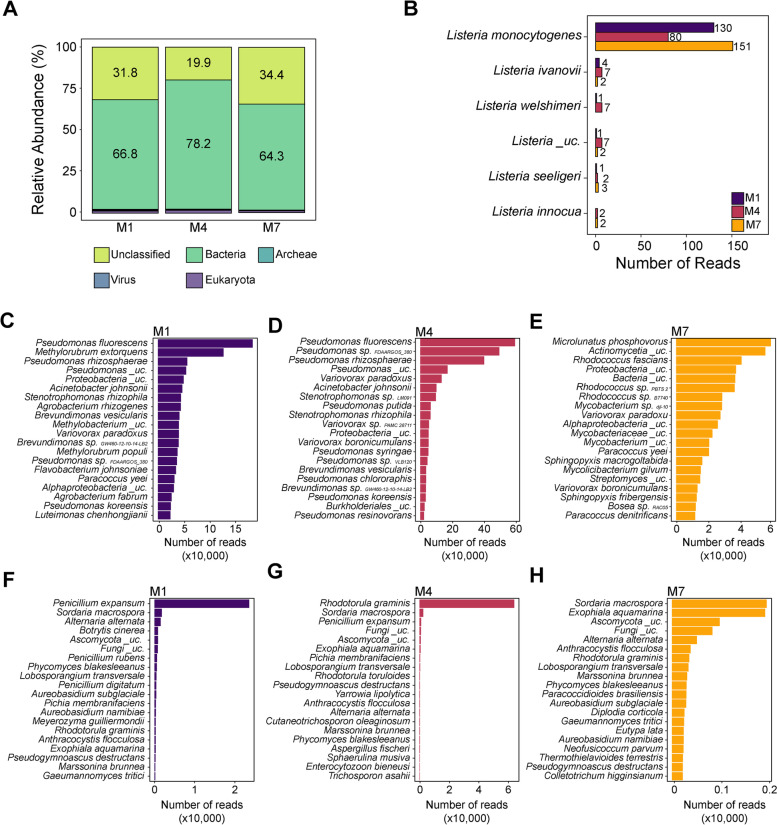
Methods: A total of 189 samples were collected during two apple packing seasons from floors under the washing, drying, and waxing areas. The presence of L. monocytogenes was determined using a standard culturing method, and environmental microbiota was characterized using amplicon sequencing. PERMANOVA was used to compare microbiota composition among facilities over two seasons, and abundance-occupancy analysis was used to identify shared and temporal core microbiota. Differential abundance analysis and random forest were applied to detect taxa indicative of L. monocytogenes contamination. Lastly, three L. monocytogenes-positive samples were sequenced using shotgun metagenomics with Nanopore MinION, as a proof-of-concept for direct detection of L. monocytogenes' DNA in environmental samples.

Results: The occurrence of L. monocytogenes significantly increased from 28% in year 1 to 46% in year 2 in F1, and from 41% in year 1 to 92% in year 2 in F3, while all samples collected from F2 were L. monocytogenes-positive in both years. Samples collected from three facilities had a significantly different microbiota composition in both years, but the composition of each facility changed over years. A subset of bacterial taxa including Pseudomonas, Stenotrophomonas, and Microbacterium, and fungal taxa, including Yarrowia, Kurtzmaniella, Cystobasidium, Paraphoma, and Cutaneotrichosporon, were identified as potential indicators of L. monocytogenes within the monitored environments. Lastly, the DNA of L. monocytogenes was detected through direct Nanopore sequencing of metagenomic DNA extracted from environmental samples.

Conclusions: This study demonstrated that a cross-sectional sampling strategy may not accurately reflect the representative microbiota of food processing facilities. Our findings also suggest that specific microorganisms are indicative of L. monocytogenes, warranting further investigation of their role in the survival and persistence of L. monocytogenes. Video Abstract.

Keywords: Food safety; Listeria monocytogenes; Microbiota; Spatial and temporal variation; Tree fruit packing facilities.


Conflict of interest statement

The authors declare that they have no competing interests.

Figures

Fig. 1
Fig. 1
Prevalence of L. monocytogenes in tree fruit packing facilities throughout two packing seasons. Environmental samples were collected from the floor under the brush conveyor belt where washing, fan-drying, and waxing processes are carried out in three tree fruit packing facilities (F1, F2, F2) (A). The prevalence of L. monocytogenes is shown by facility (B) and by processing section (C) during sampling conducted in two seasons: year 1 (Y1) and year 2 (Y2). A total of 39 and 24 samples were collected per facility in Y1 and Y2, respectively. The presence and absence of viable L. monocytogenes, as determined by an enrichment method, is shown in pink and orange, respectively. The p-values denote significant differences between samples collected in Y1 and Y2 using a two-proportion Z-test to statistically evaluate the differences in the occurrence of L. monocytogenes
Fig. 2
Fig. 2
Seasonal changes in bacterial and fungal microbiota composition. Principal component plots show bacterial microbiota composition for samples collected in both years, (A) Y1 (B) and Y2 (C), and fungal microbiota for samples collected in both years, (D) Y1 (E) and Y2 (F). Each symbol in a plot represents an individual sample and the color of each sample symbol indicates the facility in which a sample was collected. The presence and absence of viable L. monocytogenes, as determined by an enrichment method, is shown in triangles and circles, respectively. Filled symbols denote samples collected in Y1 and unfilled symbols squares denote samples collected in Y2. The p-values in panels A and D were determined using a two-way PERMANOVA model that included the effect of facility (FAC), year (YEAR), and their interaction (FAC:YEAR). The p-values in panels B, C, E, and F from a two-way PERMANOVA model that included the effects of facility (FAC), presence of L. monocytogenes (LM), and their interaction (FAC:LM)
Fig. 3
Fig. 3
Abundance-occupancy distributions, overlapping core taxa, and co-occurrence networks. Abundance-occupancy distributions describing log10 mean relative abundance of individual ASVs and their occupancy for bacteria in F1 (A), F2 (B), and F3 (C), and for fungi in F1 (E), F2 (F), and F3 (G). Temporal core ASVs, defined as those present in all facilities at all sampling times throughout the 2 years of study (i.e., occupancy = 1), are shown in purple for F1, pink for F2, and yellow for F3. Venn diagrams show the number of core bacterial ASVs (D) and core fungal ASVs (H) shared between the three facilities. Networks show bacterial (I) and fungal (J) microbiota with an occupancy above 0.5 in any facility throughout the two seasons. Nodes represent ASVs and are color-coded by network cluster as determined by the fast greedy algorithm. Nodes marked with a black border line are network hubs, determined as those with the highest betweenness centrality. Edges in the network are color-coded to denote positive (green) and negative (red) associations. A higher transparency in the edge color indicates lower association value
Fig. 4
Fig. 4
Differentially abundant bacterial and fungal ASVs between seasons. Bacterial ASVs identified as differentially abundant between season 1 (Y1) and 2 season (Y2) in facilities F2 (A), and fungal ASVs identified as differentially abundant between Y1 and Y2 in facilities F1 (B), F2 (C), and F3 (D). No differentially abundant bacterial ASV between seasons was found in F1 or F3. The ASVs shown in darker color were detected in significantly higher relative abundance in Y1, while ASVs shown in lighter color were detected as differentially abundant in Y2. Differences in relative abundance between seasons are shown as the logarithmic fold change of the mean relative abundance in Y1 to that of Y2. Negative values on the x-axis indicate that the relative abundance was higher in Y2
Fig. 5
Fig. 5
Differences in bacterial microbiota between L. monocytogenes-positive and -negative samples. A heatmap shows the difference in mean relative abundance of bacterial ASVs in L. monocytogenes-positive and -negative samples (A) for all ASVs that had a relative abundance above 1% in at least one sample across the two seasons. Significantly differentially abundant bacterial ASVs identified in samples in year 1 (B). In year 2, there were no significant differentially abundant ASVs identified between L. monocytogenes-positive and -negative samples. Differences in the relative abundance between L. monocytogenes-positive and -negative samples are shown as the log fold change of the mean relative abundance in L. monocytogenes-negative samples to that in L. monocytogenes-positive samples. ASVs shown in orange were detected in a significantly higher relative abundance in L. monocytogenes-negative samples and ASVs shown in pink were detected in a significantly higher relative abundance in L. monocytogenes-positive samples. The top 30 bacterial ASVs identified by a random forest model as most informative for classification of samples into L. monocytogenes-positive and L. monocytogenes-negative categories are shown in the panel (C). These ASVs had the highest mean decrease in the model accuracy (mtry = 153, ntree = 1500, accuracy = 65.1%). The inserted plot shows the area under the curve (AUC) and kappa values for the random forest model. “Uc” indicates ASVs that were not classified at the genus level
Fig. 6
Fig. 6
Differences in fungal microbiota between L. monocytogenes-positive and -negative samples. A heatmap shows the difference in mean relative abundance of fungal ASVs in L. monocytogenes-positive and -negative samples for all ASVs that had a relative abundance above 10% in at least one sample across the two seasons (A). Significantly differentially abundant fungal ASVs identified in samples in in year 1 and in year 2 are shown in panels B and C, respectively. Differences in the relative abundance between L. monocytogenes-positive and -negative samples are shown as the log fold change of the mean relative abundance in L. monocytogenes-negative samples to that in L. monocytogenes-positive samples. ASVs shown in orange were detected in significantly higher relative abundance in L. monocytogenes-negative samples and ASVs shown in pink were detected in a significantly higher relative abundance in L. monocytogenes-positive samples. The top 30 fungal ASVs identified by a random forest model as most informative for classification of samples into L. monocytogenes-positive and L. monocytogenes-negative categories are shown in the panel D. These identified ASVs had the highest mean decrease in model accuracy (mtry = 26, ntree = 1000, accuracy = 74.9%). The inserted plot shows the area under the curve (AUC) and kappa values for the random forest model. “Uc” indicates ASVs that were not classified at the genus level
Fig. 7
Fig. 7
Comparison of the taxonomic composition of three samples determined by Illumina amplicon sequencing and Nanopore shotgun sequencing. The kingdom level classification of Nanopore reads for three environmental samples (M1, M4, and M7) collected from three tree fruit packing houses is shown in the panel (A). Listeria spp. diversity as identified by Nanopore sequencing is shown in the panel (B). The top 20 most abundant bacterial species present in M1 (C), M4 (D), and M7 (E), and the top 20 most abundant fungal species present in M1 (F), M4 (G), and M7 (H), as determined by shotgun metagenomic sequencing using Nanopore long-read technology are also shown. “Uc” stands for “unclassified”

References

    1. Colagiorgi A, Bruini I, di Ciccio PA, Zanardi E, Ghidini S, Ianieri A. Listeria monocytogenes Biofilms in the Wonderland of Food Industry. Pathogens. 2017;6:41. doi: 10.3390/pathogens6030041. - DOI - PMC - PubMed
    1. Scallan E, Hoekstra RM, Angulo FJ, Tauxe RV, Widdowson M-A, Roy SL, et al. Foodborne illness acquired in the United States - major pathogens. Emerg Infect Dis. 2011;17:1338–1340. - PMC - PubMed
    1. Angelo KM, Conrad AR, Saupe A, Dragoo H, West N, Sorenson A, et al. Multistate outbreak of Listeria monocytogenes infections linked to whole apples used in commercially produced, prepackaged caramel apples: United States, 2014–2015. Epidemiol Infect. 2017;145:848–856. doi: 10.1017/S0950268816003083. - DOI - PMC - PubMed
    1. Glass KA, Golden MC, Wanless BJ, Bedale W, Czuprynski C. Growth of Listeria monocytogenes within a caramel-coated apple. mBio. 2015;6:2–6. doi: 10.1128/mBio.01232-15. - DOI - PMC - PubMed
    1. Gustafson RE, Ryser ET. Thermal inactivation and growth of Listeria monocytogenes during production and storage of caramel apples. Food Control. 2017;79:234–238. doi: 10.1016/j.foodcont.2017.03.043. - DOI

Publication types

LinkOut - more resources