. 2023 Jun 5;24(1):65.
doi: 10.1186/s10194-023-01600-6.

SS-31 alleviated nociceptive responses and restored mitochondrial function in a headache mouse model via Sirt3/Pgc-1α positive feedback loop

Affiliations

SS-31 alleviated nociceptive responses and restored mitochondrial function in a headache mouse model via Sirt3/Pgc-1α positive feedback loop

Zhengming Shan et al. J Headache Pain. .

Abstract

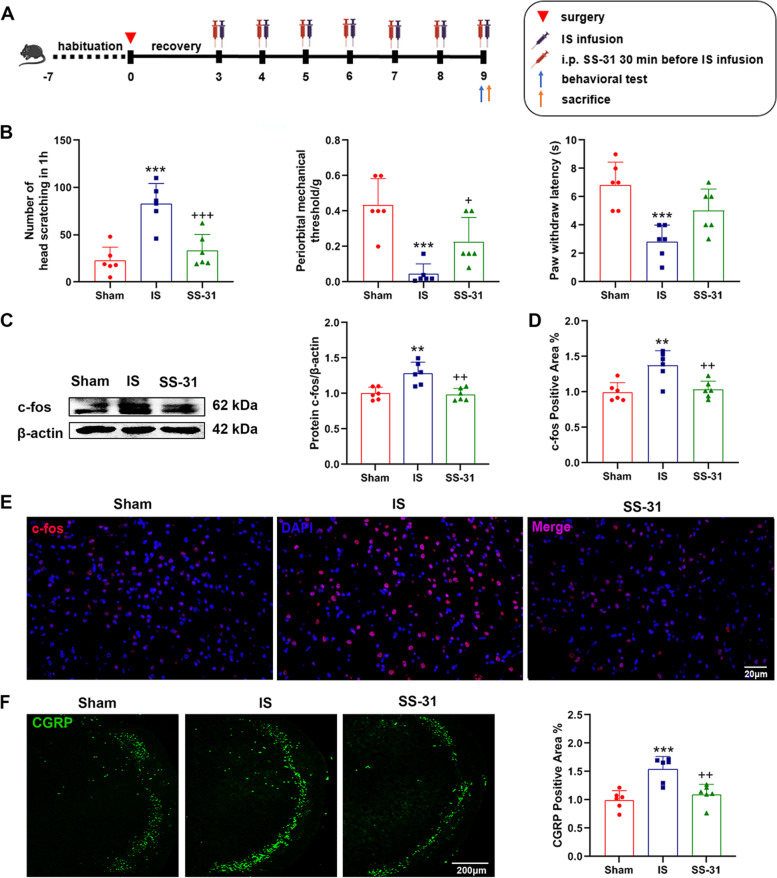
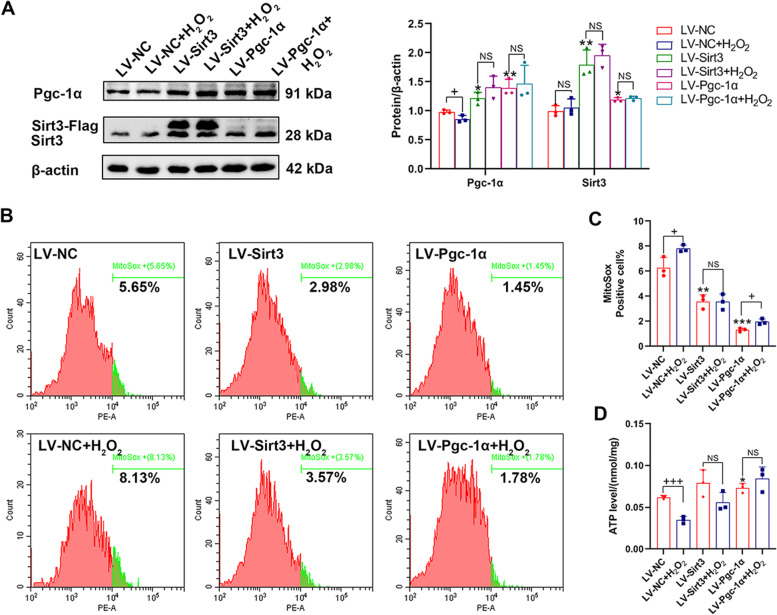
Migraine is the second highest cause of disability worldwide, bringing a huge socioeconomic burden. Improving mitochondrial function has promise as an effective treatment strategy for migraine. Szeto-Schiller peptide (SS-31) is a new mitochondria-targeted tetrapeptide molecule that has been shown to suppress the progression of diseases by restoring mitochondrial function, including renal disease, cardiac disease, and neurodegenerative disease. However, whether SS-31 has a therapeutic effect on migraine remains unclear. The aim of this study is to clarify the treatment of SS-31 for headache and its potential mechanisms. Here we used a mouse model induced by repeated dural infusion of inflammatory soup (IS), and examined roles of Sirt3/Pgc-1α positive feedback loop in headache pathogenesis and mitochondrial function. Our results showed that repeated IS infusion impaired mitochondrial function, mitochondrial ultrastructure and mitochondrial homeostasis in the trigeminal nucleus caudalis (TNC). These IS-induced damages in TNC were reversed by SS-31. In addition, IS-induced nociceptive responses were simultaneously alleviated. The effects of SS-31 on mitochondrial function and mitochondrial homeostasis (mainly mitochondrial biogenesis) were attenuated partially by the inhibitor of Sirt3/Pgc-1α. Overexpression of Sirt3/Pgc-1α increased the protein level of each other. These results indicated that SS-31 alleviated nociceptive responses and restored mitochondrial function in an IS-induced headache mouse model via Sirt3/Pgc-1α positive feedback loop. SS-31 has the potential to be an effective drug candidate for headache treatment.

Keywords: Migraine; Mitochondrial dysfunction; Mitochondrial homeostasis; Pgc-1α; SS-31; Sirt3.


Conflict of interest statement

The authors declare no competing interests.

Figures

Fig. 1
Fig. 1
Mitochondria were injured and mitochondrial homeostasis was altered after repeated IS infusion in a headache male mouse model. Male C57BL/6 mice were sham treated or dural-infused of inflammatory soup (IS) for 7 consecutive days, and then sacrificed for mitochondrial assessment. A-C Representative immunoblots and quantification of the protein levels of Pgc-1α (****p < 0.0001), Tfam (***p = 0.0009), Drp1 (**p = 0.0050), Mfn2, Fis1 (*p = 0.0108), Beclin1, P62 (**p = 0.0021), Pink1 (****p < 0.0001), and Parkin in the TNC. n = 6 per group; Student’s t-test. D The levels of ATP (**p = 0.0022), MMP (**p = 0.0043), ROS (***p = 0.0002) and MDA (*p = 0.0136) were detected and normalized by total protein concentrations in the TNC. n = 6 per group; Student’s t-test. E Mitochondrial ultrastructure in the TNC by TEM analysis. The abnormal mitochondria count percent (***p = 0.0002) and area percent (****p < 0.0001) were calculated. Red arrowhead, damaged mitochondria (swollen mitochondria and reduction of mitochondrial cristae). Black arrowhead, normal mitochondria. Scale bar, 1 μm. n = 4 per group; Student’s t-test. F Immunofluorescence staining of VDAC1 and nucleus (DAPI) in the TNC. The mean mitochondria length (***p = 0.0006) and area (*p = 0.0285) were calculated. Scale bar, 5 μm. n = 6 per group; Student’s t-test. Data are represented as Mean ± SD; *p < 0.05, **p < 0.01, ***p < 0.001 and ****p < 0.0001 as compared to sham group
Fig. 2
Fig. 2
SS-31 attenuated IS-induced nociception responses. A Schematic diagram of the experiment. C57BL/6 mice received sham, IS or SS-31 treatment for 7 consecutive days, followed by behavioral tests and sacrifice to evaluate the effects of SS-31 on nociceptive responses. B The number of head scratching in 1 h (F(2, 15) = 19.02, ****p < 0.0001; ***p = 0.001, +++p = 0.007), periorbital mechanical threshold (F(2, 15) = 15.14, ***p = 0.0003; ***p = 0.0002, +p = 0.0267) and paw withdrawal latency (F(2, 15) = 11.39, ***p = 0.0010; ***p = 0.0007) in different groups were recorded. n = 6 per group; One-way ANOVA. C Western blot analysis of c-fos. Protein level of c-fos was quantified normalized to β-actin in TNC. n = 6 per group; One-way ANOVA. F(2, 15) = 12.94, ***p = 0.0005; **p = 0.0018, ++p = 0.0011. D-E Immunofluorescence staining was used to examine the levels of c-fos in TNC of different groups. Scale bar, 20 μm. n = 6 per group; One-way ANOVA. F(2, 15) = 10.41, **p = 0.0015; **p = 0.0025, ++p = 0.0050. F Immunofluorescence staining was used to examine the levels of CGRP in TNC of different groups. Scale bar, 200 μm. n = 6 per group; One-way ANOVA. F(2, 15) = 13.96, ***p = 0.0004; ***p = 0.0005, ++p = 0.0027. Data are represented as Mean ± SD; *p < 0.05, **p < 0.01 and ***p < 0.001 as compared to the Sham group. +p < 0.05, ++p < 0.01 and +++p < 0.001 as compared to IS group
Fig. 3
Fig. 3
SS-31 restored mitochondrial function and mitochondrial homeostasis in an IS-induced headache mouse model. C57BL/6 mice received sham, IS or SS-31 treatment for 7 consecutive days, and were sacrificed to evaluate the effects of SS-31 on mitochondrial function and mitochondrial homeostasis in TNC. A-C Western blot analysis was used to asses expression levels of Pgc-1α (F(2, 15) = 5.434, *p = 0.0168; *p = 0.0384, +p = 0.0249), Tfam (F(2, 15) = 6.457, **p = 0.0095; *p = 0.0443, ++p = 0.0100), Mfn2, Drp1, Fis1 (F(2, 15) = 15.74, ***p = 0.0002; **p = 0.0015, +++p = 0.0003), P62 and Pink1 (F(2, 15) = 5.143, *p = 0.0199; *p = 0.0153) in different groups. n = 6 per group; One-way ANOVA. D Western blot analysis and quantification of Sirt3 (F(2, 15) = 10.66, **p = 0.0013; **p = 0.0011, +p = 0.0208) protein level normalized to β-actin. n = 6 per group; One-way ANOVA. E The levels of ROS (F(2, 15) = 25.33, ****p < 0.0001; ****p < 0.0001, +++p = 0.0003), ATP (F(2, 15) = 7.704, **p = 0.0050; *p = 0.0413, ++p = 0.0045), MMP (F(2, 15) = 25.89, ****p < 0.0001; ****p < 0.0001, +++p = 0.0009) and MDA (F(2, 15) = 3.854, *p = 0.0446; +p = 0.0362) were detected and normalized by total protein concentrations in different groups. n = 6 per group; One-way ANOVA. (F) Mitochondrial ultrastructure in TNC by TEM analysis. The abnormal mitochondria count percent (F(2, 15) = 14.39, ***p = 0.0003; ***p = 0.0004, ++p = 0.0034) and area percent (F(2, 15) = 13.70, ***p = 0.0004; ***p = 0.0003, +p = 0.0120) were calculated. Red arrowhead, damaged mitochondria (swollen mitochondria and reduction of mitochondrial cristae). Black arrowhead, normal mitochondria. Scale bar, 500 nm. n = 6 per group; One-way ANOVA. Data are represented as Mean ± SD; *p < 0.05, **p < 0.01, ***p < 0.001 and ****p < 0.0001 as compared to sham group. +p < 0.05, ++p < 0.01 and +++p < 0.001 as compared to IS group
Fig. 4
Fig. 4
SS-31 restored mitochondrial function and mitochondrial homeostasis in H2O2-induced PC12 cells. A PC12 cells were treated with SS-31 (100 nM) for 2 h, followed by additional H2O2 (300 nM) for 12 h. B Western blot analysis of Sirt3 and Pgc-1α (F(2, 6) = 7.438, *p = 0.0237; *p = 0.0452, +p = 0.0292). Protein levels of Sirt3 and Pgc-1α were quantified normalized to β-actin. n = 3 per group; One-way ANOVA. (C) Western blot analysis of Tfam (F(2, 6) = 6.981, *p = 0.0272; +p = 0.0254), Drp1, Fis1 (F(2, 6) = 8.292, *p = 0.0188; *p(H2O2) = 0.0200, *p(SS-31+H2O2) = 0.0485) and Pink1 (F(2, 6) = 20.93, **p = 0.0020; **p(H2O2) = 0.0037, **p(SS-31+H2O2) = 0.0030). Protein levels were quantified normalized to β-actin. n = 3 per group; One-way ANOVA. D and E Flow cytometric analysis was used to examine MMP (F(2, 6) = 16.90, **p = 0.0034; ++p = 0.0045) and ROS (F(2, 6) = 7.564, *p = 0.0229; *p(H2O2) = 0.0314, *p(SS-31+H2O2) = 0.0388) levels in different groups. n = 3 per group; One-way ANOVA. Data are represented as Mean ± SD; *p < 0.05 and **p < 0.01 as compared to con group. +p < 0.05 and ++p < 0.01 as compared to H2O2 group
Fig. 5
Fig. 5
Inhibition of Sirt3/Pgc-1α partially blocked the effect of SS-31 on headache treatment. A Schematic diagram of the experiment. C57BL/6 mice received PBS + sham + DMSO, PBS + IS + DMSO, SS-31 + IS + DMSO, SS-31 + IS + 3-TYP or SS-31 + IS + SR-18292 treatment for 7 consecutive days, followed by behavioral tests and sacrifice to evaluate nociceptive responses. B-D The number of head scratching in 1 h (F(4, 40) = 9.107, ****p < 0.0001; ****p(PBS+IS+DMSO) < 0.0001, +++p(SS-31+IS+DMSO) = 0.0001, +p(SS-31+IS+3-TYP) = 0.015, +p(SS-31+IS+SR-18292) = 0.0475, periorbital mechanical threshold (F(4, 40) = 9.986, ****p < 0.0001; ***p(PBS+IS+DMSO) = 0.0001, ***p(SS-31+IS+3-TYP) < 0.0004, *p(SS-31+IS+SR-18292) = 0.0260, ++p(SS-31+IS+DMSO) = 0.0011, ##p(SS-31+IS+3-TYP) = 0.0031) and paw withdrawal latency (F(4, 40) = 8.679, ****p < 0.0001; ***p(PBS+IS+DMSO) = 0.0003, **p(SS-31+IS+3-TYP) = 0.0027, **p(SS-31+IS+SR-18292) = 0.0015, ++p(SS-31+IS+DMSO) = 0.0080, #p(SS-31+IS+3-TYP) = 0.0464, #p(SS-31+IS+SR-18292) = 0.0288) were recorded in different groups. n = 9 per group; One-way ANOVA. EG Western blot analysis (n = 9 per group; F(4, 40) = 6.389, ***p = 0.0004; **p(PBS+IS+DMSO) = 0.0058, *p(SS-31+IS+SR-18292) = 0.0451, ++p(SS-31+IS+DMSO) = 0.0022, #p(SS-31+IS+SR-18292) = 0.0195) and immunofluorescence staining (n = 6 per group; F(4, 25) = 10.36, ****p < 0.0001; ***p(PBS+IS+DMSO) = 0.0005, **p(SS-31+IS+3-TYP) = 0.0017, *p(SS-31+IS+SR-18292) = 0.0286, +++p(SS-31+IS+DMSO) = 0.0009, ##p(SS-31+IS+3-TYP) = 0.0029, #p(SS-31+IS+SR-18292) = 0.0446) illustrated that expression levels of c-fos in TNC of different groups. Scale bar, 50 μm. One-way ANOVA. H Immunofluorescence staining (F(4, 25) = 14.31, ****p < 0.0001; ****p(PBS+IS+DMSO) < 0.0001, ***p(SS-31+IS+3-TYP) = 0.0003, ****p(SS-31+IS+SR-18292) = 0.0004, +++p(SS-31+IS+DMSO) = 0.0009, #p(SS-31+IS+SR-18292) = 0.0425) was used to examine the levels of CGRP in TNC of different groups. Scale bar, 200 μm. n = 6 per group; One-way ANOVA. Data are represented as Mean ± SD; *p < 0.05, **p < 0.01 and ***p < 0.001 as compared to PBS + Sham + DMSO group. +p < 0.05, ++p < 0.01 and +++p < 0.001 as compared to PBS + IS + DMSO group. #p < 0.05 as compared to SS-31 + IS + DMSO group
Fig. 6
Fig. 6
The effects of SS-31 on mitochondrial function and homeostasis were partially counteracted by inhibiting Sirt3/Pgc-1α. C57BL/6 mice received PBS + sham + DMSO, PBS + IS + DMSO, SS-31 + IS + DMSO, SS-31 + IS + 3-TYP or SS-31 + IS + SR-18292 treatment for 7 consecutive days, followed by sacrifice to evaluate mitochondrial function and mitochondrial homeostasis in TNC. A ROS levels were examined in different groups and normalized by total protein concentrations. n = 6 per group; One-way ANOVA. F(4, 25) = 7.078, ***p = 0.0006; *p(PBS+IS+DMSO) = 0.0222, **p(SS-31+IS+SR-18292) = 0.0029, +p(SS-31+IS+DMSO) = 0.0259, ##p(SS-31+IS+SR-18292) = 0.0034. B ATP levels were examined in different groups and normalized by total protein concentrations. n = 9 per group; One-way ANOVA. F(4, 40) = 4.753, **p = 0.0031; **p(PBS+IS+DMSO) = 0.0096, *p(SS-31+IS+3-TYP) = 0.0301, +p(SS-31+IS+DMSO) = 0.0393. C Western blot analysis showed that expression of Sirt3 (F(4, 40) = 13.71, ****p < 0.0001; ****p(PBS+IS+DMSO) < 0.0001, ****p(SS-31+IS+3-TYP) < 0.0001, ****p(SS-31+IS+SR-18292) < 0.0001, +p(SS-31+IS+DMSO) = 0.0153, ##p(SS-31+IS+3-TYP) = 0.0487, ##p(SS-31+IS+SR-18292) = 0.0216) and Pgc-1α (F(4, 40) = 15.15, ****p < 0.0001; ***p(PBS+IS+DMSO) = 0.0002, ****p(SS-31+IS+3-TYP) < 0.0001, ****p(SS-31+IS+SR-18292) < 0.0001, ##p(SS-31+IS+3-TYP) = 0.0044, ##p(SS-31+IS+SR-18292) = 0.0039) in different groups. n = 9 per group; One-way ANOVA. (D) Representative immunoblots and quantification illustrated the levels of Tfam (F(4, 40) = 9.868, ****p < 0.0001; ***p(PBS+IS+DMSO) = 0.0004, ***p(SS-31+IS+3-TYP) = 0.0001, ***p(SS-31+IS+SR-18292) = 0.0003, +p(SS-31+IS+DMSO) = 0.0417, #p(SS-31+IS+3-TYP) = 0.0177, #p(SS-31+IS+SR-18292) = 0.0363), Drp1 (F(4, 40) = 5.655, **p = 0.0011; ***p(PBS+IS+DMSO) = 0.0004, *p(SS-31+IS+SR-18292) = 0.0492, +p(SS-31+IS+DMSO) = 0.0429), Fis1 and Pink1 in different groups. n = 9 per group; One-way ANOVA. E Immunofluorescence staining of VDAC1 and nucleus (DAPI) in TNC. The mean mitochondria length (F(4, 25) = 5.225, **p = 0.0034; *p(PBS+IS+DMSO) = 0.0232, *p(SS-31+IS+3-TYP) = 0.0410, +p(SS-31+IS+DMSO) = 0.0312) and area (F(4, 25) = 6.964, ***p = 0.0007; *p(PBS+IS+DMSO) = 0.0396, ++p(SS-31+IS+DMSO) = 0.0033, #p(SS-31+IS+3-TYP) = 0.0150, ##p(SS-31+IS+SR-18292) = 0.0047) were calculated. Scale bar, 5 μm. n = 6 per group; One-way ANOVA. Data are represented as Mean ± SD; *p < 0.05, **p < 0.01, ***p < 0.001 and ****p < 0.0001 as compared to PBS + Sham + DMSO group. +p < 0.05 and ++p < 0.01 as compared to PBS + IS + DMSO group. #p < 0.05 and ##p < 0.01 as compared to SS-31 + IS + DMSO group
Fig. 7
Fig. 7
Overexpression of Sirt3/Pgc-1α enhanced expression of each other and improved mitochondrial function in PC12 cells. PC12 cells infected by lentivirus (LV) were treated with/without H2O2 (300 nM) for 12 h. A Western blot analysis of Sirt3 (**p(LV-Sirt3) = 0.0066, *p(LV-Pgc1α) = 0.0311) and Pgc-1α (+p = 0.05; *p(LV-Sirt3) = 0.0242, **p(LV-Pgc1α) = 0.0096). n = 3 per group; Student’s t-test. B-C Flow cytometric analysis was used to detected the ROS levels in different groups. n = 3 per group; Student’s t-test. +p(LV-NC) = 0.0371, +p(LV-Pgc1α) = 0.0158; **p(LV-Sirt3) = 0.0019, ***p(LV-Pgc1α) = 0.0001. D The ATP levels were examined and normalized by total protein concentrations in different groups. n = 3 per group; Student’s t-test. +++p(LV-NC) = 0.0005; *p(LV-Pgc1α) = 0.0295. Data are represented as Mean ± SD; *p < 0.05, **p < 0.01 and ***p < 0.001 as compared to LV-NC group. +p < 0.05 and +++p < 0.001 as compared to LV- group. NC, negative control. NS, no significance
Fig. 8
Fig. 8
No interaction of Sirt3 and Pgc-1α complexes was detected in PC12 cells. Wild-type PC12 cells were cultured for western blot analysis and immunofluorescence staining, while PC12 cells infected by LV-Sirt3 were cultured for co-IP analysis. A Western blot analysis of Sirt3 and Pgc-1α to evaluate sub-cellular localization. B Co-IP analysis of Sirt3 and Pgc-1α. C Immunofluorescence staining of Sirt3, Pgc-1α and VDAC1. Scale bar, 10 μm. Cyt-: cytoplasm; Mit-: mitochondria

Similar articles

Cited by

References

    1. Ferrari MD, Goadsby PJ, Burstein R, et al (2022) Migraine. Nature reviews Disease primers 8:2 10.1038/s41572-021-00328-4 - PubMed
    1. GBD 2016 Neurology Collaborators (2019) Global, regional, and national burden of neurological disorders, 1990–2016: a systematic analysis for the Global Burden of Disease Study 2016. The Lancet Neurology 18:459–480. 10.1016/s1474-4422(18)30499-x - PMC - PubMed
    1. Gross EC, Lisicki M, Fischer D, Sándor PS, Schoenen J. The metabolic face of migraine - from pathophysiology to treatment. Nat Rev Neurol. 2019;15:627–643. doi: 10.1038/s41582-019-0255-4. - DOI - PubMed
    1. Xie K, Wang Y, Yin L, et al. Hydrogen Gas Alleviates Sepsis-Induced Brain Injury by Improving Mitochondrial Biogenesis Through the Activation of PGC-α in Mice. Shock (Augusta, Ga) 2021;55:100–109. doi: 10.1097/shk.0000000000001594. - DOI - PubMed
    1. Younis S, Hougaard A, Vestergaard MB, Larsson HBW, Ashina M. Migraine and magnetic resonance spectroscopy: a systematic review. Curr Opin Neurol. 2017;30:246–262. doi: 10.1097/wco.0000000000000436. - DOI - PubMed