. 2023 Jun 1;150(11):dev201408.
doi: 10.1242/dev.201408. Epub 2023 Jun 5.

Notch directs telencephalic development and controls neocortical neuron fate determination by regulating microRNA levels

Affiliations

Notch directs telencephalic development and controls neocortical neuron fate determination by regulating microRNA levels

Jisoo S Han et al. Development. .

Abstract

The central nervous system contains a myriad of different cell types produced from multipotent neural progenitors. Neural progenitors acquire distinct cell identities depending on their spatial position, but they are also influenced by temporal cues to give rise to different cell populations over time. For instance, the progenitors of the cerebral neocortex generate different populations of excitatory projection neurons following a well-known sequence. The Notch signaling pathway plays crucial roles during this process, but the molecular mechanisms by which Notch impacts progenitor fate decisions have not been fully resolved. Here, we show that Notch signaling is essential for neocortical and hippocampal morphogenesis, and for the development of the corpus callosum and choroid plexus. Our data also indicate that, in the neocortex, Notch controls projection neuron fate determination through the regulation of two microRNA clusters that include let-7, miR-99a/100 and miR-125b. Our findings collectively suggest that balanced Notch signaling is crucial for telencephalic development and that the interplay between Notch and miRNAs is essential for the control of neocortical progenitor behaviors and neuron cell fate decisions.

Keywords: Cell fate; Cortical development; Mouse; Neurogenesis; Notch; miRNA.


Conflict of interest statement

Competing interests The authors declare no competing or financial interests.

Figures
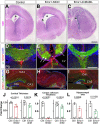
Fig. 1.
Fig. 1.
Morphological defects in Emx1-NICD and Emx1-dnMAML models. (A-C) Hematoxylin and eosin staining (H&E) of control (A), Emx1-NICD (B) and Emx1-dnMAML (C) P0 brains. Lateral ventricles are indicated with an asterisk. Arrow in B indicates axon Probst bundles. (D-F) P0 cortical slices were immunolabeled against GFAP (red) and L1 cell adhesion molecule (green) and counterstained with DAPI (blue). The thickness of the corpus callosum is indicated in D and F with white bars. Arrows in E point at Probst bundles and asterisk indicates lack of corpus callosum. (G-I) P10 slices were immunolabeled against DKK3 (red) and calbindin (CALB; green) and counterstained with DAPI (blue). Note the disorganization of the hippocampus in Emx1-NICD (H). (J-L) Quantifications of cortical thickness (J), corpus callosum thickness (K) and hippocampal area (L). Mean±s.e.m. P-values were obtained using an unpaired, two-tailed Student's t-test. CA1-CA3, cornu ammonis hippocampal regions; Ctrl, control; DG, dentate gyrus; LV, lateral ventricle. Scale bars: 500 µm (A-C,G-I); 250 µm (D-F).
Fig. 2.
Fig. 2.
Midline patterning and production of Cajal–Retzius cells in Emx1-NICD and Emx1-dnMAML telencephalons. (A-C′) E13.5 sections were immunolabeled against MSX1 (red) and FOXG1 (green), and counterstained with DAPI (blue). White bars indicate hippocampal primordia (A-C) and cortical hem (A′-C′) regions. (D-F) E13.5 cortical sections were immunolabeled for reelin (white) to identify Cajal-Retzius cells (yellow arrows). (G-L) Quantifications of hippocampal length (G,H), cortical hem length (I,J) and number of reelin+ cells/area (K,L) shown as fold change compared with each control littermate. Mean±s.e.m. P-values were obtained using an unpaired, two-tailed Student's t-test. (M,N) Emx1-NICD mice show patches of ectopic reelin+ cells at E13.5 (arrows). CH, cortical hem; ChP, choroid plexus; Ctrl, control; hip, hippocampal primordia; LV, lateral ventricle; MZ, marginal zone. Scale bars: 250 µm (A-C); 100 µm (A′-C′,M,N); 20 µm (D-F).
Fig. 3.
Fig. 3.
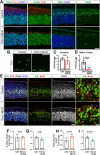
Emx1-NICD neocortices exhibit increased ratios of upper-layer neurons. (A) P0 cortical brain section immunolabeled with CUX1 (red), CTIP2 (green) and TBR1 (green) antibodies, and counterstained with DAPI (blue). (B-D) Quantifications of the number of cells per area are shown as fold change compared with control littermates. (E-E⁗) P0 cortical section labeling of EdU (green), CUX1 (red), CTIP2 (white left, red right), counterstained with DAPI (blue). Arrowheads indicate EdU+/CUX1+ cells (E′,E‴) or EdU+/CTIP2+ cells (E″). Note the absence of EdU+/CTIP2+ cells in E⁗. (F-H) Quantifications of the number of cells per area shown normalized to their corresponding control littermates. Mean±s.e.m (B-D,F-H). P-values were obtained using an unpaired, two-tailed Student's t-test. IZ, intermediate zone; MZ, marginal zone. Scale bars: 50 µm.
Fig. 4.
Fig. 4.
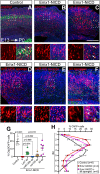
Emx1-dnMAML neocortices exhibit increased numbers of deep-layer neurons and lamination defects. (A-D′) P0 cortical coronal section immunolabeled with CTIP2 (green) and TBR1 (red) (A-A″,C-C″) and P10 coronal section immunolabeled with CUX1 (red) (B,B′,D,D′) antibodies. Tissues were counterstained with DAPI (blue). (E-G) Quantifications of the number of cells per area are shown as fold change compared with control littermates. (H,I) Distribution of CTIP2+ (H) and TBR1+ (I) cells in control (Ctrl) and Emx1-dnMAML (dnM) in P0 cortical brain slices. (J-M′) P0 cortical section labelings of EdU (green), CTIP2 (red) and TBR1 (red), counterstained with DAPI (blue). Arrowheads indicate EdU+/CTIP2+ cells (J′,L′) or EdU+/TBR1+ cells (K′,M′). (N,O) Quantifications of the number of cells per area normalized to their corresponding control littermates. Mean±s.e.m. P-values in E-G,N,O were obtained using an unpaired, two-tailed Student's t-test. For the cell distributions in H,I, multiple unpaired t-tests (one per bin) with Welch correction were performed (*P<0.05; ***P<0.001; adjusted P-values). CP, cortical plate. Scale bars: 50 µm.
Fig. 5.
Fig. 5.
Notch regulates radial glia cell cycle dynamics. (A) Cortical slices from E13.5 control and Emx1-NICD embryos immunostained against PAX6 (green), TUJ1 (red) and TBR2 (green) and counterstained with DAPI (blue). (B) Cortical slices from E13.5 control and Emx1-NICD embryos immunostained against phospho-Histone3 (PH3, green). Arrows indicate PH3+ cells away from the ventricular surface, likely being intermediate progenitors. Dashed line delineates the ventricular surface. (C,D) Quantification of PH3+ cells in the ventricular surface (C) and anywhere else in the cortex area above the ventricular surface (D). (E) E13.5 cortical section labelings of EdU (green), BrdU (red) and PAX6 (white), counterstained with DAPI (blue). White arrows indicate EdU+/BrdU cells; white arrowheads indicate EdU/BrdU+ cells; magenta arrowheads indicate EdU+/BrdU+ cells. Boxed areas are shown at higher magnification in the far-right panels. (F,G) Quantification of S-phase length in Emx1-NICD (F) and Emx1-dnMAML (dnM) (G) mice in comparison with their control littermates. (H,I) Quantification of total cell cycle length in Emx1-NICD (H) and Emx1-dnMAML (dnM) (I) mice in comparison with their control littermates. Mean±s.e.m (C,D,F-I). P-values were obtained using an unpaired, two-tailed Student's t-test. Ctrl, control; n.s., not significant. Scale bars: 50 µm (A,B,E); 20 µm (right-hand panels in E).
Fig. 6.
Fig. 6.
Transcriptional changes in Emx1-NICD radial glia. (A) Top: Experimental design: a CFSE-containing solution (green) was injected into the 3rd ventricle of E13.5 embryonic mice (left). CFSE diffused through the ventricular system (middle), labeling all cells surrounding the ventricles (green line, right). Bottom: PAX6+ RGs (red) closest to the ventricular surface were labeled with FlashTag (green) 1 h post-injection. (B) Heatmaps showing RNAseq analysis of selected Notch signaling-related genes (top), bHLH genes (middle) and cortical markers (bottom). (C,D) Volcano plots representing differential gene (C) and miRNA (D) expression between Emx1-NICD (n=5) and control (n=3) RGs samples. Ratio of counts per million between Emx1-NICD and control per gene or miRNA is plotted. The x-axis represents the logarithmic fold ratio of Emx1-NICD/control per gene and miRNA identified. The y-axis represents the logarithmic adjusted P-value (false discovery rate) calculated by the Benjamini–Hochberg Procedure. Genes with fewer than five counts per million reads in all samples were filtered prior to analysis, leaving 12,556 genes. miRNAs present in fewer than three samples were filtered prior to analysis, leaving 779 miRNAs.
Fig. 7.
Fig. 7.
Inhibition of let-7, miR-125b and miR-100 expression rescues cortical cell fate defects in Emx1-NICD mice. (A-F) Representative images of control (A) and Emx1-NICD (B) mice electroporated with control plasmid (mScarlett, red) and Emx1-NICD mice co-electroporated with mScarlett and miRNA sponges against let-7 (C) miR-125b (D), miR-100 (E), or all three sponges (F). Electroporations were performed on E13.5 embryos and electroporated brains were collected at P0 (E13→P0). DAPI was used as counterstain. Boxed areas are shown at higher magnification below. Arrows indicate mScarlet+/CTIP2+ cells. (G) Quantification of the percentage of CTIP2+/mScarlet+ cells in each condition. Mean±s.e.m. Adjusted P-values were obtained with Kruskal–Wallis test and Dunn's post-hoc test. (H) Distribution of mScarlet+ cells from the electroporations shown in A, B and F. Mean±s.e.m. Adjusted P-values were obtained with Kruskal–Wallis test and Dunn's post-hoc test. Scale bar: 250 µm.

References

    1. Akshoomoff, N., Mattson, S. N. and Grossfeld, P. D. (2015). Evidence for autism spectrum disorder in Jacobsen syndrome: identification of a candidate gene in distal 11q. Genet. Med. 17, 143-148. 10.1038/gim.2014.86 - DOI - PubMed
    1. Alcamo, E. A., Chirivella, L., Dautzenberg, M., Dobreva, G., Farinas, I., Grosschedl, R. and Mcconnell, S. K. (2008). Satb2 regulates callosal projection neuron identity in the developing cerebral cortex. Neuron 57, 364-377. 10.1016/j.neuron.2007.12.012 - DOI - PubMed
    1. Alves-Guerra, M. C., Ronchini, C. and Capobianco, A. J. (2007). Mastermind-like 1 Is a specific coactivator of beta-catenin transcription activation and is essential for colon carcinoma cell survival. Cancer Res. 67, 8690-8698. 10.1158/0008-5472.CAN-07-1720 - DOI - PubMed
    1. Ambros, V. and Horvitz, H. R. (1984). Heterochronic mutants of the nematode Caenorhabditis elegans. Science 226, 409-416. 10.1126/science.6494891 - DOI - PubMed
    1. Artavanis-Tsakonas, S., Rand, M. D. and Lake, R. J. (1999). Notch signaling: cell fate control and signal integration in development. Science 284, 770-776. 10.1126/science.284.5415.770 - DOI - PubMed

Publication types