Dynamic Glycoprotein Hyposialylation Promotes Chemotherapy Evasion and Metastatic Seeding of Quiescent Circulating Tumor Cell Clusters in Breast Cancer
- PMID: 37272843
- PMCID: PMC10481132
- DOI: 10.1158/2159-8290.CD-22-0644
Dynamic Glycoprotein Hyposialylation Promotes Chemotherapy Evasion and Metastatic Seeding of Quiescent Circulating Tumor Cell Clusters in Breast Cancer
Abstract
Most circulating tumor cells (CTC) are detected as single cells, whereas a small proportion of CTCs in multicellular clusters with stemness properties possess 20- to 100-times higher metastatic propensity than the single cells. Here we report that CTC dynamics in both singles and clusters in response to therapies predict overall survival for breast cancer. Chemotherapy-evasive CTC clusters are relatively quiescent with a specific loss of ST6GAL1-catalyzed α2,6-sialylation in glycoproteins. Dynamic hyposialylation in CTCs or deficiency of ST6GAL1 promotes cluster formation for metastatic seeding and enables cellular quiescence to evade paclitaxel treatment in breast cancer. Glycoproteomic analysis reveals newly identified protein substrates of ST6GAL1, such as adhesion or stemness markers PODXL, ICAM1, ECE1, ALCAM1, CD97, and CD44, contributing to CTC clustering (aggregation) and metastatic seeding. As a proof of concept, neutralizing antibodies against one newly identified contributor, PODXL, inhibit CTC cluster formation and lung metastasis associated with paclitaxel treatment for triple-negative breast cancer.
Significance: This study discovers that dynamic loss of terminal sialylation in glycoproteins of CTC clusters contributes to the fate of cellular dormancy, advantageous evasion to chemotherapy, and enhanced metastatic seeding. It identifies PODXL as a glycoprotein substrate of ST6GAL1 and a candidate target to counter chemoevasion-associated metastasis of quiescent tumor cells. This article is featured in Selected Articles from This Issue, p. 1949.
©2023 The Authors; Published by the American Association for Cancer Research.
Figures
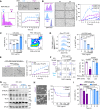
![Figure 1. Chemotherapy correlates with CTC cluster formation and loss of α2,6-SA/ST6GAL1. A, The probability of OS by Kaplan–Meier estimates in the patients with advanced-stage breast cancer, stratified by three alteration patterns of single CTCs (left) or CTC clusters (middle) between baseline (prior to treatment) and the first radiologic evaluation (E1) after 3-month treatment, including (i) decreased CTCs; (ii) stably low or negative CTCs; and (iii) increased or stably high CTCs (singles or clusters). Wilcoxon signed-rank test P < 0.0001. CTCs were detected via CellSearch. Right, representative CellSearch images of a single CTC (CK+DAPI+CD45−) at baseline (top row) and a two-cell CTC cluster at E1 (bottom) from a chemo-treated patient (scale bars = 10 μm). Dec, decreased; Inc, increased; Neg, negative. B, Dynamic counts of CellSearch-detected CTCs (# events), singles and CTC clusters, at baseline and E1 for each breast cancer patient treated with chemotherapy (blue lines) and nonchemotherapy options (purple lines). Wilcoxon signed rank test for CTC cluster alterations P = 0.0158 with chemo (n = 47) and P = 0.6447 without chemo (n = 35); for single CTC alterations P = 0.5461 with chemo and P = 0.5028 without chemo. C, The probability of OS by Kaplan–Meier estimates in patients with advanced-stage breast cancer with or without chemotherapy (chemo ±, left and right), stratified by the CTC alteration patterns of decreased, negative or stable low, and increased CTC cluster events at E1 compared with baseline (log-rank test P = 0.0071 and P < 0.0001). CTCs were measured by CellSearch. D, Representative images (left) and quantification (right) of Sambucus Nigra (SNA)–bound α2,6-SA signals in individual CTCs, both singles (S; n = 120 cells) and from clusters [C; n = 44 tumor cells in the clusters (homotypic and heterotypic clusters of CTCs and CD45+ cells)] of patients with breast cancer (n = 6 patients), analyzed by CellSearch (scale bars = 10 μm). E, The bar graphs of SNA-high populations within singles (S) and clusters (C) in nonchemo-treated patients (left: −Chemo), chemo-treated patients (middle: +Chemo, n = 46, P = 0.002), and paclitaxel-treated patients (right: +PAX, n = 6, P = 0.038). F, Schematic of the PAX treatment for PDX-M1 tumors and subsequent analyses of CTCs and lung metastases (mets). One week after orthotopic implantation of PDX-M1 tumor cells into mouse mammary fat pads, mice were treated with PBS or PAX-NAB (PAX; 13.5 mg/kg) once every 3 days via tail vein 10 times. Three days after the last treatment, mice were sacrificed with collections of blood, breast tumors, and lungs for analyses of CTCs, tumors, and metastasis burdens, respectively. G–N, After PBS/PAX treatments shown in F, representative photos of PDX tumors (G; scale bars = 1 cm) and quantification of the tumor weight (H), bioluminescence images of dissected lungs ex vivo (I) and quantified lung metastases in total flux (J), counts of single CTCs (K) and CTC clusters (L) in PBS- and PAX-treated mice, and the percentage of SNA-high CTCs in singles vs. clusters in mice treated with PBS (M) and PAX (N). CTCs were analyzed via flow cytometry. P values were calculated by GraphPad (Student t test) unless otherwise indicated. Data, mean ± SD.](https://cdn.ncbi.nlm.nih.gov/pmc/blobs/f6ab/10481132/cdec58aa9548/2050fig1.gif)


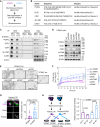
![Figure 6. Targeting PODXL blocks ST6KO- and chemo-associated metastasis. A–C, Bioluminescence images (BLI) and lung metastasis quantifications of mouse imaging (A) and dissected lungs ex vivo (B), and fluorescence images and relative metastatic seeding (disseminated colonies) to the lungs (C) 24 hours after tail-vein injections of ST6WT (in purple) and ST6KO (in blue) cells transfected twice with scrambled control (scr) and siPODXL (siP) for gene knockdown. Scale bars = 100 μm. D–F, Experimental design (D), as well as representative images and quantification of mouse BLI (E) and lung ex vivo BLI (F) to determine the lung metastases (met) after administration of IgG and anti-PODXL (αP) neutralizing antibody to ST6WT MDA-MB-231 cells [6.5 × 10⁴ cells/mice were preincubated with αP antibody (7 μg/mice) or isotope control IgG (7 μg/mice) for 1 hour]. Cells were then injected via the tail vein, and bioluminescence imaging was measured after 24 hours of injection (E). Then mice were sacrificed and ex vivo images of the lungs were measured (F). G, Schematic view of experiment for cotreatment of PAX and αP antibody, PDX-M1 tumor cells were pretreated with PAX-NAB (50 μg/mL) or PBS with αP (20 μg/mL) or IgG control (20 μg/mL) and incubated for 12 hours at 37°C. Meanwhile, mice were treated with the same combination of drugs (PAX-NAB, 27 mg/kg or PBS, αP or IgG control, 30 μg/mouse) via tail vein 3 hours prior to cell inoculation. Twenty hours and 3 weeks (3 w) after i.v. injection of the cells, lungs were dissected for ex vivo bioluminescence imaging (H, left, 20 hours) and disseminated lung metastasis quantified as total flux in H (right, 20 hours) and I (3 w). J–N, Experimental design of cotreatment of mice bearing orthotropic (OI) PDX-M1 tumors. First, ST6KO M1-PDX cells were injected into a mammary fat pad. Mice were cotreated with PAX-NAB (13.5 mg/kg) or PBS and αP or IgG control (20 μg/mouse) once every 3 days. After 11 times treatments, mice were sacrificed for further analysis. Tumor weight (K), representative images of lung bioluminescence imaging (L) with normalized quantification of lung total flux with tumor weight (M), and the count of CTC clusters (N; left) and single CTCs (right) are shown. P values were calculated with the Student t test using GraphPad. Data, mean ± SD of 3–4 biological replicates.](https://cdn.ncbi.nlm.nih.gov/pmc/blobs/f6ab/10481132/895268cc45cd/2050fig6.gif)
Comment in
-
Metastasis Unleashed: Hyposialylation Empowers Chemo-Evasive Circulating Tumor Cell Clusters in Breast Cancer.Cancer Res. 2023 Sep 1;83(17):2811-2812. doi: 10.1158/0008-5472.CAN-23-1978. Cancer Res. 2023. PMID: 37433084
References
-
- Mu Z, Wang C, Ye Z, Austin L, Civan J, Hyslop T, et al. . Prospective assessment of the prognostic value of circulating tumor cells and their clusters in patients with advanced-stage breast cancer. Breast Cancer Res Treat 2015;154:563–71. - PubMed
-
- Zoller M. CD44: can a cancer-initiating cell profit from an abundantly expressed molecule? Nat Rev Cancer 2011;11:254–67. - PubMed
Publication types
MeSH terms
Substances
Grants and funding
LinkOut - more resources
Full Text Sources
Medical
Molecular Biology Databases
Research Materials
Miscellaneous

