. 2023 Jun;12(6):e12331.
doi: 10.1002/jev2.12331.

Extracellular vesicles from human plasma dampen inflammation and promote tissue repair functions in macrophages

Affiliations

Extracellular vesicles from human plasma dampen inflammation and promote tissue repair functions in macrophages

Alan M Adamczyk et al. J Extracell Vesicles. 2023 Jun.

Abstract

Although inflammation is a vital defence response to infection, if left uncontrolled, it can lead to pathology. Macrophages are critical players both in driving the inflammatory response and in the subsequent events required for restoring tissue homeostasis. Extracellular vesicles (EVs) are membrane-enclosed structures released by cells that mediate intercellular communication and are present in all biological fluids, including blood. Herein, we show that extracellular vesicles from plasma (pEVs) play a relevant role in the control of inflammation by counteracting PAMP-induced macrophage activation. Indeed, pEV-treatment of macrophages simultaneously with or prior to PAMP exposure reduced the secretion of pro-inflammatory IL-6 and TNF-α and increased IL-10 response. This anti-inflammatory activity was associated with the promotion of tissue-repair functions in macrophages, characterized by augmented efferocytosis and pro-angiogenic capacity, and increased expression of VEGFa, CD300e, RGS2 and CD93, genes involved in cell growth and tissue remodelling. We also show that simultaneous stimulation of macrophages with a PAMP and pEVs promoted COX2 expression and CREB phosphorylation as well as the accumulation of higher concentrations of PGE2 in cell culture supernatants. Remarkably, the anti-inflammatory activity of pEVs was abolished if cells were treated with a pharmacological inhibitor of COX2, indicating that pEV-mediated induction of COX2 is critical for the pEV-mediated inhibition of inflammation. Finally, we show that pEVs added to monocytes prior to their M-CSF-induced differentiation to macrophages increased efferocytosis and diminished pro-inflammatory cytokine responses to PAMP stimulation. In conclusion, our results suggest that pEVs are endogenous homeostatic modulators of macrophages, activating the PGE2/CREB pathway, decreasing the production of inflammatory cytokines and promoting tissue repair functions.

Keywords: CREB; PGE2; exosomes; extracellular vesicles; human plasma; infection; inflammation; macrophages; resolution; tissue homeostasis; wound-healing.


Conflict of interest statement

The authors report no conflicts of interest.

Figures
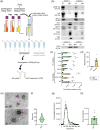
FIGURE 1
FIGURE 1
Obtention and characterization of plasma EVs. (a) Plasma from fasted healthy donors was recovered after sequential centrifugation with addition of 200 nM prostaglandin I2 (PGI2) to inhibit platelet activation. Plasma EVs (pEV) were isolated from 2 mL of plasma by size exclusion chromatography (SEC). pEV‐containing 1‐mL fractions (numbered 4–6) were combined, concentrated by centrifugation at 30,000 × g, and resuspended in PBS for characterization and biological experiments. (b) Immunoblot characterization of pEVs from individual donors with antibodies directed against the EV markers CD63, CD81, CD9, Alix and HSP70 and the non‐EV markers IgG, APOA1 and APOB‐100. Plasma was loaded as a positive control for non‐EV co‐isolates. (c) Pixel density quantifications from immunoblots corresponding to n = 3–9 pEV preparations with antibodies directed against the EV markers CD63, CD81, CD9, Alix and HSP70 and the non‐EV markers IgG, APOA1 and APOB‐100 (mean±SEM) (d) Albumin in pEV preparations from individual donors (n = 6) was quantified by immunoturbidimetry (mean±SEM). (e) TEM visualization of pEVs purified by SEC combined with centrifugation at 30,000 × g, as depicted in (a). Scale bars in nm are shown for both micrographs in the lower left corner. (f) Violin plot showing median pEV diameter measured in TEM micrographs using Image J software, on a total of 137 EV‐compatible structures observed. (g) Size distribution of pEVs from individual donors (n = 9) obtained by NTA, showing mean concentration for each EV size (green circles) and the non‐linear regression fit (line). (h) Concentration of pEVs (mean ± SEM) isolated by SEC followed by centrifugation, determined by NTA (n = 9). (**p < 0. 01; ****p < 0.0001; ns = not significant).
FIGURE 2
FIGURE 2
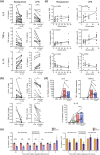
Plasma EVs inhibit macrophage inflammatory response to RSQ and LPS. Isolated pEVs from individual donors were used to treat MDMs differentiated for 7 days with M‐CSF and exposed or not to RSQ (0.5 μg/mL) or LPS (1 ng/mL). Cytokine secretion into cell culture supernatant was measured by ELISA or CBA at 24 h post‐stimulation. Cytokine gene expression was also evaluated by qPCR at 4 h post‐stimulation. (a) Cytokine secretion by MDMs simultaneously stimulated with pEV and RSQ (left column) or pEV and LPS (right column), as compared to PAMP stimulation alone. The number of individual pEV donors analysed is indicated in each graph. The number of independent MDMs stimulated with pEVs and either RSQ or LPS, respectively is: 16 and 5 for IL‐6; 9 and 3 for TNF‐α; 11 and 3 for IL‐10. (b) IL‐6 to IL‐10 and TNF‐α to IL‐10 secretion ratios in RSQ or LPS‐exposed MDMs treated or not with pEVs. The number of individual pEV donors analysed is indicated in each graph. The number of independent MDMs stimulated with pEVs and either RSQ or LPS, respectively is: 11 and 3 for IL‐6/IL‐10 ratio; 6 and 3 for TNF‐α to IL‐10 ratio. (c) Cytokine secretion by MDMs simultaneously stimulated with RSQ or LPS and decreasing doses of pEV from individual donors (n = 10), relative to PAMP stimulation alone (dashed lines); data from two independent experiments and statistical significance for the linear regressions are shown. (d) Relative IL‐6, TNF‐α and IL‐10 gene expression levels in MDMs treated with pEV alone or in combination with RSQ versus unstimulated (NEG) and RSQ only treatment. The number of pEV preparations (obtained from plasma pooled from 3 to 4 donors) analysed is indicated in each graph. The number of independent MDMs stimulated with pEVs is n = 4 for IL‐6; n = 5 for TNF‐α and n = 5 for IL‐10. (e) MDMs were treated with pEV either before (−24 h, −4 h and −1 h), simultaneously (0 h) or after (1 h, 4 h, 6 h) RSQ (left panel) or LPS (right panel) stimulation. The concentration of IL‐6 secreted into cell culture supernatant by cells stimulated with PAMP only or PAMP + pEV was determined at 24 h after PAMP stimulation. Graphs show the combination of two independent MDM donors including n = 9 pEV donors for RSQ and n = 4 pEV donors for LPS, expressing IL‐6 concentration in the PAMP + pEV condition relative to PAMP treatment alone. (*p < 0.05; **p < 0.01; ***p < 0.001; ****p < 0.0001).
FIGURE 3
FIGURE 3
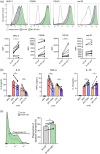
Plasma EVs promote tissue‐repair functions in macrophages exposed to RSQ. (a) Quantitative RT‐PCR of genes involved in tissue repair and angiogenesis (VEGFa, CD300e, CD93 and RSG2) evaluated at 4 h in RNA of MDMs exposed to the different experimental conditions. Relative expression levels were normalized to housekeeping gene GAPDH and to unstimulated condition (NEG). The number of pEV preparations (obtained from plasma pooled from 3 to 4 donors) analysed is indicated in each graph. The number of independent MDMs stimulated with pEVs is n = 9 for VEGFa, 5 for CD300e, 7 for CD93 and 8 for RSG2. Statistical comparison between RSQ versus RSQ + pEV conditions was performed by ratio paired t test. (b) Phagocytosis of apoptotic cells. MDMs untreated (NEG) or treated with RSQ or RSQ + pEV for 24 h were trypsinised and mixed with CFSE‐labelled apoptotic Jurkat cells (1:2) in 1% FBS‐RPMI. After 1 h incubation at 37°C, phagocytosis was stopped by washing with cold PBS. Cells were maintained in ice until cytometric acquisition. Left: a representative histogram showing the phagocytosis positive population. Right: Quantification of phagocytosis percentages in two independent MDM cultures stimulated with pEVs from six individual donors. (c) VEGF secretion by MDMs treated with pEVs alone or in combination with RSQ versus unstimulated (NEG) and RSQ only treatment, measured by ELISA 24‐h post‐stimulation. Eight independent MDM cultures each treated with a single pEV donor are shown. (d) Tube formation assay. Starved HUVEC (n = 2) were stimulated with conditioned media from MDMs treated with the experimental conditions (corresponding to 4 independent MDM cultures each with a single pEV donor) in a 1:2 dilution and incubated at 37°C for 6 h. Representative photographs taken for each condition are shown. Tube formation was quantified by counting the number of branching points in the total photographed area. (*p < 0.05; **p < 0.01; ***p < 0.001; ****p < 0.0001).
FIGURE 4
FIGURE 4
Plasma EVs favour monocyte differentiation towards macrophages with decreased inflammatory and enhanced tissue‐repair functions. Monocytes were differentiated with M‐CSF (50 ng/mL) in the presence or absence of pEVs for 5 days. (a, upper panel) Representative histograms showing MHC‐II, CD206, CD163 and merTK expression of pEV‐treated cells (green) compared to no‐EV control (grey), and isotype control (dotted line) analysed by flow cytometry. (A, lower panel) Summary of 7 independent MDM cultures stimulated with pEVs from 13 individual donors, (mean ± SEM) showing geometric mean fluorescence intensities (GMFI) of the mentioned markers in the pEV‐treated condition compared with the non‐EV control (M‐CSF differentiation alone). (b) Cytokine profile on 24‐h supernatants of MDMs (n = 2 independent cultures) differentiated in the presence or absence of pEVs (n = 6 individual donors) for 5 days and further stimulated with RSQ or LPS (c) Phagocytosis of apoptotic cells. MDMs differentiated with M‐CSF at 50 ng/mL alone or in combination with pEVs were trypsinised at day 5 and mixed with CFSE‐labelled apoptotic neutrophils (1:2) in FBS 1%‐RPMI. After 1 h incubation at 37°C, phagocytosis was stopped by washing with cold PBS. Cells were maintained on ice until cytometric acquisition. Left: Representative histograms showing the phagocytosis‐positive population. Right: Quantification of phagocytosis in three independent macrophages stimulated with pEVs from six individual donors. (*p < 0.05; **p < 0.01; ***p < 0.001).
FIGURE 5
FIGURE 5
PGE2 production is involved in pEV‐inhibitory effect on macrophages. (a) PGE2 was evaluated by a homogeneous time‐resolved fluorescence competitive assay. PGE2 concentration on 24 h‐supernatants of MDMs treated with pEVs alone or in combination with RSQ versus unstimulated (NEG) and RSQ only treatment is shown. Results from 6 independent MDM cultures stimulated with pEVs from 14 individual donors. (*p < 0.05). (b) Relative expression of COX2 at 4 h on MDMs exposed to the different experimental conditions, normalized to housekeeping gene GAPDH and to unstimulated condition (NEG). Results from five independent MDM cultures stimulated with seven pEV preparations (obtained from plasma pooled from 3 to 4 donors) are shown. Statistical comparison between RSQ versus RSQ + pEV conditions was performed by ratio paired t test (C) MDMs (three independent donors) pretreated or not for 20 min with 25 μM Celecoxib (Cib) were stimulated with RSQ alone or in combination with pEVs from 2, 5 and 3 individual donors in each experiment; TNF‐α secretion into supernatants was evaluated 4 h later by ELISA. (d) Representative immunoblots showing pCREB kinetics on MDMs along time (5, 10, 20, 40 and 60 min) after RSQ treatment (R) in the absence or presence of pEVs (R + EV), or treatment with pEVs alone (EV), versus untreated control (NEG). GRP94 was used as loading control. (e) Kinetics of p‐CREB/CREB ratio, measured as band intensity quantification in four independent experiments. (f) Working model. Macrophages exposed to infections detect PAMPs such as single‐stranded RNA molecules in the endocytic compartments through TLR7/8 receptors and LPS by TLR4 in plasma membrane (1). This interaction triggers molecular signals leading to NFkB activation (2) and synthesis of pro‐inflammatory cytokines (3), typical of inflammatory (M1) macrophages. However, when plasma EVs reach the site of infection, they interact with and/or are uptaken by macrophages (4) and induce sustained CREB phosphorylation. pCREB suppresses NFkB‐mediated transcription (5) thus reducing transcription of pro‐inflammatory cytokines (6), and induces IL‐10 (7) and COX2 transcription, among other genes, with the consequent increase in PGE2 production (8). PGE2 acts in an autocrine and paracrine fashion to promote a tissue‐repair (M2‐like) phenotype in macrophages. Thus, we propose that plasma EVs act as endogenous immunomodulators of macrophages at the site of infection, promoting the transition from inflammation to resolution. (*p < 0.05; **p < 0.01; ns: not significant).

References

    1. Atay, S. , Gercel‐Taylor, C. , & Taylor, D. D. (2011). Human trophoblast‐derived exosomal fibronectin induces pro‐inflammatory IL‐1β production by macrophages. American Journal of Reproductive Immunology, 66(4), 259–269. - PubMed
    1. Baluk, P. , Hirata, A. , Thurston, G. , Fujiwara, T. , Neal, C. R. , Michel, C. C. , & McDonald, D. M. (1997). Endothelial gaps: Time course of formation and closure in inflamed venules of rats. American Journal of Physiology, 272(1 Pt 1), L155–L170. - PubMed
    1. Bannoud, N. , García, P. A. , Gambarte‐Tudela, J. , Sundblad, V. , Cagnoni, A. J. , Bach, C. A. , Pérez Saez, J. M. , Blidner, A. G. , Maller, S. M. , Mariño, K. V. , Salatino, M. , Cerliani, J. P. , Rabinovich, G. A. , & Croci, D. O. (2022). Untangling galectin‐mediated circuits that control hypoxia‐driven angiogenesis. Methods in Molecular Biology, 2442, 635–653. 10.1007/978-1-0716-2055-7_34 - DOI - PubMed
    1. Barrès, C. , Blanc, L. , Bette‐Bobillo, P. , André, S. , Mamoun, R. , Gabius, H.‐J. , & Vidal, M. (2010). Galectin‐5 is bound onto the surface of rat reticulocyte exosomes and modulates vesicle uptake by macrophages. Blood, 115(3), 696–705. - PubMed
    1. Basil, M. C. , & Levy, B. D. (2016). Specialized pro‐resolving mediators: Endogenous regulators of infection and inflammation. Nature Reviews Immunology, 16(1), 51–67. - PMC - PubMed

Publication types