. 2023 May 19:17:1160353.
doi: 10.3389/fnins.2023.1160353. eCollection 2023.

Drosophila photoreceptor systems converge in arousal neurons and confer light responsive robustness

Affiliations

Drosophila photoreceptor systems converge in arousal neurons and confer light responsive robustness

David D Au et al. Front Neurosci. .

Abstract

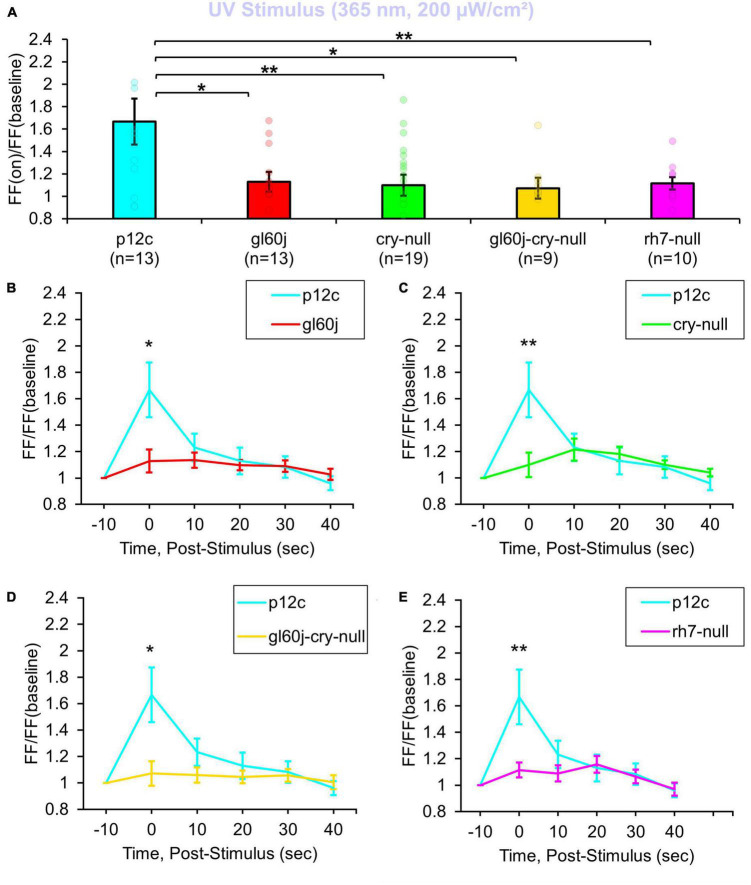
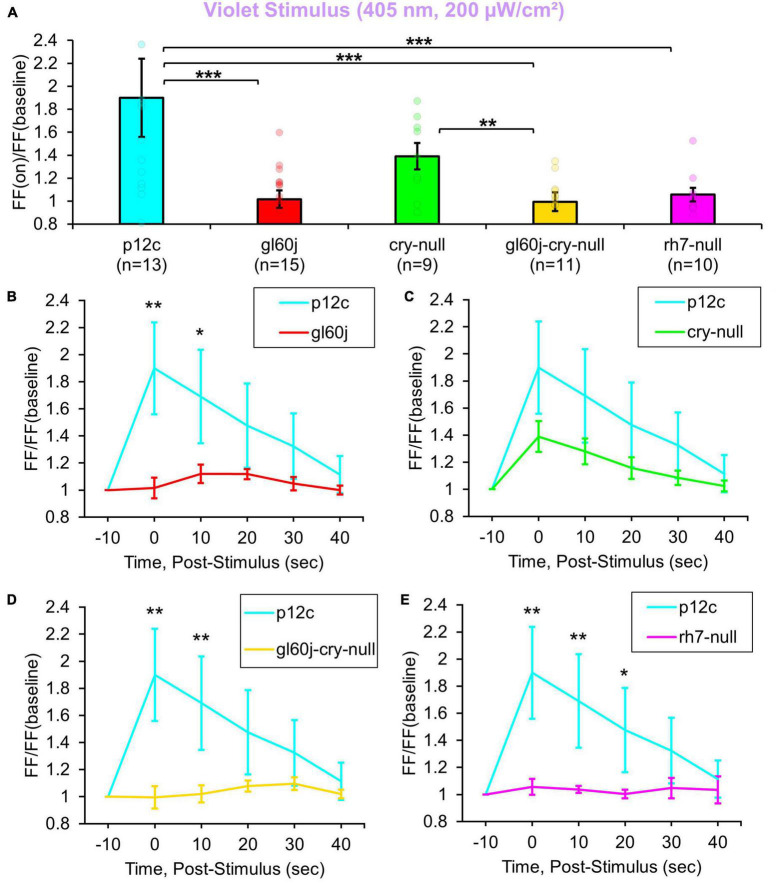
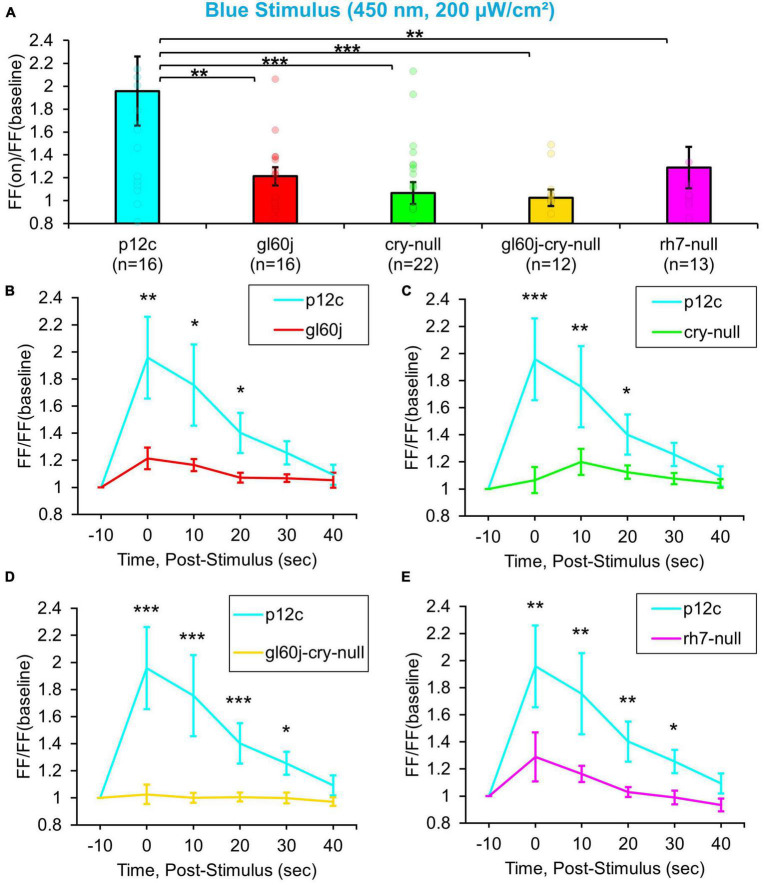
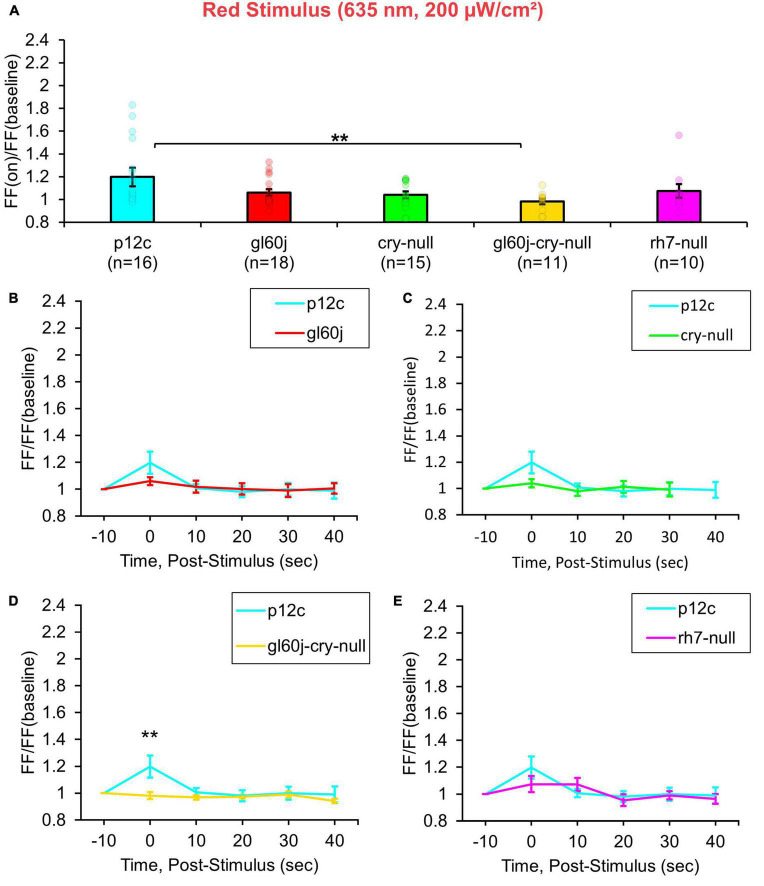
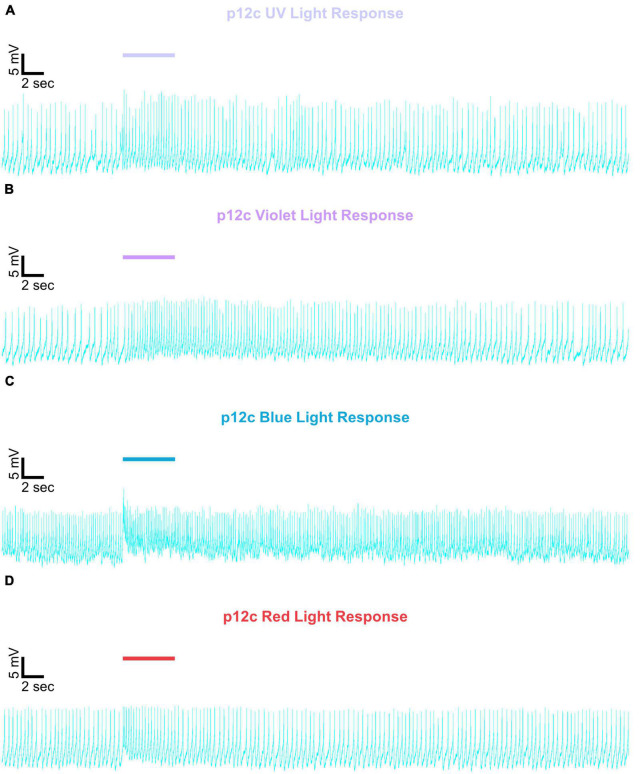
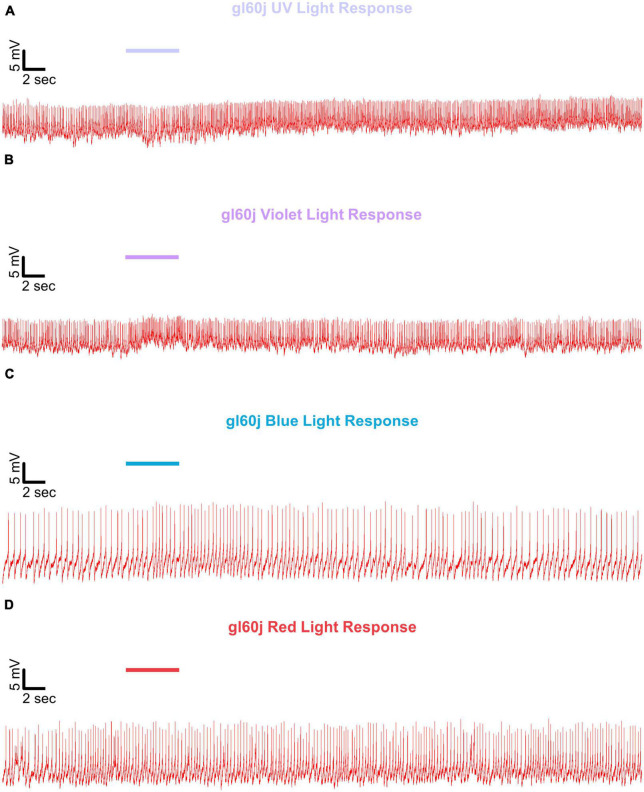
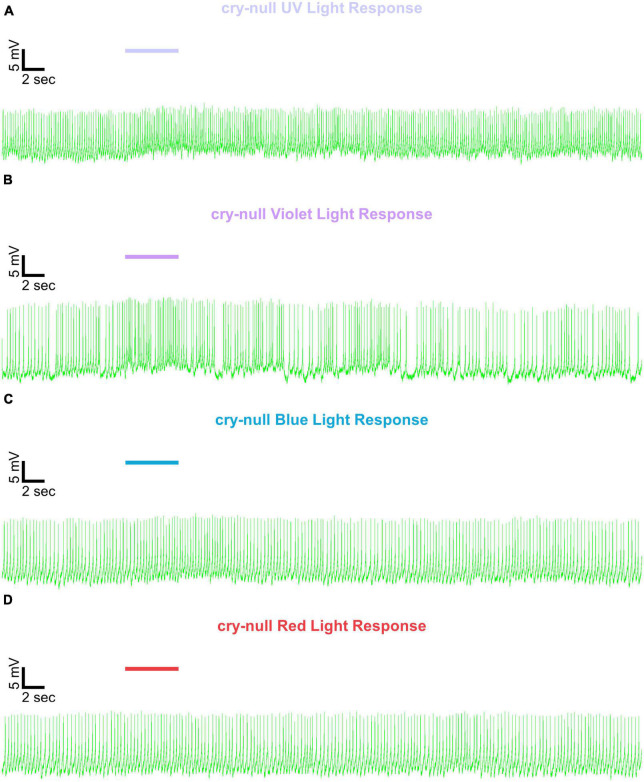
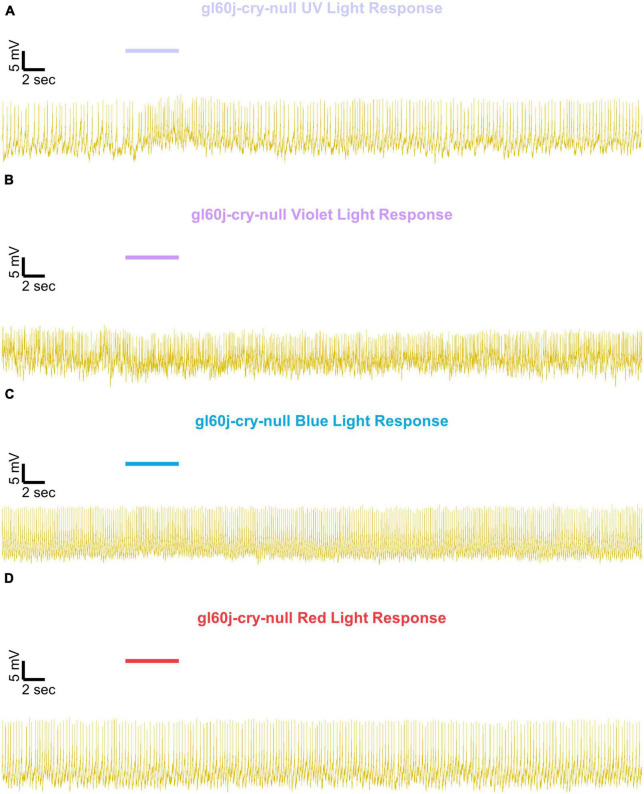
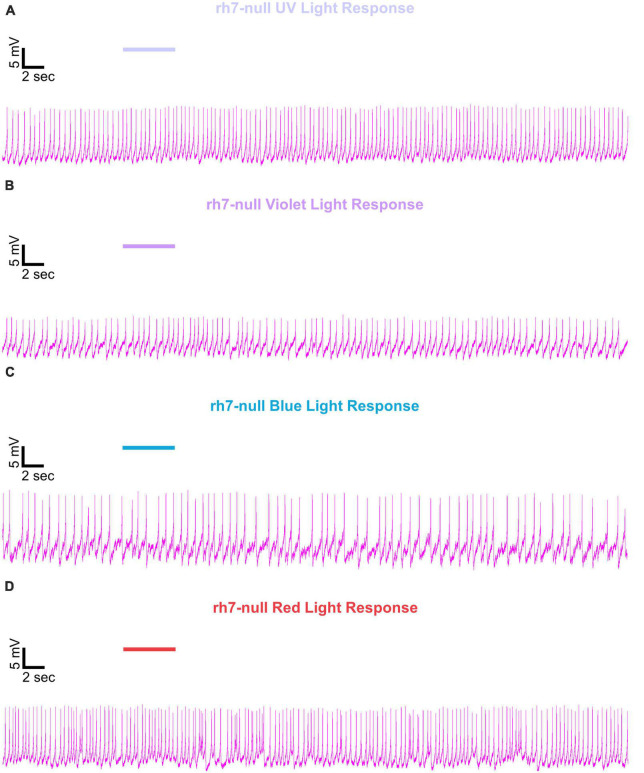
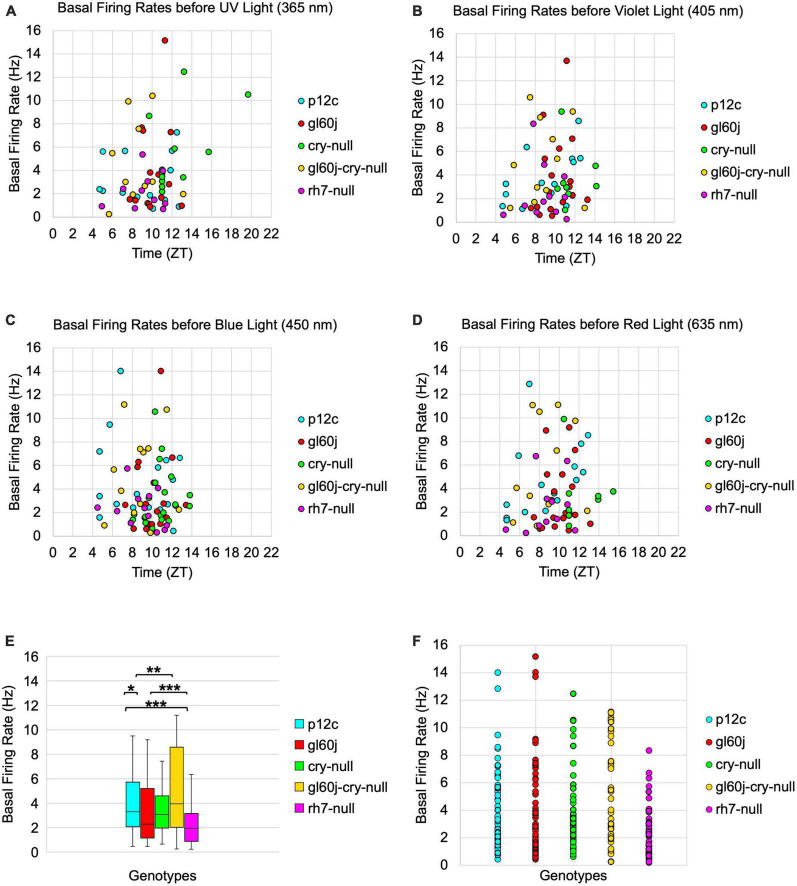
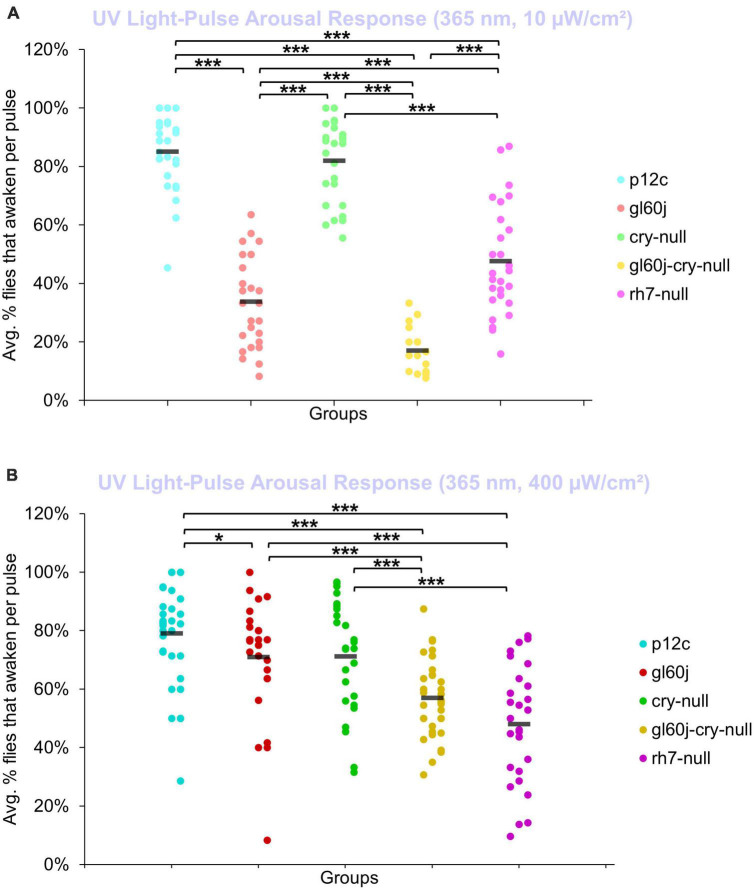
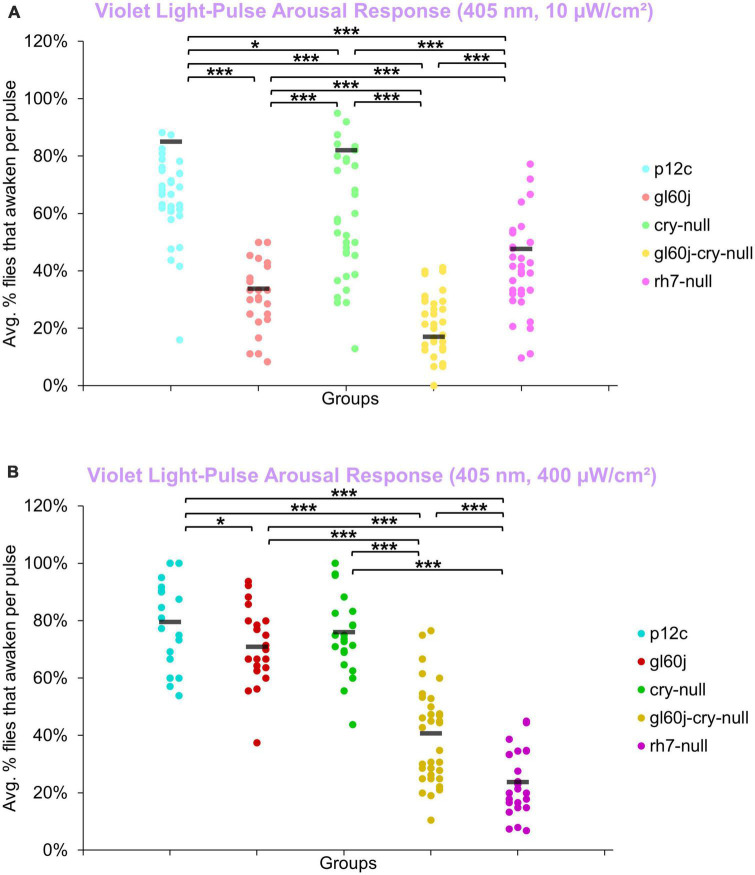
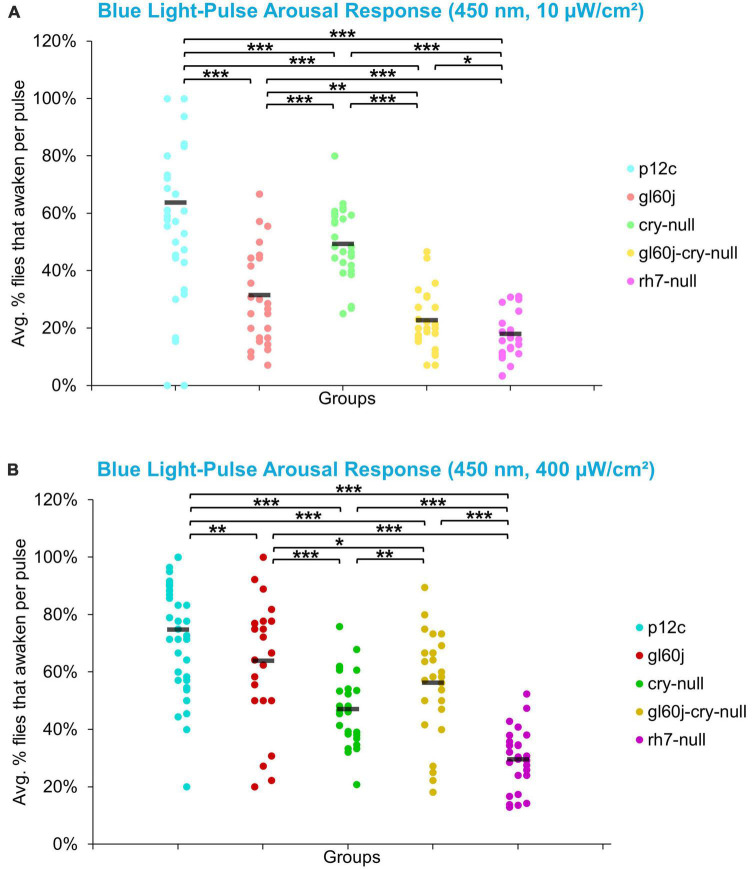
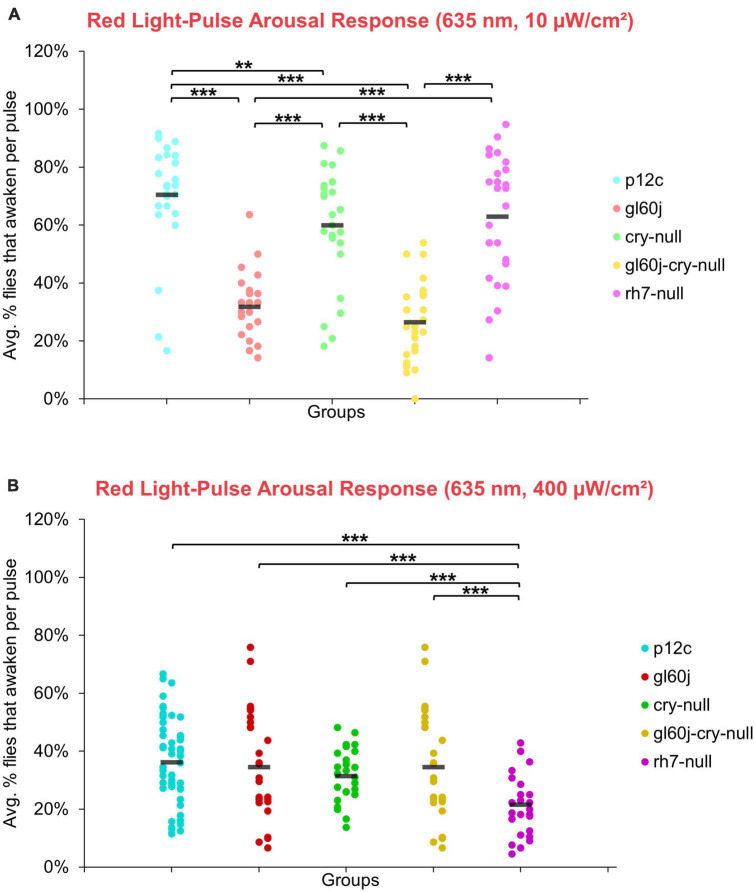
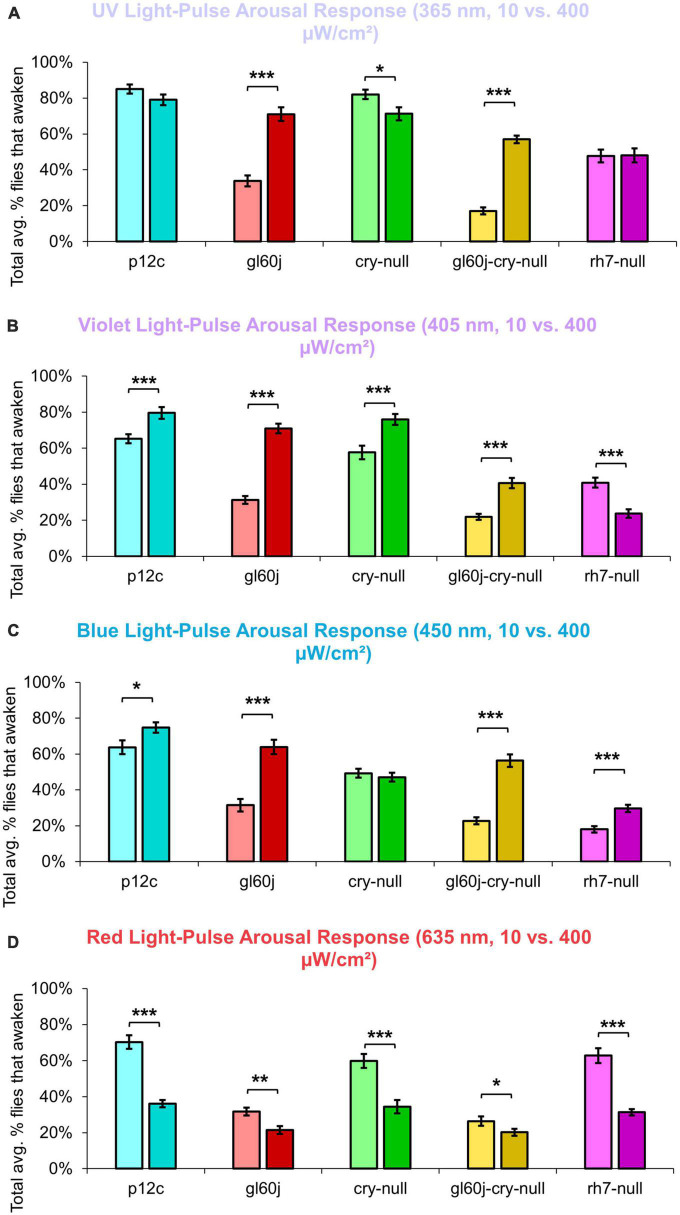
Lateral ventral neurons (LNvs) in the fly circadian neural circuit mediate behaviors other than clock resetting, including light-activated acute arousal. Converging sensory inputs often confer functional redundancy. The LNvs have three distinct light input pathways: (1) cell autonomously expressed cryptochrome (CRY), (2) rhodopsin 7 (Rh7), and (3) synaptic inputs from the eyes and other external photoreceptors that express opsins and CRY. We explored the relative photoelectrical and behavioral input contributions of these three photoreceptor systems to determine their functional impact in flies. Patch-clamp electrophysiology measuring light evoked firing frequency (FF) was performed on large LNvs (l-LNvs) in response to UV (365 nm), violet (405 nm), blue (450 nm), or red (635 nm) LED light stimulation, testing controls versus mutants that lack photoreceptor inputs gl60j, cry-null, rh7-null, and double mutant gl60j-cry-null flies. For UV, violet, and blue short wavelength light inputs, all photoreceptor mutants show significantly attenuated action potential FF responses measured in the l-LNv. In contrast, red light FF responses are only significantly attenuated in double mutant gl60j-cry-null flies. We used a light-pulse arousal assay to compare behavioral responses to UV, violet, blue and red light of control and light input mutants, measuring the awakening arousal response of flies during subjective nighttime at two different intensities to capture potential threshold differences (10 and 400 μW/cm2). The light arousal behavioral results are similar to the electrophysiological results, showing significant attenuation of behavioral light responses for mutants compared to control. These results show that the different LNv convergent photoreceptor systems are integrated and together confer functional redundancy for light evoked behavioral arousal.

Keywords: Drosophila melanogaster; cryptochrome; electrophysiology; external rhodopsin; internal rhodopsin-7; light arousal behavior; non-image forming vision; photoreceptor circuit.


Conflict of interest statement

The authors declare that the research was conducted in the absence of any commercial or financial relationships that could be construed as a potential conflict of interest.

Figures

FIGURE 1
FIGURE 1
All photoreceptor mutants show an attenuated UV light firing frequency (FF) compared to native expressed Drosophila CRY. (A) Firing frequency response of p12c (blue column, n = 13) versus gl60j (red column, n = 13), cry-null (green column, n = 19), gl60j-cry-null (yellow column, n = 9), and rh7-null (violet column, n = 10) with 5 s UV (365 nm, 200 μW/cm2) light stimulus. Post-stimulus FF response in 10 min bins for (B) p12c (blue trace) vs. gl60j (red trace), (C) p12c vs. cry-null (green trace), (D) p12c vs. gl60j-cry-null (yellow trace), and (E) p12c vs. rh7-null (violet trace). Data are plotted as average ± SEM. Pairwise comparison was analyzed using two-sample t-test with FDR adjustment. *p < 0.1 and **p < 0.05.
FIGURE 2
FIGURE 2
All photoreceptor mutants except cry-null show an attenuated violet light firing frequency (FF) compared to native expressed Drosophila CRY. (A) Firing frequency response of p12c (blue column, n = 13) versus gl60j (red column, n = 15), cry-null (green column, n = 9), gl60j-cry-null (yellow column, n = 11), and rh7-null (violet column, n = 10) with 5 s violet (405 nm, 200 μW/cm2) light stimulus. Post-stimulus FF response in 10 min bins for (B) p12c (blue trace) vs. gl60j (red trace), (C) p12c vs. cry-null (green trace), (D) p12c vs. gl60j-cry-null (yellow trace), and (E) p12c vs. rh7-null (violet trace). Data are plotted as average ± SEM. Pairwise comparison was analyzed using two-sample t-test with FDR adjustment. *p < 0.1, **p < 0.05, ***p < 0.01.
FIGURE 3
FIGURE 3
All photoreceptor mutants show an attenuated blue light firing frequency (FF) compared to native expressed Drosophila CRY. (A) Firing frequency response of p12c (blue column, n = 16) versus gl60j (red column, n = 16), cry-null (green column, n = 22), gl60j-cry-null (yellow column, n = 12), and rh7-null (violet column, n = 13) with 5 s blue (450 nm, 200 μW/cm2) light stimulus. Post-stimulus FF response in 10 min bins for (B) p12c (blue trace) vs. gl60j (red trace), (C) p12c vs. cry-null (green trace), (D) p12c vs. gl60j-cry-null (yellow trace), and (E) p12c vs. rh7-null (violet trace). Data are plotted as average ± SEM. Pairwise comparison was analyzed using two-sample t-test with FDR adjustment. *p < 0.1, **p < 0.05, ***p < 0.01.
FIGURE 4
FIGURE 4
gl60j-cry-null photoreceptor mutants show an attenuated red light firing frequency (FF) compared to native expressed Drosophila CRY. (A) Firing frequency response of p12c (blue column, n = 16) versus gl60j (red column, n = 18), cry-null (green column, n = 15), gl60j-cry-null (yellow column, n = 11), and rh7-null (violet column, n = 10) with 5 s red (635 nm, 200 μW/cm2) light stimulus. Post-stimulus FF response in 10 min bins for (B) p12c (blue trace) vs. gl60j (red trace), (C) p12c vs. cry-null (green trace), (D) p12c vs. gl60j-cry-null (yellow trace), and (E) p12c vs. rh7-null (violet trace). Data are plotted as average ± SEM. Pairwise comparison was analyzed using two-sample t-test with FDR adjustment. **p < 0.05.
FIGURE 5
FIGURE 5
Representative voltage traces of l-LNvs electrophysiological responses to UV, violet, blue, and red light stimulus for native expressed Drosophila CRY. Representative voltage traces of the last 60 s of a patch-clamp recording of l-LNvs subjected to 5 s of (A) UV, (B) violet, (C) blue, and (D) red light stimulus for natively expressed Drosophila CRY, p12c (blue traces). Colored bars indicate 5 s of 200 μW/cm2 light stimulus. Vertical scale bars represent 5 mV and horizontal scale bars represent 2 s.
FIGURE 6
FIGURE 6
Representative voltage traces of l-LNvs electrophysiological responses to UV, violet, blue, and red light stimulus for gl60j. Representative voltage traces of the last 60 s of a patch-clamp recording of l-LNvs subjected to 5 s of (A) UV, (B) violet, (C) blue, and (D) red light stimulus for gl60j flies (red traces). Colored bars indicate 5 s of 200 μW/cm2 light stimulus. Vertical scale bars represent 5 mV and horizontal scale bars represent 2 s.
FIGURE 7
FIGURE 7
Representative voltage traces of l-LNvs electrophysiological responses to UV, violet, blue, and red light stimulus for cry-null. Representative voltage traces of the last 60 s of a patch-clamp recording of l-LNvs subjected to 5 s of (A) UV, (B) violet, (C) blue, and (D) red light stimulus for cry-null flies (green traces). Colored bars indicate 5 s of 200 μW/cm2 light stimulus. Vertical scale bars represent 5 mV and horizontal scale bars represent 2 s.
FIGURE 8
FIGURE 8
Representative voltage traces of l-LNvs electrophysiological responses to UV, violet, blue, and red light stimulus for gl60j-cry-null. Representative voltage traces of the last 60 s of a patch-clamp recording of l-LNvs subjected to 5 s of (A) UV, (B) violet, (C) blue, and (D) red light stimulus for gl60j-cry-null flies (yellow traces). Colored bars indicate 5 s of 200 μW/cm2 light stimulus. Vertical scale bars represent 5 mV and horizontal scale bars represent 2 s.
FIGURE 9
FIGURE 9
Representative voltage traces of l-LNvs electrophysiological responses to UV, violet, blue, and red light stimulus for rh7-null. Representative voltage traces of the last 60 s of a patch-clamp recording of l-LNvs subjected to 5 s of (A) UV, (B) violet, (C) blue, and (D) red light stimulus for rh7-null flies (violet traces). Colored bars indicate 5 s of 200 μW/cm2 light stimulus. Vertical scale bars represent 5 mV and horizontal scale bars represent 2 s.
FIGURE 10
FIGURE 10
Basal firing rates are not equivalent across groups and there is no time-of-day dependent effect. Average basal firing rates of p12c (blue), gl60j (red), cry-null (green), gl60j-cry-null (yellow), and rh7-null (violet) before (A) UV, (B) violet, (C) blue, and (D) red light stimulus plotted against the relative time-of-day of each recording. (E) Box-and-whisker plot summary of the average basal firing rate for p12c [(n = 35) total, n (ZT0-12) = 30; n (ZT12-16) = 5], gl60j [(n = 22) total, n (ZT0-12) = 20; n (ZT12-16) = 2], cry-null [(n = 26) total, n (ZT0-12) = 14; n (ZT12-16) = 12], gl60j-cry-null [(n = 30) total, n (ZT0-12) = 22; n (ZT12-16) = 8], and rh7-null [(n = 30) total, n (ZT0-12) = 22; n (ZT12-16) = 8]. Median values are denoted by a solid black line within each box of the plot. (F) Individual data points for each genotype for all time points, showing the distribution of the data. Black *indicates FDR adjusted two-sample t-test p ≤ 0.01 vs. p12c. Data are represented as a range of means in a sample set ± maximum and minimum values within the set. One significance symbol, p ≤ 0.1; two significance symbols, p ≤ 0.05; three significance symbols, p ≤ 0.01.
FIGURE 11
FIGURE 11
Low and high intensity UV light pulse arousal behavior is significantly attenuated in all photoreceptor mutants except cry-null compared to the control p12c. Three 5 min pulses of UV light were applied to flies during subjective nighttime (ZT18, ZT19, ZT20) for 3 days after 12:12 h LD entrainment to measure the arousal response of p12c (blue), gl60j (red), cry-null (green), gl60j-cry-null (yellow), and rh7-null (violet) flies for (A) low (10 μW/cm2) and (B) high (400 μW/cm2) light intensity. Scatter plots are grouped by average% of flies that awaken across the 3 days of light-pulse arousal experiment and separated as pulse 1 (left points for each group), pulse 2 (middle points for each group), and pulse 3 (right points for each group). Black bars indicate total average% flies that awaken across the 3 days and three pulses of light. Pairwise comparison was analyzed using two-sample t-test with FDR adjustment. *p < 0.1 and ***p < 0.01.
FIGURE 12
FIGURE 12
Violet light pulse arousal behavior is significantly attenuated in flies lacking Rh7 or external photoreceptors with low and high intensity light compared to the control p12c. Three 5 min pulses of violet light were applied to flies during subjective nighttime (ZT18, ZT19, ZT20) for 3 days after 12:12 h LD entrainment to measure the arousal response of p12c (blue), gl60j (red), cry-null (green), gl60j-cry-null (yellow), and rh7-null (violet) flies for (A) low (10 μW/cm2) and (B) high (400 μW/cm2) light intensity. Scatter plots are grouped by average% of flies that awaken across the 3 days of light-pulse arousal experiment and separated as pulse 1 (left points for each group), pulse 2 (middle points for each group), and pulse 3 (right points for each group). Black bars indicate total average% flies that awaken across the 3 days and three pulses of light. Pairwise comparison was analyzed using two-sample t-test with FDR adjustment. *p < 0.1 and ***p < 0.01.
FIGURE 13
FIGURE 13
Low and high intensity blue light pulse arousal behavior is significantly attenuated in all photoreceptor mutants compared to the control p12c. Three 5 min pulses of blue light were applied to flies during subjective nighttime (ZT18, ZT19, ZT20) for 3 days after 12:12 h LD entrainment to measure the arousal response of p12c (blue), gl60j (red), cry-null (green), gl60j-cry-null (yellow), and rh7-null (violet) flies for (A) low (10 μW/cm2) and (B) high (400 μW/cm2) light intensity. Scatter plots are grouped by average% of flies that awaken across the 3 days of light-pulse arousal experiment and separated as pulse 1 (left points for each group), pulse 2 (middle points for each group), and pulse 3 (right points for each group). Black bars indicate total average% flies that awaken across the 3 days and three pulses of light. Pairwise comparison was analyzed using two-sample t-test with FDR adjustment. *p < 0.1, **p < 0.05, ***p < 0.01.
FIGURE 14
FIGURE 14
Red light pulse arousal behavior is significantly attenuated in flies lacking external photoreceptors at low and high light intensity compared to the control p12c. Three 5 min pulses of red light were applied to flies during subjective nighttime (ZT18, ZT19, ZT20) for 3 days after 12:12 h LD entrainment to measure the arousal response of p12c (blue), gl60j (red), cry-null (green), gl60j-cry-null (yellow), and rh7-null (violet) flies for (A) low (10 μW/cm2) and (B) high (400 μW/cm2) light intensity. Scatter plots are grouped by average% of flies that awaken across the 3 days of light-pulse arousal experiment and separated as pulse 1 (left points for each group), pulse 2 (middle points for each group), and pulse 3 (right points for each group). Black bars indicate total average% flies that awaken across the 3 days and three pulses of light. Pairwise comparison was analyzed using two-sample t-test with FDR adjustment. **p < 0.05 and ***p < 0.01.
FIGURE 15
FIGURE 15
Pairwise summary comparison of light-pulse arousal between low and high intensity light. Light intensity comparison of total average% arousal response across 3 days and 3 pulses of light for p12c (lighter blue column, left, 10 μW/cm2; darker blue column, right, 400 μW/cm2), gl60j (light red, left, 10 μW/cm2; dark red column, right, 400 μW/cm2), cry-null (light green, left, 10 μW/cm2; dark green column, right, 400 μW/cm2), gl60j-cry-null (light yellow, left, 10 μW/cm2; dark yellow column, right, 400 μW/cm2), and rh7-null (light violet, left, 10 μW/cm2; dark violet column, right, 400 μW/cm2) flies for (A) UV, (B) violet, (C) blue, and (D) red light stimulus. Pairwise comparison was analyzed using two-sample t-test. *p < 0.05, **p < 0.005, ***p < 0.001.

References

    1. Alejevski F., Saint-Charles A., Michard-Vanhée C., Martin B., Galant S., Vasiliauskas D., et al. (2019). The HisCl1 histamine receptor acts in photoreceptors to synchronize Drosophila behavioral rhythms with light-dark cycles. Nat. Commun. 10:252. 10.1038/s41467-018-08116-7 - DOI - PMC - PubMed
    1. Alonso San Alberto D., Rusch C., Zhan Y., Straw A. D., Montell C., Riffell J. A. (2022). The olfactory gating of visual preferences to human skin and visible spectra in mosquitoes. Nat. Commun. 13:555. 10.1038/s41467-022-28195-x - DOI - PMC - PubMed
    1. Au D. D., Foden A. J., Park S. J., Nguyen T. H., Liu J. C., Tran M. D., et al. (2022). Mosquito cryptochromes expressed in Drosophila confer species-specific behavioral light responses. Curr. Biol. 32 3731–3744.e4. 10.1016/j.cub.2022.07.021 - DOI - PMC - PubMed
    1. Bachleitner W., Kempinger L., Wülbeck C., Rieger D., Helfrich-Förster C. (2007). Moonlight shifts the endogenous clock of Drosophila melanogaster. Proc. Natl. Acad. Sci. U.S.A. 104 3538–3543. 10.1073/pnas.0606870104 - DOI - PMC - PubMed
    1. Baik L. S., Recinos Y., Chevez J. A., Au D. D., Holmes T. C. (2019b). Multiple phototransduction inputs integrate to mediate UV light-evoked avoidance/attraction behavior in Drosophila. J. Biol. Rhythms 34 391–400. 10.1177/0748730419847339 - DOI - PMC - PubMed