. 2023 May;18(3):100800.
doi: 10.1016/j.ajps.2023.100800. Epub 2023 Mar 28.

Implantation of hydrogel-liposome nanoplatform inhibits glioblastoma relapse by inducing ferroptosis

Affiliations

Implantation of hydrogel-liposome nanoplatform inhibits glioblastoma relapse by inducing ferroptosis

Zixiao Wang et al. Asian J Pharm Sci. 2023 May.

Abstract

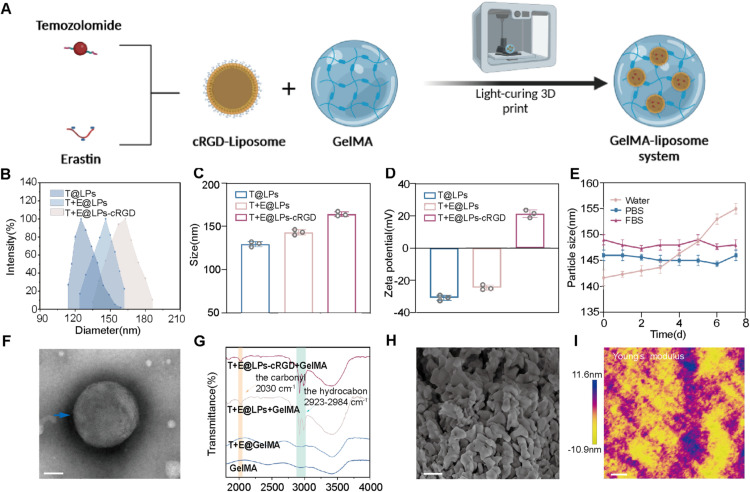
Glioblastoma is acknowledged as the most aggressive cerebral tumor in adults. However, the efficacy of current standard therapy is seriously undermined by drug resistance and suppressive immune microenvironment. Ferroptosis is a recently discovered form of iron-dependent cell death that may have excellent prospect as chemosensitizer. The utilization of ferropotosis inducer Erastin could significantly mediate chemotherapy sensitization of Temozolomide and exert anti-tumor effects in glioblastoma. In this study, a combination of hydrogel-liposome nanoplatform encapsulated with Temozolomide and ferroptosis inducer Erastin was constructed. The αvβ3 integrin-binding peptide cyclic RGD was utilized to modify codelivery system to achieve glioblastoma targeting strategy. As biocompatible drug reservoirs, cross-linked GelMA (gelatin methacrylamide) hydrogel and cRGD-coated liposome realized the sustained release of internal contents. In the modified intracranial tumor resection model, GelMA-liposome system achieved slow release of Temozolomide and Erastin in situ for more than 14 d. The results indicated that nanoplatform (T+E@LPs-cRGD+GelMA) improved glioblastoma sensitivity to chemotherapeutic temozolomide and exerted satisfactory anti-tumor effects. It was demonstrated that the induction of ferroptosis could be utilized as a therapeutic strategy to overcome drug resistance. Furthermore, transcriptome sequencing was conducted to reveal the underlying mechanism that the nanoplatform (T+E@LPs-cRGD+GelMA) implicated in. It is suggested that GelMA-liposome system participated in the immune response and immunomodulation of glioblastoma via interferon/PD-L1 pathway. Collectively, this study proposed a potential combinatory therapeutic strategy for glioblastoma treatment.

Keywords: Drug resistance; Ferroptosis; Glioblastoma; Hydrogel-liposome; Immunomodulation; Relapse.


Conflict of interest statement

The authors declare that they have no competing interests.

Figures

Image, graphical abstract
Graphical abstract
Fig 1
Fig. 1
Schematic illustration of the overall study design of T+E@LPs-cRGD+GelMA for the treatment of postoperative GBM recurrence in mouse.
Fig 2
Fig. 2
Characterization of T+E@LPs-cRGD+GelMA: (A) Schematic illustration of the preparation of T+E@LPs-cRGD+GelMA. (B) Size distributions of T@LPs, T+E@LPs and T+E@LPs-cRGD. Size distributions (C) and zeta potential (D) of each nanoformulation. (The data are shown as means ± SD, n = 3) (E) Dispersibility and stability of T+E@LPs-cRGD+GelMA in water, PBS and FBS. (The data are shown as means ± SD, n = 3) (F) TEM image of T+E@LPs-cRGD. Scale bar: 100 nm. (G) FTIR of GelMA, T+E@GelMA, T+E@LPs+GelMA and T+E@LPs-cRGD+GelMA. The infrared peaks at 2030 cm−1 and 2923–2984 cm−1 were identified. (H) SEM image of T+E@LPs-cRGD+GelMA. Scale bar: 1 µm (I) Young's modulus analysis for T+E@LPs-cRGD+GelMA. Scale bar: 5 µm.
Fig 3
Fig. 3
Release and uptake of T+E@LPs-cRG+GelMA: (A) Remaining mass of the hydrogel system in vitro. (The data are shown as means ± SD, n = 3 independent experiments.) (B) Release profile of each agent from the hydrogel. (The data are shown as means ± SD, n = 3) (C) Release efficiency of LPs-cRGD@GelMA through measuring the fluorescence intensity of Cy5.5 dye in PBS. (D) Release efficiency of LPs-cRGD@GelMA through measuring the fluorescence intensity of Cy5.5 dye by IVIS®. (E, F and G) Uptake of T+E@LPs-cRGD+GelMA by U251TR cells, LN229TR cells and NHA cells observed by fluorescence microscope. Blue, cell nuclei stained with Hoechst; Green, cytoskeleton stained with F-actin; Red, liposome stained with Cy5.5@LPs-cRGD+GelMA. Scale bar: 20 µm. (H) Cellular uptake of T+E@LPs-cRGD+GelMA by U251TR cells in the presence of intracellular uptake inhibitor CQ in 5 µM and 10 µM as measured through flow cytometry analysis.
Fig 4
Fig. 4
Effect of T+E@LPs-cRGD+GelMA on synergistic anti-tumor: (A and B) Effect of escalating doses of TMZ, ERA and TMZ+ERA on the viability of U251TR and LN229TR cells. (C) Proliferation rate of U251TR cells and LN229TR cells treated with T@LPs-cRGD+GelMA, E@LPs-cRGD+GelMA and T+E@LPs-cRGD+GelMA for 48 h, as measured using the EdU (red) assay. The nuclei were stained with DAPI (blue). Scale bar: 100 µm. (D and E) Graphical representation of the ratios of EdU-positive U251TR and LN229TR cells treated with each formulation (The data are shown as means ± SD, n = 3) (F) Microscopy images of Live/Dead staining of U251TR cells and LN229TR cells treated with each formulation after 48 h. T+E@LPs-cRGD+GelMA significantly reduced the density of live cells (green) and increased the number of dead cells (red). Scale bar: 100 µm. (G) Apoptosis assay 48 h after treatment with each formulation in U251TR and LN229TR cells. Annexin V-FITC (-)/PI (-) cells were alive. Annexin V-FITC (+)/PI (-) cells were considered in the early stage of apoptosis, while Annexin V-FITC (+)/PI (+) cells were in the late stage. Annexin V-FITC (-)/PI(+) cells were necrotic. FITC, fluorescein isothiocyanate. (H) The migration ability of U251TR and LN229TR cells treated with each formulation. Scale bar: 100 µm. (I and J) Statistical chart of the number of transmembrane cells in transwell analysis. (The data are shown as means ± SD, n = 3) (K, L and M) Representative images (K) and quantification of scratch wound healing assays in U251TR cells (L) and LN229TR cells (M). Scale bar: 200 µm. (The data are shown as means ± SD, n = 3) *P < 0.05; **P < 0.01; ***P < 0.001.
Fig 5
Fig. 5
The ferroptosis induced by T+E@LPs-cRG+GelMA: (A, B and C) Effect of each formulation on the protein expression of GPX4 (A), xCT (B) and ferritin (C) in U251TR cells. ) (D) qRT-PCR analyses of GPX4, SLC7A11 and ferritin in U251TR cells following treatment with each formulation. ) (E and F) Effect of each formulation on the protein expression of MGMT (E) and p53 (F) in U251TR cells.) (G) MDA levels in U251TR cells and LN229TR cells treated with each formulation for 48 h. (H) GSH levels in U251TR cells and LN229TR cells treated with each formulation for 48 h. (I and K) Representative images (I) and quantification (K) of JC-1 in U251TR cells and LN229TR cells treated with each formulation for 48 h. Red JC-1 aggregates represent normal mitochondrial membrane potential; Green JC-1 monomers represent depolarized mitochondrial membrane potential. Scale bar: 100 µm. (J and L) Representative images (J) and quantification (L) of ROS production in U251TR cells and LN229TR cells treated with each formulation for 48 h. Green fluorescence (DCF) indicates a dramatic increase in cellular reactive oxygen species. Scale bar: 100 µm. (M) TEM images of U251TR cells and LN229TR cells treated with T+E@LPs-cRGD+GelMA. The scale bar of the top image is 2 µm, and of the bottom image is 1 µm. *P < 0.05; **P < 0.01; ***P < 0.001. (All datas are shown as means ± SD, n = 3).
Fig 6
Fig. 6
Functions of T+E@LPs-cRG+GelMA on immunoregulatory: (A) Hierarchical clustering of differentially expressed genes in U251TR and U251TR cells treated with T+E@LPs-cRGD+GelMA after 48 h. The significance criteria for DEGs were set as P < 0.05 and |log2FC|>1. (B) Volcano plot of differentially expressed genes in U251TR cells treated with T+E@LPs-cRGD+GelMA. The DEGs associated with IFN signaling were marked. Yellow dots indicate significantly up-regulated genes, and blue dots indicate down-regulated genes. (C) The top 20 biological enrichment analyses of gene ontology in U251TR cells treated with T+E@LPs-cRGD+GelMA after 48 h. (D and E) Kaplan–Meier analysis of the correlation between overall survival with IFN signaling receptor IFNGR1 and IFNGR2. (F) Effect of each formulation on the protein expression of IFN-γ in U251TR cells. (G) qRT-PCR analyses of IFN-γ in U251TR cells following treatment with each formulation (The data are shown as means ± SD, n = 3) (H) The content of IFN-γ in U251TR cell supernatant following treatment with each formulation. (The data are shown as means ± SD, n = 3) (I) Effect of each formulation on the protein expression of PD-L1 in U251TR cells. (J) PD-L1 levels in U251TR cells treated with each formulation for 48 h as measured through immuno-fluorescent flow cytometry analysis (The data are shown as means ± SD, n = 3). (K) Immunolysis assays of each formulation. TCL cells were used in a 4 h immune cell lysis assay with U251TR cells and LN229TR cells, treated with each formulation for 48 h, as target cells. *P < 0.05; **P < 0.01; ***P < 0.001.
Fig 7
Fig. 7
Therapeutic efficacy of T+E@LPs-cRG+GelMA on postoperative recurrent GBM in mice: (A) Schematic illustration of the animal experimental design. (B) Quantification of the bioluminescence in tumor-bearing mice. Statistical significance was calculated using a two-way ANOVA. (C) The inhibitory effect of each formulation on the growth of postoperative recurrent GBM observed by in vivo bioluminescence imaging. (D) Changes in the bodyweight of mice during the treatment process. (The data are shown as means ± SD, n = 5) (E) Kaplan-Meier survival curves of mice after each treatment. Data were analyzed by using the log-rank (Mantel-Cox) test. (F) H&E staining of the brain tissue from each group. (G) Representative images of IHC staining for Ki-67 in mouse brain sections. Scale bar: 50 µm. (H) The protein expression of PD-L1 level in GBM tissue observed by immunofluorescence staining. Scale bar: 20 µm. *P < 0.05; **P < 0.01; ***P < 0.001.

References

    1. Wen P.Y., Weller M., Lee E.Q., Alexander B.M., Barnholtz-Sloan J.S., Barthel F.P., et al. Glioblastoma in adults: a Society for Neuro-Oncology (SNO) and European Society of Neuro-Oncology (EANO) consensus review on current management and future directions. Neuro Oncol. 2020;22(8):1073–1113. - PMC - PubMed
    1. Li H., Liu Q., Chen Z., Wu M., Zhang C., Su J., et al. Hsa_circ_0110757 upregulates ITGA1 to facilitate temozolomide resistance in glioma by suppressing hsa-miR-1298-5p. Cell Death Dis. 2021;12(3):252. - PMC - PubMed
    1. Chen J., Li Y., Yu T.S., McKay R.M., Burns D.K., Kernie S.G., et al. A restricted cell population propagates glioblastoma growth after chemotherapy. Nature. 2012;488(7412):522–526. - PMC - PubMed
    1. Choi S., Yu Y., Grimmer M.R., Wahl M., Chang S.M., Costello J.F. Temozolomide-associated hypermutation in gliomas. Neuro Oncol. 2018;20(10):1300–1309. - PMC - PubMed
    1. Liu Z., Ji X., He D., Zhang R., Liu Q., Xin T. Nanoscale drug delivery systems in Glioblastoma. Nanoscale Res Lett. 2022;17(1):27. - PMC - PubMed