

Development and Validation of a Diagnostic Model Based on Hypoxia-Related Genes in Myocardial Infarction
- PMID: 37275329
- PMCID: PMC10238209
- DOI: 10.2147/IJGM.S407759
Development and Validation of a Diagnostic Model Based on Hypoxia-Related Genes in Myocardial Infarction
Abstract
Purpose: Myocardial infarction (MI) is a common cardiovascular disease, and its underlying pathological mechanism remains unclear. We aimed to develop a diagnostic model to distinguish different subtypes of MI.
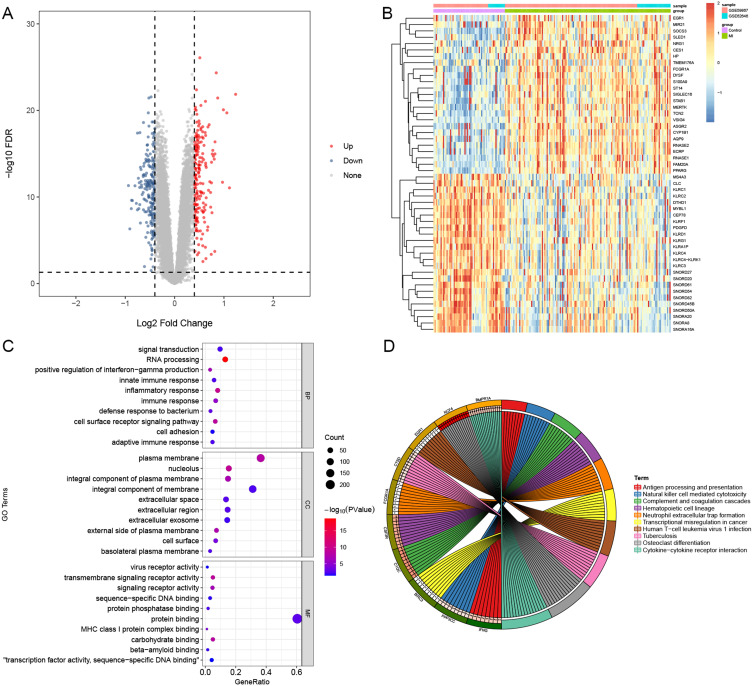
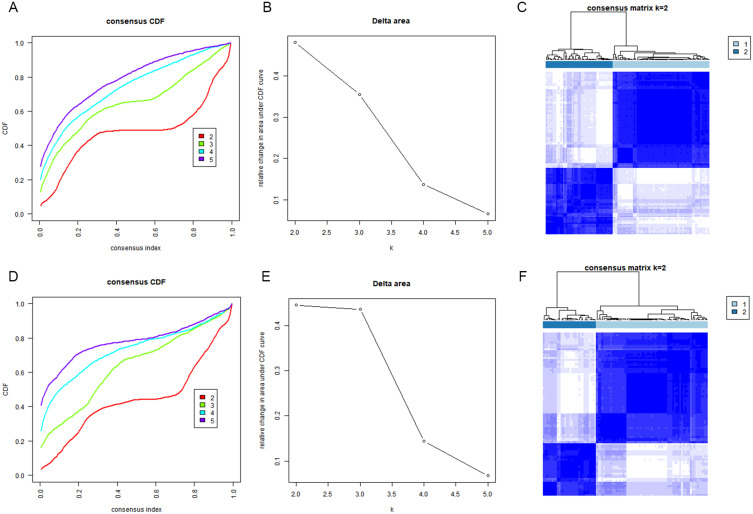
Patients and methods: The gene expression profiles of MI from the GEO database and hypoxia-related genes (HRGs) from MSigDB were downloaded. Then, the different MI subtypes based on HRGs were identified with unsupervised clustering. The difference of expression patterns and hypoxic-immune status among different subtypes of MI were investigated. The diagnostic model to distinguish the different subtypes of MI was developed and validated.
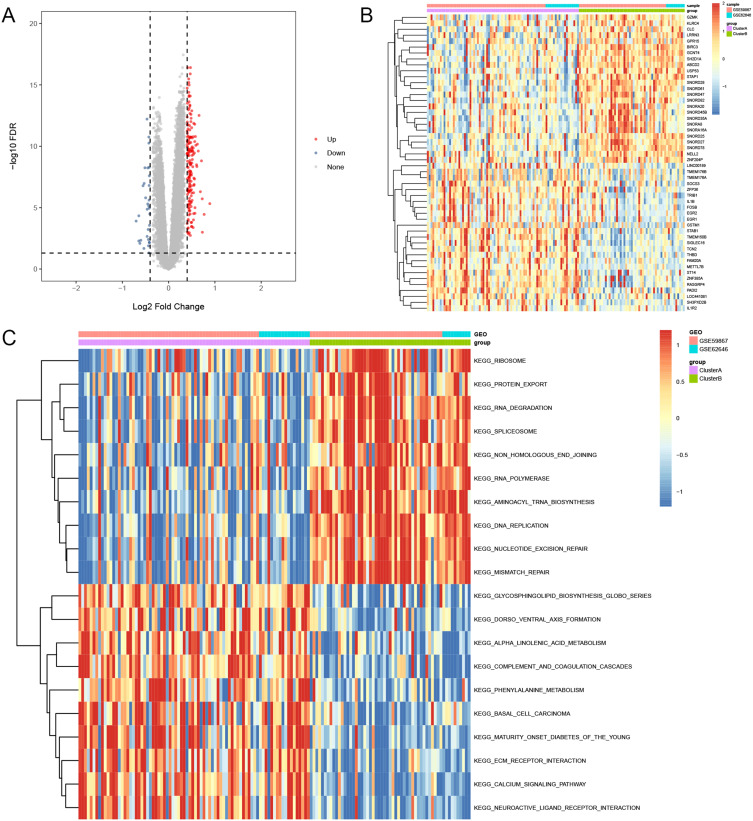
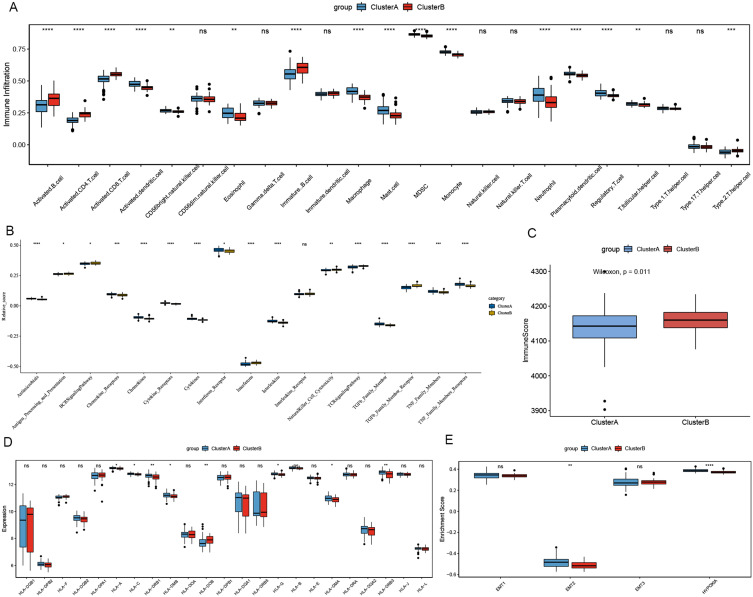
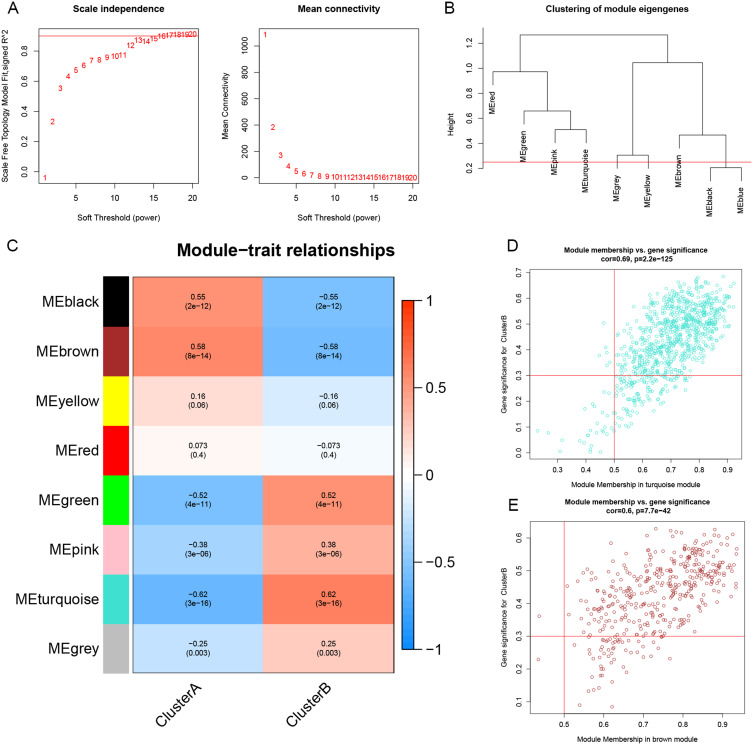
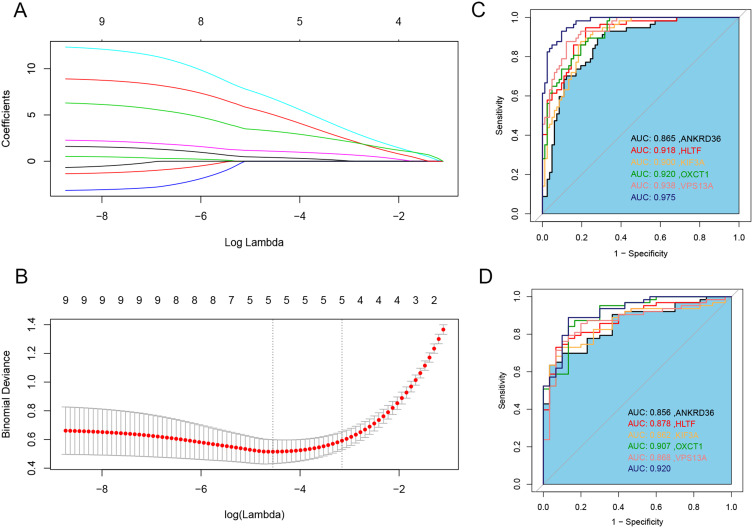
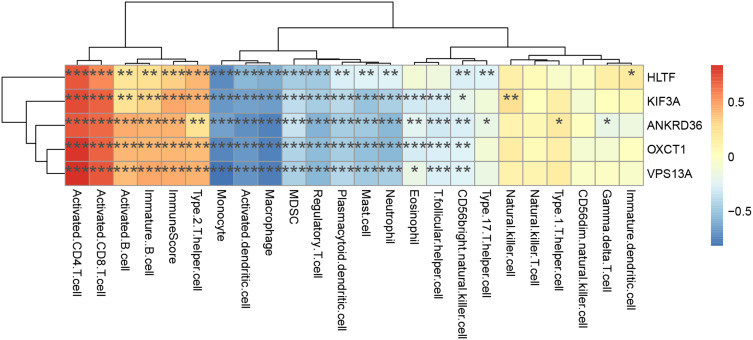
Results: Based on HRGs, MI samples were divided into two subtypes, cluster A and cluster B. A total of 211 genes showed significant changes in expression between the two subtypes. Cluster A was characterized by high hypoxia status and low immunity status. Based on weighted gene co-expression network analysis, ROC analysis and LASSO regression algorithm, 5 genes were identified as potential diagnostic markers. Finally, a diagnostic model based on these 5 genes was established, which can distinguish the two subtypes well.
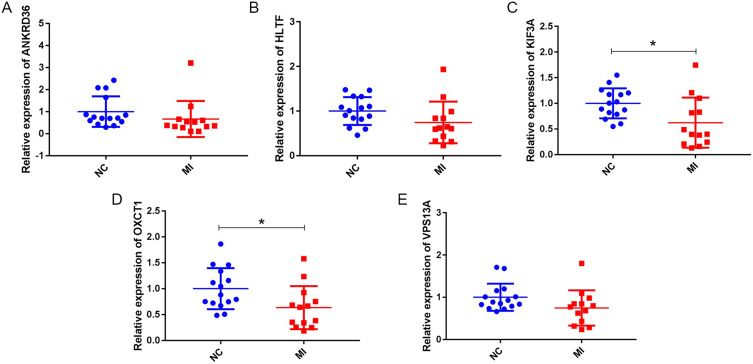
Conclusion: The five hub genes, including ANKRD36, HLTF, KIF3A, OXCT1 and VPS13A, may be associated with the different subtypes of MI.
Keywords: diagnostic model; hypoxia; immune; myocardial infarction.
© 2023 Jiang et al.
Conflict of interest statement
All authors declare that they have no conflicts of interest in this work.
Figures
Similar articles
-
Comprehensive analysis of hypoxia-related genes in diagnosis and immune infiltration in acute myocardial infarction: based on bulk and single-cell RNA sequencing data.Front Mol Biosci. 2024 Aug 21;11:1448705. doi: 10.3389/fmolb.2024.1448705. eCollection 2024. Front Mol Biosci. 2024. PMID: 39234566 Free PMC article.
-
Hypoxia-associated genes predicting future risk of myocardial infarction: a GEO database-based study.Front Cardiovasc Med. 2023 Jul 3;10:1068782. doi: 10.3389/fcvm.2023.1068782. eCollection 2023. Front Cardiovasc Med. 2023. PMID: 37465452 Free PMC article.
-
Identification of Hypoxia-Related Subtypes, Establishment of Prognostic Models, and Characteristics of Tumor Microenvironment Infiltration in Colon Cancer.Front Genet. 2022 Jun 17;13:919389. doi: 10.3389/fgene.2022.919389. eCollection 2022. Front Genet. 2022. PMID: 35783281 Free PMC article.
-
NR4A2 may be a potential diagnostic biomarker for myocardial infarction: A comprehensive bioinformatics analysis and experimental validation.Front Immunol. 2022 Dec 22;13:1061800. doi: 10.3389/fimmu.2022.1061800. eCollection 2022. Front Immunol. 2022. PMID: 36618351 Free PMC article.
-
Identification of gene expression profiles in myocardial infarction: a systematic review and meta-analysis.BMC Med Genomics. 2018 Nov 27;11(1):109. doi: 10.1186/s12920-018-0427-x. BMC Med Genomics. 2018. PMID: 30482209 Free PMC article.
Cited by
-
Identification of mitochondria-related gene biomarkers associated with immune infiltration in acute myocardial infarction.iScience. 2024 Jun 14;27(7):110275. doi: 10.1016/j.isci.2024.110275. eCollection 2024 Jul 19. iScience. 2024. PMID: 39040073 Free PMC article.
-
Partial Regulation of Ketone Metabolism by Hypoxia in H9C2 Cardiomyocytes.Curr Med Sci. 2025 Feb;45(1):25-34. doi: 10.1007/s11596-025-00002-w. Epub 2025 Feb 20. Curr Med Sci. 2025. PMID: 39976748
-
CLINICAL VALIDATION OF ANKRD36 MUTATIONS AS A NOVEL BIOMARKER FOR MONITORING EARLY PROGRESSION AND TIMELY CLINICAL INTERVENTIONS IN BLAST CRISIS CML.J Popul Ther Clin Pharmacol. 2022 Jun 27;29(2):311-320. doi: 10.53555/jptcp.v29i02.4161. Epub 2022 Feb 23. J Popul Ther Clin Pharmacol. 2022. PMID: 38465242 Free PMC article.
-
Enhanced neoangiogenesis and balance of the immune response mediated by the Wilms' tumor suppressor WT1 favor repair after myocardial infarction.Theranostics. 2025 Jun 9;15(14):6593-6614. doi: 10.7150/thno.104329. eCollection 2025. Theranostics. 2025. PMID: 40585983 Free PMC article.
References
LinkOut - more resources
Full Text Sources
