

ACDC: a general approach for detecting phenotype or exposure associated co-expression
- PMID: 37275375
- PMCID: PMC10235619
- DOI: 10.3389/fmed.2023.1118824
ACDC: a general approach for detecting phenotype or exposure associated co-expression
Abstract
Background: Existing module-based differential co-expression methods identify differences in gene-gene relationships across phenotype or exposure structures by testing for consistent changes in transcription abundance. Current methods only allow for assessment of co-expression variation across a singular, binary or categorical exposure or phenotype, limiting the information that can be obtained from these analyses.
Methods: Here, we propose a novel approach for detection of differential co-expression that simultaneously accommodates multiple phenotypes or exposures with binary, ordinal, or continuous data types.
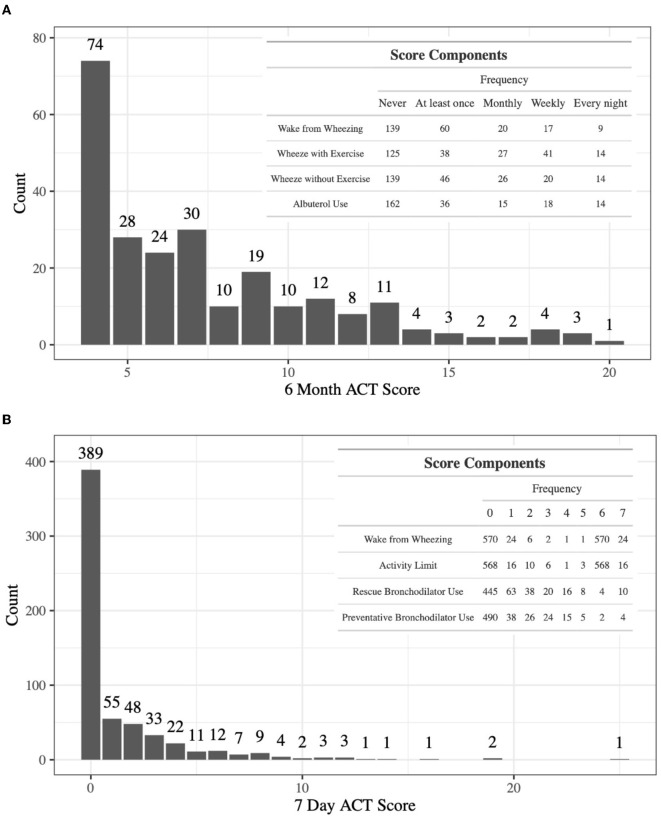
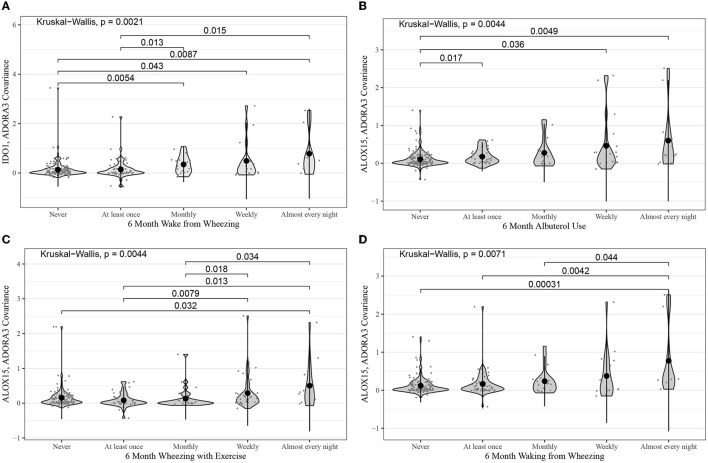
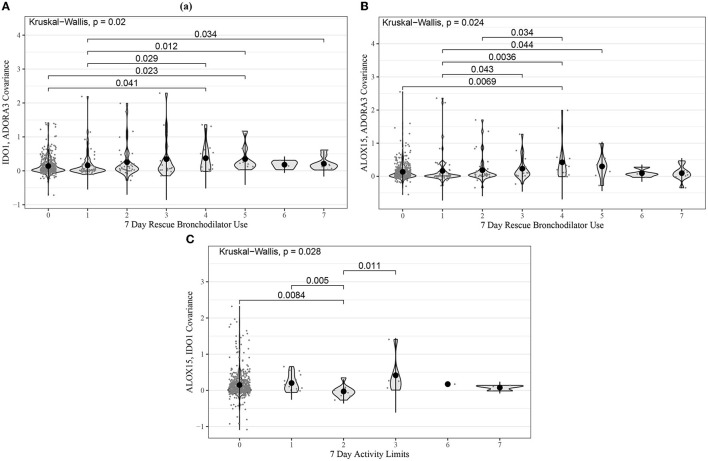
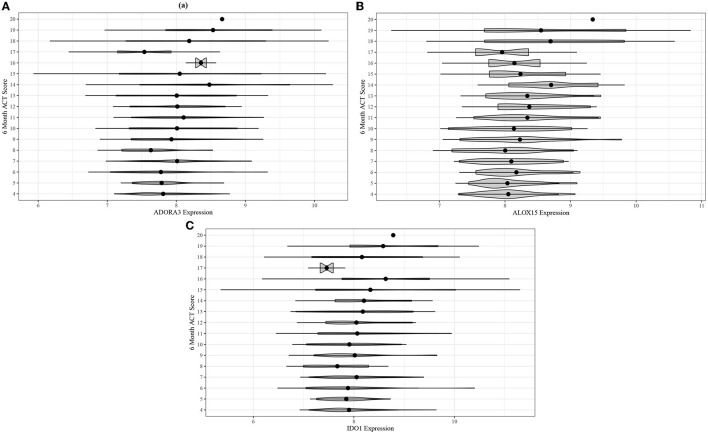
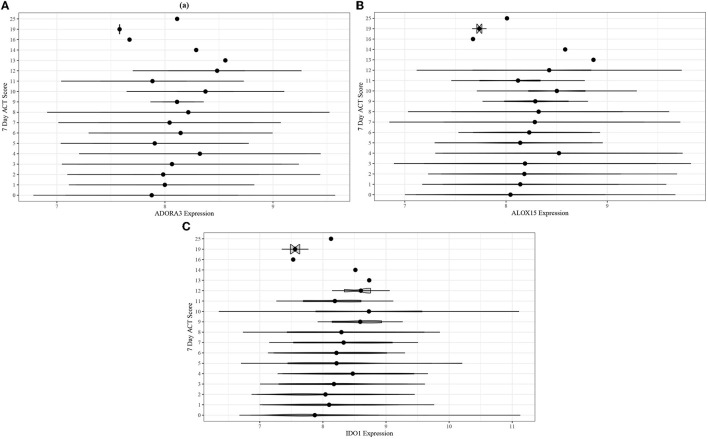
Results: We report an application to two cohorts of asthmatic patients with varying levels of asthma control to identify associations between gene co-expression and asthma control test scores. Results suggest that both expression levels and covariances of ADORA3, ALOX15, and IDO1 are associated with asthma control.
Conclusion: ACDC is a flexible extension to existing methodology that can detect differential co-expression across varying external variables.
Keywords: asthma; asthma control; differential co-expression; gene expression; inflammation.
Copyright © 2023 Queen, Nguyen, Gilliland, Chun, Raby and Millstein.
Conflict of interest statement
The authors declare that the research was conducted in the absence of any commercial or financial relationships that could be construed as a potential conflict of interest.
Figures
Similar articles
-
Mortality and Morbidity Effects of Long-Term Exposure to Low-Level PM2.5, BC, NO2, and O3: An Analysis of European Cohorts in the ELAPSE Project.Res Rep Health Eff Inst. 2021 Sep;2021(208):1-127. Res Rep Health Eff Inst. 2021. PMID: 36106702 Free PMC article.
-
Erratum: High-Throughput Identification of Resistance to Pseudomonas syringae pv. Tomato in Tomato using Seedling Flood Assay.J Vis Exp. 2023 Oct 18;(200). doi: 10.3791/6576. J Vis Exp. 2023. PMID: 37851522
-
Mortality-Air Pollution Associations in Low Exposure Environments (MAPLE): Phase 2.Res Rep Health Eff Inst. 2022 Jul;2022(212):1-91. Res Rep Health Eff Inst. 2022. PMID: 36224709 Free PMC article.
-
The effect of exposure to radiofrequency fields on cancer risk in the general and working population: A systematic review of human observational studies - Part I: Most researched outcomes.Environ Int. 2024 Sep;191:108983. doi: 10.1016/j.envint.2024.108983. Epub 2024 Aug 30. Environ Int. 2024. PMID: 39241333
-
Tezepelumab for severe asthma: elevating current practice to recognize epithelial driven profiles.Respir Res. 2024 Oct 9;25(1):367. doi: 10.1186/s12931-024-02998-6. Respir Res. 2024. PMID: 39385131 Free PMC article. Review.
References
-
- Widmann M. One-dimensional CCA and SVD, and their relationship to regression maps. J Clim. (2005) 18:2785–92. 10.1175/JCLI3424.1 - DOI
-
- Benjamini Y, Hochberg Y. Controlling the false discovery rate: a practical and powerful approach to multiple testing. J R Stat Soc Ser B Methodol. (1995) 57:289–300. 10.1111/j.2517-6161.1995.tb02031.x - DOI
Grants and funding
LinkOut - more resources
Full Text Sources
Molecular Biology Databases
Research Materials
Miscellaneous