. 2023 Jun 16;26(6):106937.
doi: 10.1016/j.isci.2023.106937. Epub 2023 May 22.

Large clones of pre-existing T cells drive early immunity against SARS-COV-2 and LCMV infection

Affiliations

Large clones of pre-existing T cells drive early immunity against SARS-COV-2 and LCMV infection

Martina Milighetti et al. iScience. .

Abstract

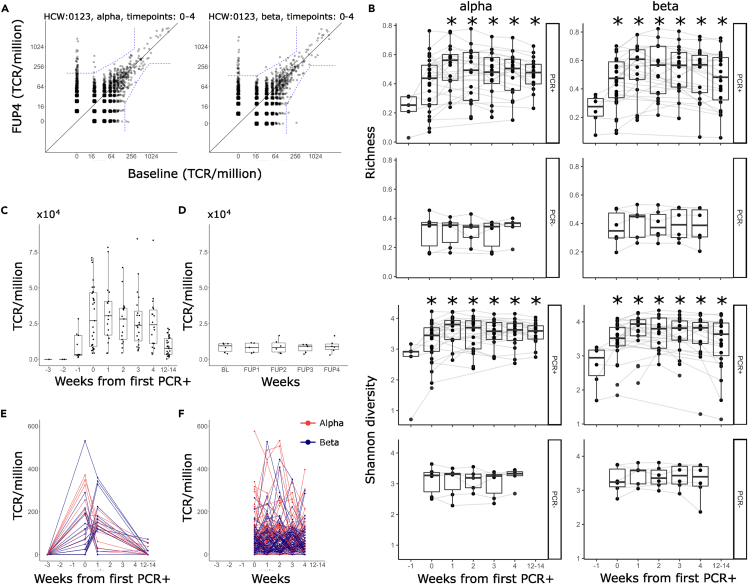
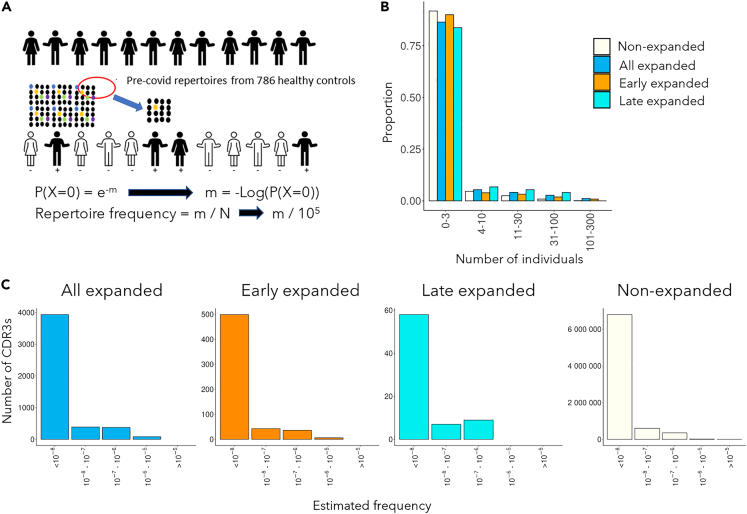
T cell responses precede antibody and may provide early control of infection. We analyzed the clonal basis of this rapid response following SARS-COV-2 infection. We applied T cell receptor (TCR) sequencing to define the trajectories of individual T cell clones immediately. In SARS-COV-2 PCR+ individuals, a wave of TCRs strongly but transiently expand, frequently peaking the same week as the first positive PCR test. These expanding TCR CDR3s were enriched for sequences functionally annotated as SARS-COV-2 specific. Epitopes recognized by the expanding TCRs were highly conserved between SARS-COV-2 strains but not with circulating human coronaviruses. Many expanding CDR3s were present at high frequency in pre-pandemic repertoires. Early response TCRs specific for lymphocytic choriomeningitis virus epitopes were also found at high frequency in the preinfection naive repertoire. High-frequency naive precursors may allow the T cell response to respond rapidly during the crucial early phases of acute viral infection.

Keywords: Biological sciences; Cell biology; Immunity; Immunology.


Conflict of interest statement

Authors declare that they have no competing interests.

Figures

None
Graphical abstract
Figure 1
Figure 1
An early transient wave of TCR expansion associated with infection with SARS-COV-2 (A) An example of a pairwise comparison between two time points, showing TCRs expanding between baseline and follow-up week 4 (FUP4) repertoires. The individual (ID 123) became PCR+ at follow-up week 1 (FUP1). Each point is an individual TCR sequence, plotting its abundance at FUP4 versus its abundance at Baseline. All abundances are normalized to number of TCRs per million. The dashed blue line indicates the significance threshold calculated as described in M&M. All TCRs which fall above and to the left of the dashed line are considered as expanded while all those which fall below and to the right are contracted. (B) The richness and Shannon diversity of the set of expanded or contracted TCRs at each time point, subsampled to similar dataset size. For PCR+ individuals, the x axis is rescaled relative to the week at which they first became PCR+ (this is week 0). For PCR-individuals the weeks correspond to baseline and subsequent follow-ups at weeks 1–4. The boxplots show median, interquartile (box) and 95% (whiskers) range. ∗p value <0.05, Wilcox test compared to week −1. (C) The sum of the expanded TCRs at each time point, for each infected individual. The timepoints have been recalibrated relative to the week of the first PCR+ test (this is defined as week 0). The boxplots show median, interquartile (box) and 95% (whiskers) range. (D) As for C, but for controls who did not become PCR+. (E) The dynamics of individual TCRs (TCRalpha in red, TCRbeta in blue) in one individual (ID 101). (F) As for E but for a PCR- (ID 17). The dynamics for each individual HCW are shown in supplementary data.
Figure 2
Figure 2
Functional annotation for SARS-COV-2 and sequence similarity characterize the early wave of expanded TCRs in PCR+ individuals (A) We collected a set of TCR sequences which had been functionally annotated for recognition of SARS-COV-2 epitopes. The set was compiled from three datasets.,, The set combines paired alpha/beta sequences and unpaired sequences. The Table shows the number of alpha and beta sequences in each set. (B) The intersection between the expanded TCRs as defined in Figure 1 (green), and the SARS-COV-2 annotated TCRs as in panel A (blue). (C) The proportion of annotated TCRs for each of four viruses which are observed in the expanded set of TCRs defined in Figure 1. SARS-COV-2 annotated TCRs are found significantly more often than those for CMV, EBV and HIV (∗∗∗p < 0.0001, ∗∗p < 0.001, Fisher’s exact test). (D) Left panel. Blue shading the number of expanded TCR CDR3s which share the same V gene as the respective identical annotated TCR CDR3. Empty bars – the number of matches after random shuffling of the expanded set with respect to their V gene. Right panel. Blue shading – the number of annotated TCRs whose restricting HLA gene matches at least one allele of the individual in whom the identical expanded CDR3 is detected. Empty bars – the number of matched TCRs after random shuffling of the annotated TCRs with respect to their HLA restriction (∗∗∗p < 0.0001, Fisher’s exact test). (E) A circus plot showing distribution of the annotated expanded TCRs in the cohort, and the metadata associated with each TCR. Each segment is a unique CDR3. Each circle is a different individual. Dark green segments correspond to an annotated expanded TCR. The inner circles show which CDR3 are alpha or beta; which CDR3 are derived from CD4 or CD8 T cells; the restricting HLA allele for each CDR3; the target antigen recognized by the annotated TCR; and the source of the CDR3. (F) A graph representation of the TCR alpha and beta sequence similarity. Each node is a CDR3 sequence, and edges connect all nodes with a string kernel similarity index of greater than 0.76 For TCRalpha and 0.72 TCRbeta. Each individual is shown in a different color. Only clusters of three or more connected nodes are shown.
Figure 3
Figure 3
Expanding TCRs associated with SARS-COV-2 infection are abundant in healthy pre-pandemic repertoires (A) Schematic of statistical inference of TCR frequencies from abundance data in pre-pandemic repertoires. m is the mean number of times a particular TCR is present in a given sample, given that that TCR is NOT detected in a proportion P of the 786 pre-pandemic repertoires examined. The estimated frequency is given by m/N, where N is the average number of TCRs sequenced in each sample. (B) Sharing of expanded TCRbeta or non-expanded control TCRs across the 786 repertoires of the Emerson dataset, collected and sequenced several years before the SARS-CoV-2 pandemic. The x axis shows the number of individuals each TCR is observed in. The y axis shows the proportion of the expanded TCRs with a given sharing level. The expanded set is shown both as a whole, as well as split into early and late, as defined in Figure S13. (C) The estimated frequency distribution of the 2648 expanded TCR beta sequences, and a same size set of non-expanded TCRs which are found in 2 or more individuals of the Emerson dataset. The frequency of each expanded TCR was estimated using Equation 2, as discussed in the text. TCR which were found once or zero times in the Emerson data were assigned a frequency of <10−6and are represented by the column closest to the y axis.
Figure 4
Figure 4
Expanded TCRs in infected hosts cannot be explained by cross-reactivity to other coronaviruses (A) Circulating coronaviruses. (B) Different strains of SARS-COV-2. Each column is a functionally defined T cell epitope of SARS-COV-2 which is recognized by a TCR whose sequence is found among the set of TCRs expanding following infection with the virus (as defined in Figure 1). The degree of homology is shown by color coding.
Figure 5
Figure 5
High-frequency LCMV specific TCRs in the naïve repertoire (A) A schematic of the experimental design. Mice were injected with PBS or LCMV and spleen T cells harvested at day 8 and day 40 post-infection. Epitope-specific T cells were isolated using specific tetramer sorting, and different subpopulations of bulk T cells were fractionated by a combination of FACS sorting and magnetic bead/antibody sorting. Both sets of T cells were processed for TCR sequencing and the overlap between the populations analyzed. (B) Total abundance of epitope-specific TCRs in the naive (purple) or effector (green) TCR repertoires in individual mice. The abundance of all four epitopes was larger in the effector population in the day 8 infected group, than in the PBS group (∗p < 0.001, Mann Whitney test). All other pairwise comparisons were not significant. (C) Distribution histogram of frequency of epitope-specific and control TCRs, estimated using either the statistical Poisson framework as in Figure 3 (left panels), or directly from TCR abundance data (right panels). Epitope-specific CDRs are split into CDRs that come up early (day 8, orange) and CDRs that come up later (day 40, cyan). The left column includes all epitope TCR which were not found within the bulk naive population, and were assigned a frequency of less than 10−6.

References

    1. Co M.D.T., Kilpatrick E.D., Rothman A.L. Dynamics of the CD8 T-cell response following yellow fever virus 17D immunization. Immunology. 2009;128:e718–e727. doi: 10.1111/j.1365-2567.2009.03070.x. - DOI - PMC - PubMed
    1. Althaus C.L., Ganusov V.v., de Boer R.J. Dynamics of CD8 + T cell responses during acute and chronic lymphocytic choriomeningitis virus infection. J. Immunol. 2007;179:2944–2951. doi: 10.4049/jimmunol.179.5.2944. - DOI - PubMed
    1. Treibel T.A., Manisty C., Burton M., McKnight Á., Lambourne J., Augusto J.B., Couto-Parada X., Cutino-Moguel T., Noursadeghi M., Moon J.C. COVID-19: PCR screening of asymptomatic health-care workers at London hospital. Lancet. 2020;395:1608–1610. doi: 10.1016/S0140-6736(20)31100-4. - DOI - PMC - PubMed
    1. Moss P. The T cell immune response against SARS-CoV-2. Nat. Immunol. 2022;23:186–193. doi: 10.1038/s41590-021-01122-w. - DOI - PubMed
    1. Grifoni A., Sidney J., Vita R., Peters B., Crotty S., Weiskopf D., Sette A. SARS-CoV-2 human T cell epitopes: adaptive immune response against COVID-19. Cell Host Microbe. 2021;29:1076–1092. doi: 10.1016/j.chom.2021.05.010. - DOI - PMC - PubMed