. 2023 May:221:104860.
doi: 10.1016/j.jpubeco.2023.104860. Epub 2023 Mar 17.

Prescription Drug Advertising and Drug Utilization: The Role of Medicare Part D

Affiliations

Prescription Drug Advertising and Drug Utilization: The Role of Medicare Part D

Abby Alpert et al. J Public Econ. 2023 May.

Abstract

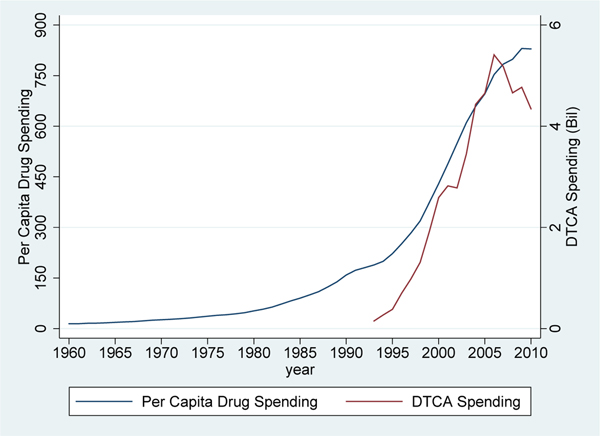
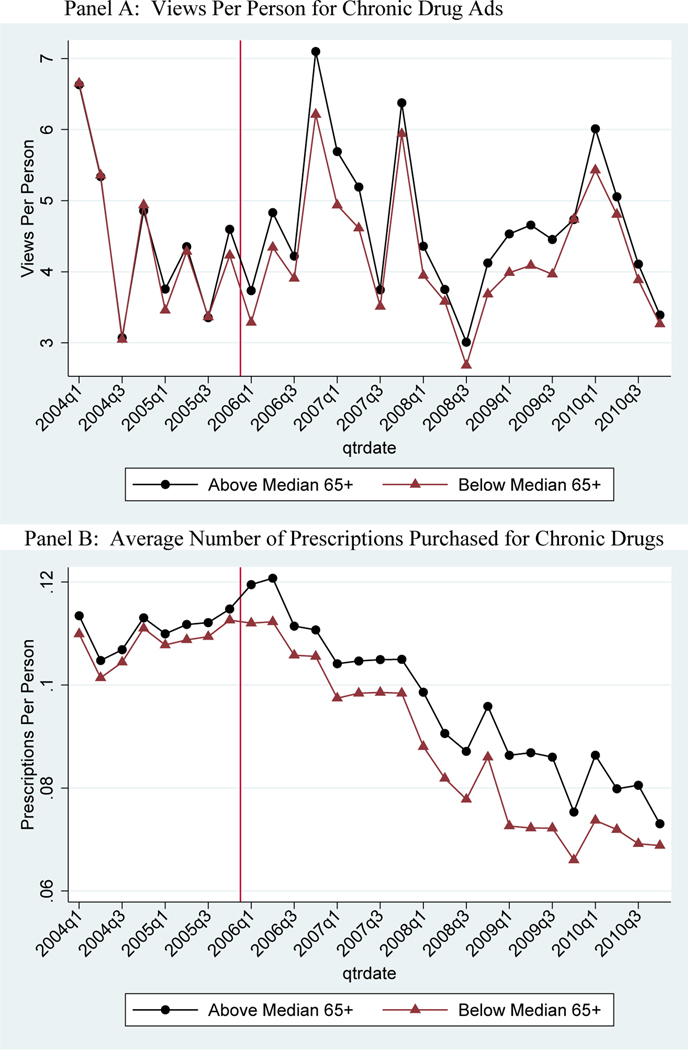
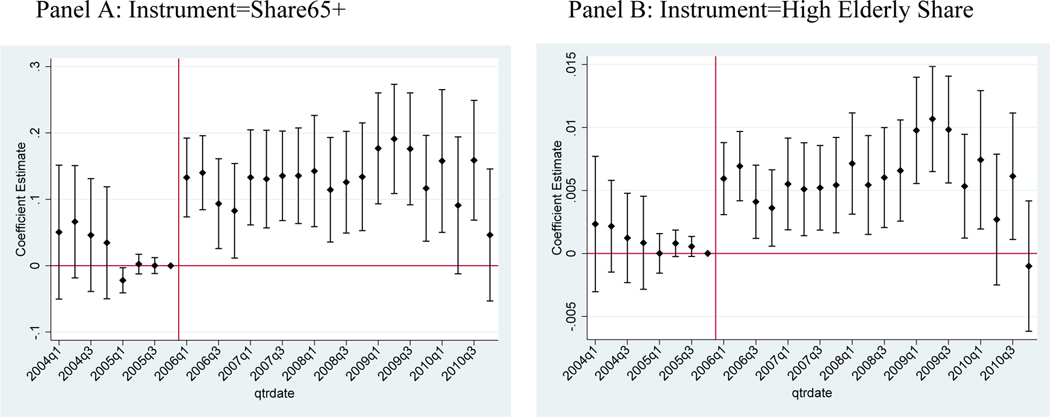
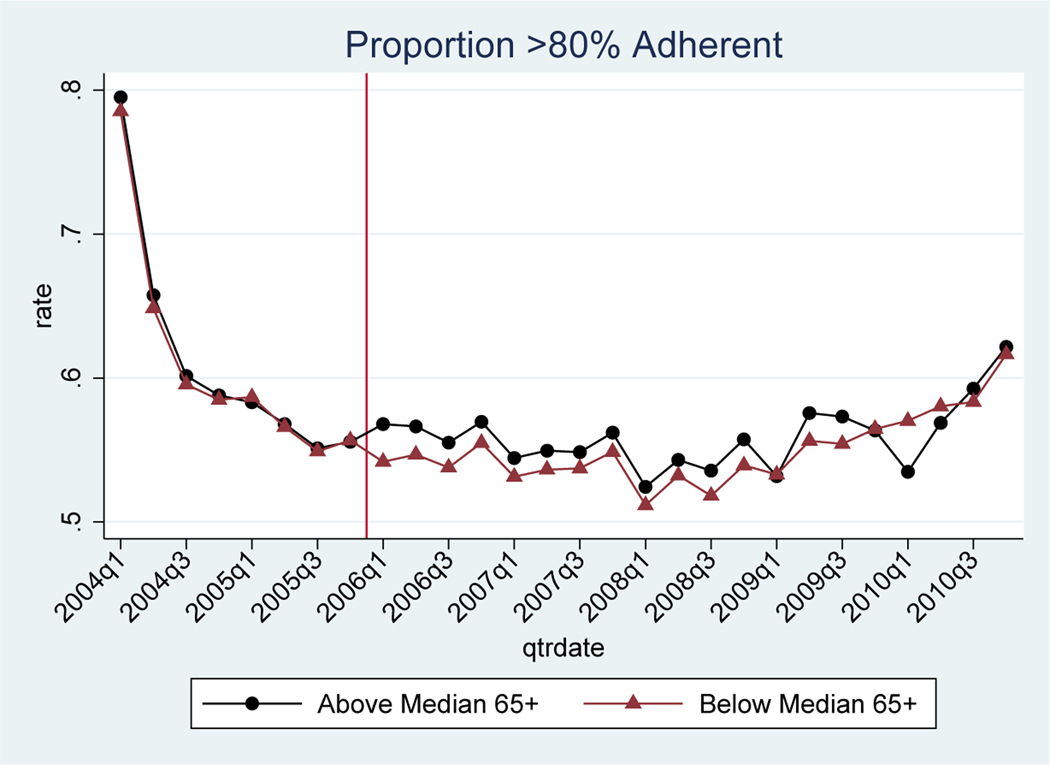
This paper examines how direct-to-consumer advertising (DTCA) for prescription drugs influences utilization by exploiting a large and plausibly exogenous shock to DTCA driven by the introduction of Medicare Part D. Part D led to larger increases in advertising in geographic areas with higher concentrations of Medicare beneficiaries. We examine the impact of this differential increase in advertising on non-elderly individuals to isolate advertising effects from the direct effects of Part D. We find that exposure to advertising led to large increases in treatment initiation and improved medication adherence. Advertising also had sizeable positive spillover effects on non-advertised generic drugs. Our results imply significant spillovers from Medicare Part D on the under-65 population and an important role for non-price factors in influencing prescription drug utilization.

Keywords: H51; I10; I18; Medicare Part D; direct-to-consumer advertising; medication adherence; prescription drugs.


Figures

Figure 1 –
Figure 1 –. Direct-to-Consumer Advertising and Prescription Drug Spending, 1960–2010
Sources: Dave (2013), National Health Expenditure Accounts (2015). The data are presented in nominal values.
Figure 2 –
Figure 2 –. Annual Views per Person of TV Ads for Top 200 Brand Name Drugs, for Non-Elderly
Notes: Sample means from Nielsen Ad*Views in above median elderly share markets relative to below median elderly share markets. The vertical lines represent the dates when Part D was signed into law (December 2003) and was implemented (January 2006). Means are plotted for a balanced panel of the top 200 advertised brand-name drugs. There is a secular downward trend in overall views per person due to patent expirations of several of these drugs over this time period (in particular, four of the top 200 drugs went off patent around 2006: Pravachol, Wellbutrin XL, Zocor, and Zoloft). The downward trend in views matches the pattern in national advertising expenditures shown in Figure 1. In Appendix Figure B.2, we exclude all drugs that went off-patent during the study period.
Figure 3 –
Figure 3 –. Quarterly Views per Person of TV Ads and Mean Utilization of Chronic Drugs, for Non-Elderly
Notes: Sample means from Nielsen Ad*Views (views per capita for non-elderly) and claims (mean number of total prescriptions purchased for non-elderly) in above median elderly share markets relative to below median elderly share markets. Includes the 50 drugs that advertised during the study period for 5 chronic conditions: depressions, diabetes, hyperlipidemia, hypertension, and osteoporosis. The vertical line represents the implementation date of Medicare Part D.
Figure 4 –
Figure 4 –. Event Study: Total Utilization of Chronic Drugs, Non-Elderly
Notes: Event study coefficients and 95% confidence intervals. Clustered standard errors at the 3-digit ZIP code level. The outcome variable is the number of prescriptions. The event study is similar to Equation 3, but Panel A interacts quarter fixed effects with the Share65+ variable (continuous instrument) and Panel B interacts quarter fixed effects with the High Elderly Share indicator (binary instrument). All specifications include quarter fixed effects, 3-digit ZIP code fixed effects, condition fixed effects. Estimates are normalized to zero in quarter 4 of 2005. Includes the 50 drugs that advertised during the study period for 5 chronic conditions: depression, diabetes, hyperlipidemia, hypertension, and osteoporosis.
Figure 5 –
Figure 5 –. Mean Utilization for Advertised Drug Classes vs. Non-Advertised Drug Classes, for Non-Elderly
Notes: Sample means from claims (mean number of total prescriptions purchased, ages 40–60) in above median elderly share markets relative to below median elderly share markets. The top two lines (black and red) are for the top 10 advertised drug classes and the bottom two lines (green and orange) are for the top 10 non-advertised drug classes (see Appendix Figure B.6 for full list of drug classes included). The vertical line represents the implementation date of Medicare Part D. We use the first two digits of the GPI code (available from IMS Health) to identify major classes of drugs.
Figure 6 –
Figure 6 –. Proportion with High Adherence of Chronic Drugs, for Non-Elderly
Notes: Sample means from claims (proportion of individuals with MPR ≥ 80%, ages 40–60) in above median elderly share markets relative to below median elderly share markets. Includes the 50 drugs that advertised during the study period and the drugs that did not advertise for 5 chronic conditions: depression, diabetes, hyperlipidemia, hypertension, and osteoporosis. The vertical line represents the implementation date of Medicare Part D.
Figure 7 –
Figure 7 –. Quarterly Mean Utilization of Chronic Drugs: Spillover Effects
Notes: Sample means from claims (mean number of total prescriptions purchased, ages 40–60) in above median elderly share markets relative to below median elderly share markets. Panel A includes the 50 chronic drugs that advertised during the study period (repeated from Figure 3); Panel B includes generic drugs that did not advertise, but are in the same classes as the 50 advertised chronic drugs; Panel C includes brand drugs that did not advertise, but are in the same classes as the 50 advertised chronic drugs; Panel D includes both the advertised and non-advertised chronic drugs combined. The vertical line represents the implementation date of Medicare Part D.

Similar articles

Cited by

References

    1. Alpert A.2016. The anticipatory effects of Medicare Part D on drug utilization. Journal of Health Economics. 49: 28–45. - PMC - PubMed
    1. Andrade S, et al. 2006. Methods for evaluation of medication adherence and persistence using automated databases. Pharmacoepidemiology and Drug Safety. 15(8): 565–574. - PubMed
    1. Avery R, Eisenberg M.and Simon K. 2012. The impact of direct-to-consumer television and magazine advertising on antidepressant use. Journal of Health Economics. 31: 705–718. - PubMed
    1. Baigent C, et al. 2005. Efficacy and safety of cholesterol-lowering treatment: prospective meta-analysis of data from 90,056 participants in 14 randomised trials of statins. Lancet. 366(9493): 1267–78. - PubMed
    1. Bellemare M.and Wichman C. 2020. Elasticies and the Inverse Hyperbolic Sine Transformation. Oxford Bulletin of Economics and Statistics. 82(1): 50–61.

LinkOut - more resources