Integrative bioinformatics and validation studies reveal KDM6B and its associated molecules as crucial modulators in Idiopathic Pulmonary Fibrosis
- PMID: 37275887
- PMCID: PMC10235501
- DOI: 10.3389/fimmu.2023.1183871
Integrative bioinformatics and validation studies reveal KDM6B and its associated molecules as crucial modulators in Idiopathic Pulmonary Fibrosis
Abstract
Background: Idiopathic Pulmonary Fibrosis (IPF) can be described as a debilitating lung disease that is characterized by the complex interactions between various immune cell types and signaling pathways. Chromatin-modifying enzymes are significantly involved in regulating gene expression during immune cell development, yet their role in IPF is not well understood.
Methods: In this study, differential gene expression analysis and chromatin-modifying enzyme-related gene data were conducted to identify hub genes, common pathways, immune cell infiltration, and potential drug targets for IPF. Additionally, a murine model was employed for investigating the expression levels of candidate hub genes and determining the infiltration of different immune cells in IPF.
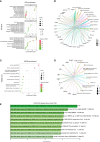
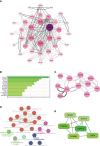
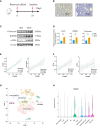
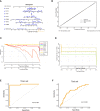
Results: We identified 33 differentially expressed genes associated with chromatin-modifying enzymes. Enrichment analyses of these genes demonstrated a strong association with histone lysine demethylation, Sin3-type complexes, and protein demethylase activity. Protein-protein interaction network analysis further highlighted six hub genes, specifically KDM6B, KDM5A, SETD7, SUZ12, HDAC2, and CHD4. Notably, KDM6B expression was significantly increased in the lungs of bleomycin-induced pulmonary fibrosis mice, showing a positive correlation with fibronectin and α-SMA, two essential indicators of pulmonary fibrosis. Moreover, we established a diagnostic model for IPF focusing on KDM6B and we also identified 10 potential therapeutic drugs targeting KDM6B for IPF treatment.
Conclusion: Our findings suggest that molecules related to chromatin-modifying enzymes, primarily KDM6B, play a critical role in the pathogenesis and progression of IPF.
Keywords: Idiopathic Pulmonary Fibrosis; chromatin-modifying enzymes; disease biomarker; drug molecule; gene ontology; hub genes.
Copyright © 2023 Chen, Sun, Sun, Huang, Fang, Zhang and Qian.
Conflict of interest statement
The authors declare that the research was conducted in the absence of any commercial or financial relationships that could be construed as a potential conflict of interest.
Figures


Similar articles
-
The histone demethylase KDM6B links obstructive sleep apnea to idiopathic pulmonary fibrosis.FASEB J. 2025 Jan 15;39(1):e70306. doi: 10.1096/fj.202402813R. FASEB J. 2025. PMID: 39781582 Free PMC article.
-
Contribution of cuproptosis and immune-related genes to idiopathic pulmonary fibrosis disease.Front Immunol. 2025 Feb 7;16:1458341. doi: 10.3389/fimmu.2025.1458341. eCollection 2025. Front Immunol. 2025. PMID: 39991151 Free PMC article.
-
Identification of diagnostic hub genes related to neutrophils and infiltrating immune cell alterations in idiopathic pulmonary fibrosis.Front Immunol. 2023 Jun 2;14:1078055. doi: 10.3389/fimmu.2023.1078055. eCollection 2023. Front Immunol. 2023. PMID: 37334348 Free PMC article.
-
Identification of oxidative stress-related diagnostic markers and immune infiltration features for idiopathic pulmonary fibrosis by bibliometrics and bioinformatics.Front Med (Lausanne). 2024 Aug 6;11:1356825. doi: 10.3389/fmed.2024.1356825. eCollection 2024. Front Med (Lausanne). 2024. PMID: 39165378 Free PMC article. Review.
-
Ability of Periostin as a New Biomarker of Idiopathic Pulmonary Fibrosis.Adv Exp Med Biol. 2019;1132:79-87. doi: 10.1007/978-981-13-6657-4_9. Adv Exp Med Biol. 2019. PMID: 31037627 Review.
Cited by
-
Identification and Construction of a R-loop Mediated Diagnostic Model and Associated Immune Microenvironment of COPD through Machine Learning and Single-Cell Transcriptomics.Inflammation. 2025 Aug;48(4):2802-2823. doi: 10.1007/s10753-024-02232-x. Epub 2025 Jan 11. Inflammation. 2025. PMID: 39798034 Free PMC article.
-
The histone demethylase KDM6B links obstructive sleep apnea to idiopathic pulmonary fibrosis.FASEB J. 2025 Jan 15;39(1):e70306. doi: 10.1096/fj.202402813R. FASEB J. 2025. PMID: 39781582 Free PMC article.
-
Deciphering the molecular nexus between Omicron infection and acute kidney injury: a bioinformatics approach.Front Mol Biosci. 2024 Jul 4;11:1340611. doi: 10.3389/fmolb.2024.1340611. eCollection 2024. Front Mol Biosci. 2024. PMID: 39027131 Free PMC article.
References
Publication types
MeSH terms
Substances
LinkOut - more resources
Full Text Sources

