

Potential of algae-derived alginate oligosaccharides and β-glucan to counter inflammation in adult zebrafish intestine
- PMID: 37275890
- PMCID: PMC10235609
- DOI: 10.3389/fimmu.2023.1183701
Potential of algae-derived alginate oligosaccharides and β-glucan to counter inflammation in adult zebrafish intestine
Abstract
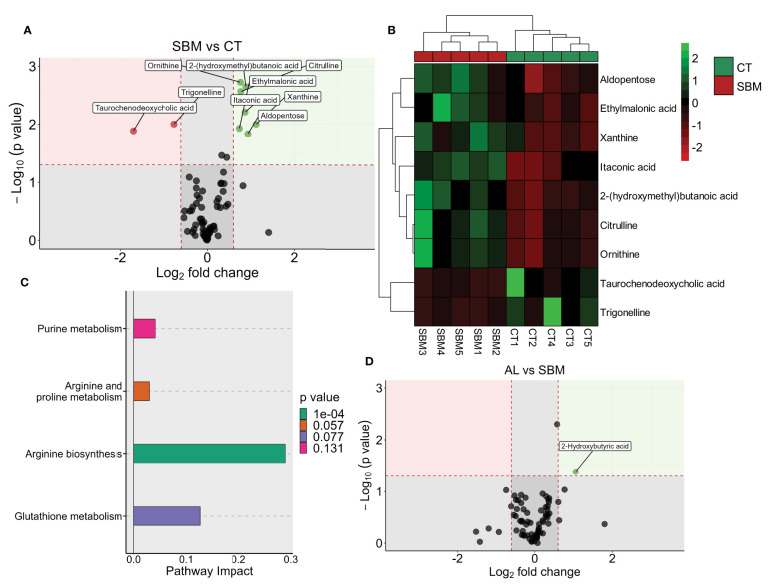
Alginate oligosaccharides (AOS) are natural bioactive compounds with anti-inflammatory properties. We performed a feeding trial employing a zebrafish (Danio rerio) model of soybean-induced intestinal inflammation. Five groups of fish were fed different diets: a control (CT) diet, a soybean meal (SBM) diet, a soybean meal+β-glucan (BG) diet and 2 soybean meal+AOS diets (alginate products differing in the content of low molecular weight fractions - AL, with 31% < 3kDa and AH, with 3% < 3kDa). We analyzed the intestinal transcriptomic and plasma metabolomic profiles of the study groups. In addition, we assessed the expression of inflammatory marker genes and histological alterations in the intestine. Dietary algal β-(1, 3)-glucan and AOS were able to bring the expression of certain inflammatory genes altered by dietary SBM to a level similar to that in the control group. Intestinal transcriptomic analysis indicated that dietary SBM changed the expression of genes linked to inflammation, endoplasmic reticulum, reproduction and cell motility. The AL diet suppressed the expression of genes related to complement activation, inflammatory and humoral response, which can likely have an inflammation alleviation effect. On the other hand, the AH diet reduced the expression of genes, causing an enrichment of negative regulation of immune system process. The BG diet suppressed several immune genes linked to the endopeptidase activity and proteolysis. The plasma metabolomic profile further revealed that dietary SBM can alter inflammation-linked metabolites such as itaconic acid, taurochenodeoxycholic acid and enriched the arginine biosynthesis pathway. The diet AL helped in elevating one of the short chain fatty acids, namely 2-hydroxybutyric acid while the BG diet increased the abundance of a vitamin, pantothenic acid. Histological evaluation revealed the advantage of the AL diet: it increased the goblet cell number and length of villi of the intestinal mucosa. Overall, our results indicate that dietary AOS with an appropriate amount of < 3kDa can stall the inflammatory responses in zebrafish.
Keywords: RNA seq; gut; macroalgae; metabolomics; microalgae; prebiotics; β-glucans.
Copyright © 2023 Rehman, Gora, Abdelhafiz, Dias, Pierre, Meynen, Fernandes, Sørensen, Brugman and Kiron.
Conflict of interest statement
Author JD was employed by company SPAROS Lda., RP by CEVA and KM by Kemin Aquascience. The remaining authors declare that the research was conducted in the absence of any commercial or financial relationships that could be construed as a potential conflict of interest.
Figures


Similar articles
-
Developmental defects and behavioral changes in a diet-induced inflammation model of zebrafish.Front Immunol. 2022 Oct 26;13:1018768. doi: 10.3389/fimmu.2022.1018768. eCollection 2022. Front Immunol. 2022. PMID: 36389790 Free PMC article.
-
The use of dipeptide supplementation as a means of mitigating the negative effects of dietary soybean meal on Zebrafish Danio rerio.Comp Biochem Physiol A Mol Integr Physiol. 2021 Jul;257:110958. doi: 10.1016/j.cbpa.2021.110958. Epub 2021 Apr 15. Comp Biochem Physiol A Mol Integr Physiol. 2021. PMID: 33865992
-
Effects of dietary b-glucan, mannan oligosaccharide, Lactobacillus plantarum and their combinations on growth performance, immunity and immune related gene expression of Caspian trout, Salmo trutta caspius (Kessler, 1877).Fish Shellfish Immunol. 2019 Aug;91:202-208. doi: 10.1016/j.fsi.2019.05.024. Epub 2019 May 11. Fish Shellfish Immunol. 2019. PMID: 31085328
-
Effects of bioprocessed soybean meal and nucleotide supplementation on growth, physiology and histomorphology in largemouth bass, Micropterus salmoides, juveniles.Comp Biochem Physiol A Mol Integr Physiol. 2021 Oct;260:111038. doi: 10.1016/j.cbpa.2021.111038. Epub 2021 Jul 13. Comp Biochem Physiol A Mol Integr Physiol. 2021. PMID: 34271205 Review.
-
An exploration of alginate oligosaccharides modulating intestinal inflammatory networks via gut microbiota.Front Microbiol. 2023 Jan 26;14:1072151. doi: 10.3389/fmicb.2023.1072151. eCollection 2023. Front Microbiol. 2023. PMID: 36778853 Free PMC article. Review.
Cited by
-
Brewers' Yeast (Saccharomyces cerevisiae) Purified Functional Feed Additives Mitigate Soybean Meal-Induced Enteritis in Atlantic Salmon (Salmo salar) Parr.Aquac Nutr. 2025 Apr 10;2025:8555658. doi: 10.1155/anu/8555658. eCollection 2025. Aquac Nutr. 2025. PMID: 40255579 Free PMC article.
-
Alginate Oligosaccharide and Gut Microbiota: Exploring the Key to Health.Nutrients. 2025 Jun 11;17(12):1977. doi: 10.3390/nu17121977. Nutrients. 2025. PMID: 40573088 Free PMC article. Review.
-
Catching the Big Fish in Big Data: A Meta-Analysis of Zebrafish Kidney scRNA-Seq Datasets Highlights Conserved Molecular Profiles of Macrophages and Neutrophils in Vertebrates.Biology (Basel). 2024 Sep 27;13(10):773. doi: 10.3390/biology13100773. Biology (Basel). 2024. PMID: 39452082 Free PMC article.
-
Anti-Inflammatory Effects of Algae-Derived Biomolecules in Gut Health: A Review.Int J Mol Sci. 2025 Jan 21;26(3):885. doi: 10.3390/ijms26030885. Int J Mol Sci. 2025. PMID: 39940655 Free PMC article. Review.
References
-
- Gibson GR, Hutkins R, Sanders ME, Prescott SL, Reimer RA, Salminen SJ, et al. . Expert consensus document: the international scientific association for probiotics and prebiotics (ISAPP) consensus statement on the definition and scope of prebiotics. Nat Rev Gastroenterol Hepatol (2017) 14:491–502. doi: 10.1038/nrgastro.2017.75 - DOI - PubMed
Publication types
MeSH terms
Substances
LinkOut - more resources
Full Text Sources