

Evaluation of the Blood-Brain Barrier, Demyelination, and Neurodegeneration in Paramagnetic Rim Lesions in Multiple Sclerosis on 7 Tesla MRI
- PMID: 37276054
- PMCID: PMC10754232
- DOI: 10.1002/jmri.28847
Evaluation of the Blood-Brain Barrier, Demyelination, and Neurodegeneration in Paramagnetic Rim Lesions in Multiple Sclerosis on 7 Tesla MRI
Abstract
Background: Paramagnetic rim lesions (PRLs) are associated with chronic inflammation in multiple sclerosis (MS). 7-Tesla (7T) magnetic resonance imaging (MRI) can evaluate the integrity of the blood-brain barrier (BBB) in addition to the tissue myelination status and cell loss.
Purpose: To use MRI metrics to investigate underlying physiology and clinical importance of PRLs.
Study type: Prospective.
Subjects: Thirty-six participants (mean-age 47, 23 females, 13 males) of mixed MS subtypes.
Field strength/sequence: 7T, MP2RAGE, MULTI-ECHO 3D-GRE, FLAIR.
Assessment: Lesion heterogeneity; longitudinal changes in lesion counts; comparison of T1, R2*, and χ; association between baseline lesion types and disease progression (2-3 annual MRI visits with additional years of annual clinical follow-up).
Statistical tests: Two-sample t-test, Wilcoxon Rank-Sum test, Pearson's chi-square test, two-group comparison with linear-mixed-effect model, mixed-effect ANOVA, logistic regression. P-values <0.05 were considered significant.
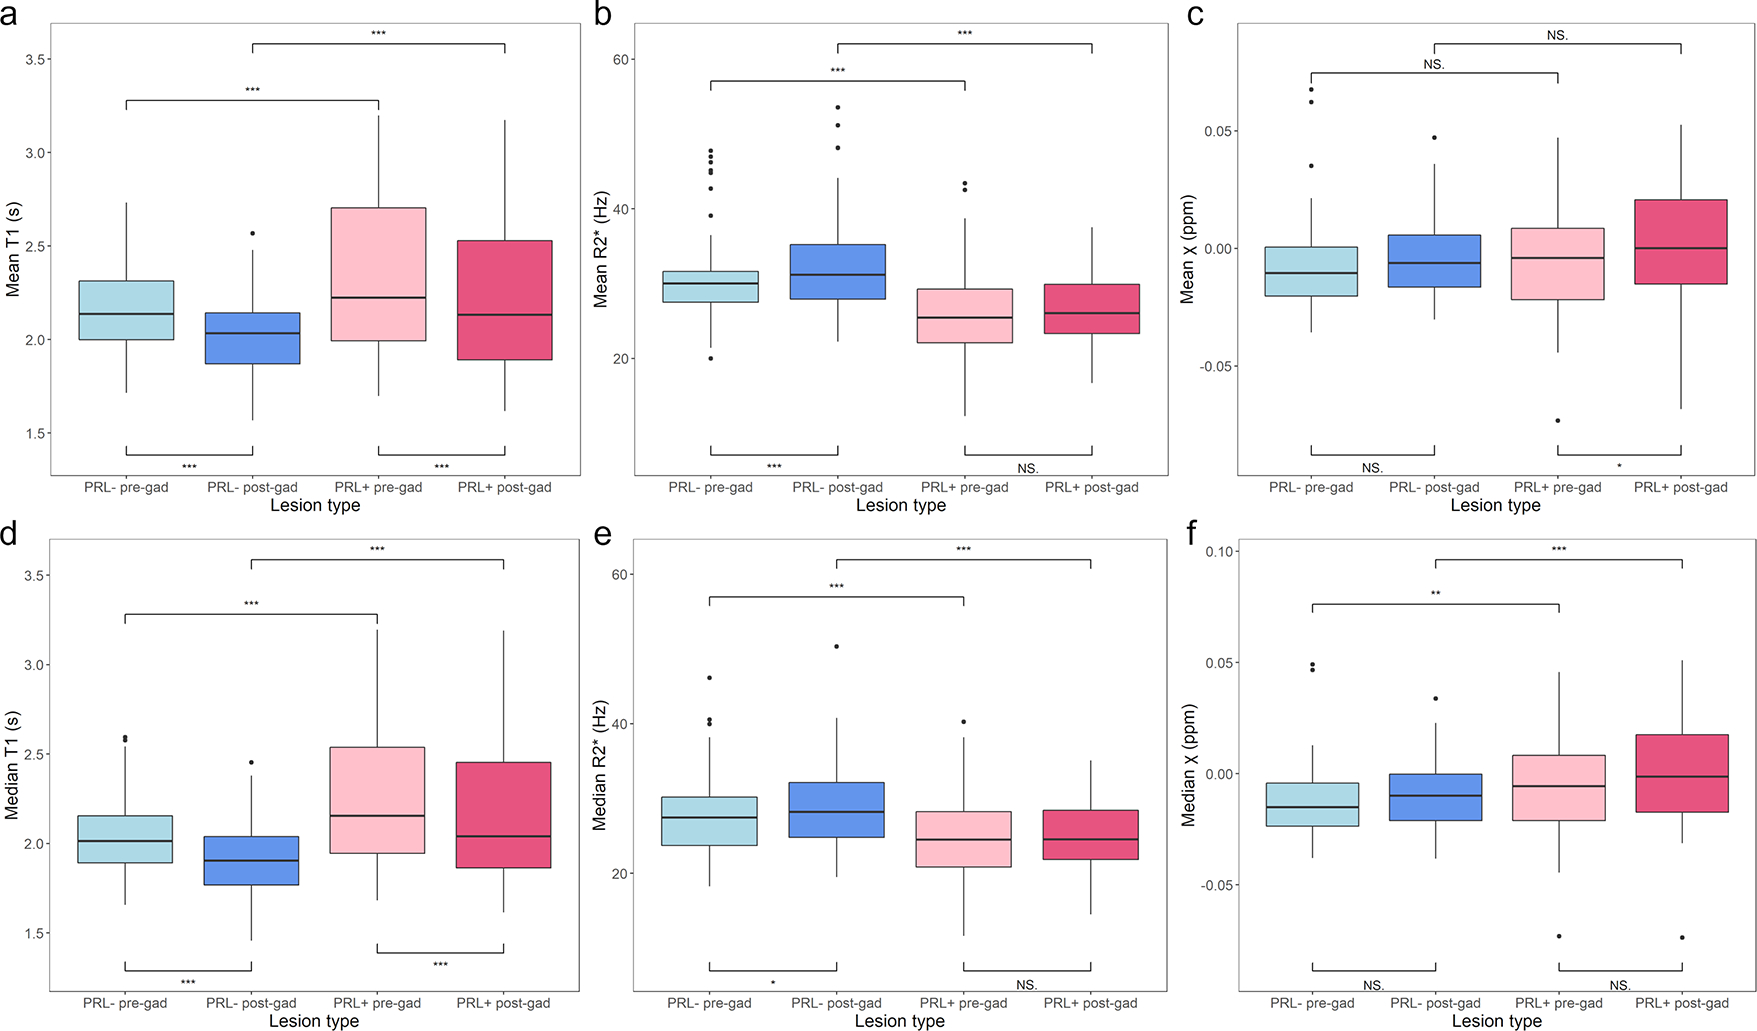
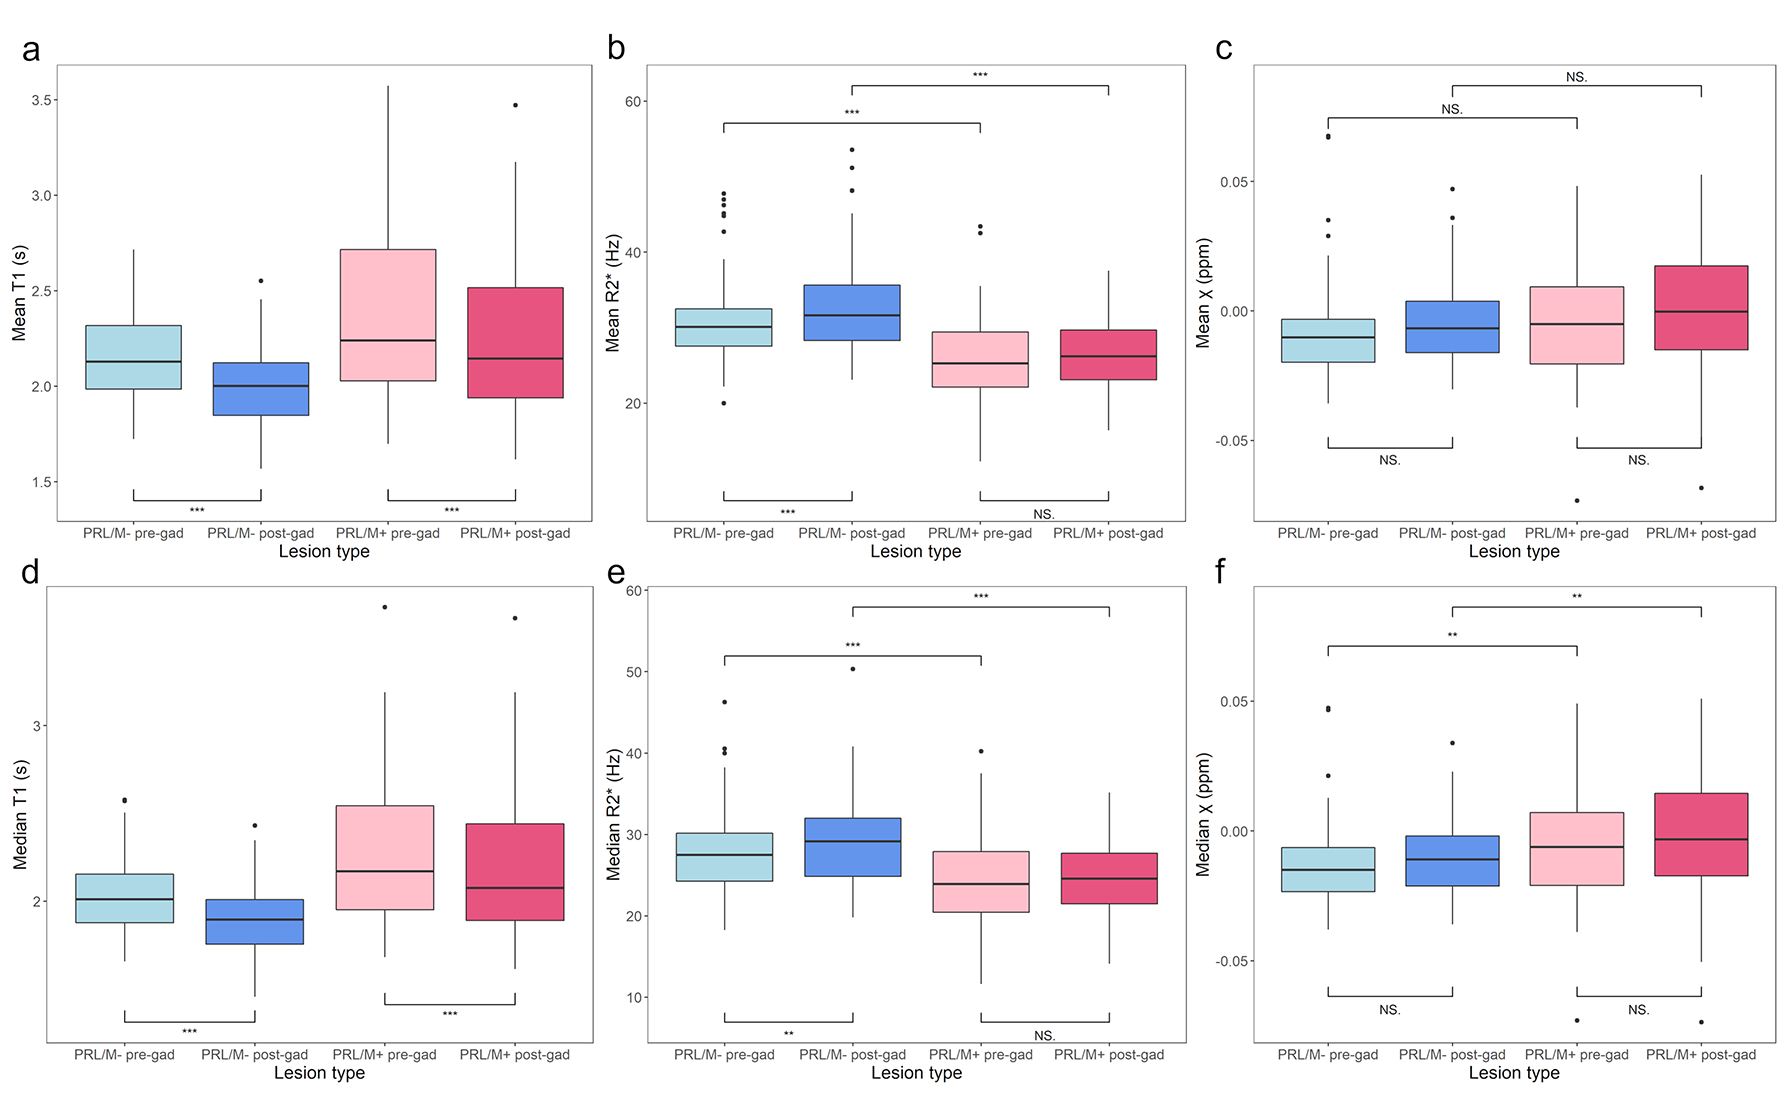
Results: A total of 58.3% of participants had at least one PRL at baseline. Higher male proportion in PRL+ group was found. Average change in PRL count was 0.20 (SD = 2.82) for PRLs and 0.00 (SD = 0.82) for mottled lesions. Mean and median pre-/post-contrast T1 were longer in PRL+ than in PRL-. No differences in mean χ were seen for lesions grouped by PRL (P = 0.310, pre-contrast; 0.086, post-contrast) or PRL/M presence (P = 0.234, pre-contrast; 0.163, post-contrast). Median χ were less negative in PRL+ and PRL/M+ than in PRL- and PRL/M-. Mean and median pre-/post-contrast R2* were slower in PRL+ compared to PRL-. Mean and median pre-/post-contrast R2* were slower in PRL/M+ than in PRL/M-. PRL presence at baseline was associated with confirmed EDSS Plus progression (OR 3.75 [1.22-7.59]) and PRL/M+ at baseline with confirmed EDSS Plus progression (OR 3.63 [1.14-7.43]).
Data conclusion: Evidence of BBB breakdown in PRLs was not seen. Quantitative metrics confirmed prior results suggesting greater demyelination, cell loss, and possibly disruption of tissue anisotropy in PRLs.
Evidence level: 2 TECHNICAL EFFICACY: Stage 2.
Keywords: disease progression; multiple sclerosis; paramagnetic rim lesion; ultra-high field MRI.
© 2023 International Society for Magnetic Resonance in Medicine.
Figures
Comment in
-
Editorial for "Evaluation of the Blood Brain Barrier, Demyelination, and Neurodegeneration of Paramagnetic Rim Lesions in Multiple Sclerosis on 7 Tesla MRI".J Magn Reson Imaging. 2024 Mar;59(3):952-953. doi: 10.1002/jmri.28791. Epub 2023 May 30. J Magn Reson Imaging. 2024. PMID: 37249089 No abstract available.
Similar articles
-
Longitudinal Multiparametric Quantitative MRI Evaluation of Acute and Chronic Multiple Sclerosis Paramagnetic Rim Lesions.J Magn Reson Imaging. 2025 Apr;61(4):1812-1828. doi: 10.1002/jmri.29583. Epub 2024 Sep 6. J Magn Reson Imaging. 2025. PMID: 39239775 Free PMC article.
-
The characteristics and influencing factors of paramagnetic rim lesions in Chinese MS patients: A 7T MRI study.Mult Scler. 2025 Jul;31(8):964-974. doi: 10.1177/13524585251328902. Epub 2025 Apr 12. Mult Scler. 2025. PMID: 40219829
-
Blood-brain barrier breakdown in non-enhancing multiple sclerosis lesions detected by 7-Tesla MP2RAGE ΔT1 mapping.PLoS One. 2021 Apr 26;16(4):e0249973. doi: 10.1371/journal.pone.0249973. eCollection 2021. PLoS One. 2021. PMID: 33901207 Free PMC article.
-
Central Vein Sign and Paramagnetic Rim Lesions: Susceptibility Changes in Brain Tissues and Their Implications for the Study of Multiple Sclerosis Pathology.Diagnostics (Basel). 2024 Jun 27;14(13):1362. doi: 10.3390/diagnostics14131362. Diagnostics (Basel). 2024. PMID: 39001252 Free PMC article. Review.
-
What is the potential of paramagnetic rim lesions as diagnostic indicators in multiple sclerosis?Expert Rev Neurother. 2022 Oct;22(10):829-837. doi: 10.1080/14737175.2022.2143265. Epub 2022 Nov 8. Expert Rev Neurother. 2022. PMID: 36342396 Review.
Cited by
-
Paramagnetic rim lesions in early multiple sclerosis: a 7 Tesla imaging study.Brain Commun. 2025 Jun 3;7(3):fcaf215. doi: 10.1093/braincomms/fcaf215. eCollection 2025. Brain Commun. 2025. PMID: 40585811 Free PMC article.
-
The use of 7T MRI in multiple sclerosis: review and consensus statement from the North American Imaging in Multiple Sclerosis Cooperative.Brain Commun. 2024 Oct 9;6(5):fcae359. doi: 10.1093/braincomms/fcae359. eCollection 2024. Brain Commun. 2024. PMID: 39445084 Free PMC article. Review.
-
Chronic active lesions in multiple sclerosis: classification, terminology, and clinical significance.Ther Adv Neurol Disord. 2024 Dec 19;17:17562864241306684. doi: 10.1177/17562864241306684. eCollection 2024. Ther Adv Neurol Disord. 2024. PMID: 39711984 Free PMC article. Review.
-
Clinical 7 Tesla magnetic resonance imaging: Impact and patient value in neurological disorders.J Intern Med. 2025 Mar;297(3):244-261. doi: 10.1111/joim.20059. Epub 2025 Jan 8. J Intern Med. 2025. PMID: 39775908 Free PMC article. Review.
-
Unmasking paramagnetic rim multiple sclerosis lesions: the advantages of quantitative susceptibility mapping over phase imaging.Brain Commun. 2025 Jan 27;7(1):fcaf037. doi: 10.1093/braincomms/fcaf037. eCollection 2025. Brain Commun. 2025. PMID: 39916750 Free PMC article.
References
Publication types
MeSH terms
Grants and funding
LinkOut - more resources
Full Text Sources
Medical
