Improvement of Precision in Recombinant Adeno-Associated Virus Infectious Titer Assay with Droplet Digital PCR as an Endpoint Measurement
- PMID: 37276150
- PMCID: PMC10457655
- DOI: 10.1089/hum.2023.014
Improvement of Precision in Recombinant Adeno-Associated Virus Infectious Titer Assay with Droplet Digital PCR as an Endpoint Measurement
Abstract
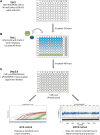
Recombinant adeno-associated virus (rAAV) has been utilized successfully for in vivo gene delivery for treatment of a variety of human diseases. To sustain the growth of recombinant AAV gene therapy products, there is a critical need for the development of accurate and robust analytical methods. Fifty percent tissue culture infectious dose (TCID50) assay is an in vitro cell-based method widely used to determine AAV infectivity, and this assay is historically viewed as a challenge due to its high variability. Currently, quantitative PCR (qPCR) serves as the endpoint method to detect the amount of replicated viral genome after infection. In this study, we optimize the TCID50 assay by adapting endpoint detection with droplet digital PCR (ddPCR). We performed TCID50 assays using ATCC AAV-2 reference standard stock material across 18 independent runs. The cell lysate from TCID50 assay was then analyzed using both qPCR and ddPCR endpoint to allow for direct comparison between the two methods. The long-term 1-year side-by-side comparison between qPCR and ddPCR as endpoint measurement demonstrated improved interassay precision when the ddPCR method was utilized. In particular, after the addition of a novel secondary set threshold for infectivity scoring of individual wells, the average infectious titer of 18 runs is 6.45E+08 with % coefficient of variation (CV) of 42.5 and 5.63E+08 with % CV of 34.9 by qPCR and ddPCR, respectively. In this study, we offer improvements of infectious titer assay with (1) higher interassay precision by adapting ddPCR as an endpoint method without the need of standard curve preparation; (2) identification of a second "set threshold" value in infectivity scoring that improves assay precision; and (3) application of statistical analysis to identify the acceptance range of infectious titer values. Taken together, we provide an optimized TCID50 method with improved interassay precision that is important for rAAV infectious titer testing during process development and manufacturing.
Keywords: AAV; TCID50; ddPCR; infectious titer; infectivity scoring; qPCR; threshold.
Conflict of interest statement
T.D., K.E., J.W., E.O., K.S., R.S., B.G. and P.W. are current employees of Lonza Houston Inc.; J.M. is current employee of Lonza Portsmouth Inc.
Figures


Similar articles
-
Self-silencing adenovirus enables precise infectious titration of recombinant adeno-associated viral vectors.Mol Ther Methods Clin Dev. 2025 May 14;33(2):101492. doi: 10.1016/j.omtm.2025.101492. eCollection 2025 Jun 12. Mol Ther Methods Clin Dev. 2025. PMID: 40519321 Free PMC article.
-
Absolute determination of single-stranded and self-complementary adeno-associated viral vector genome titers by droplet digital PCR.Hum Gene Ther Methods. 2014 Apr;25(2):115-25. doi: 10.1089/hgtb.2013.131. Epub 2014 Feb 14. Hum Gene Ther Methods. 2014. PMID: 24328707 Free PMC article.
-
Two-Dimensional Droplet Digital PCR as a Tool for Titration and Integrity Evaluation of Recombinant Adeno-Associated Viral Vectors.Hum Gene Ther Methods. 2019 Aug;30(4):127-136. doi: 10.1089/hgtb.2019.031. Epub 2019 Jun 21. Hum Gene Ther Methods. 2019. PMID: 31140327 Free PMC article.
-
Droplet digital PCR as an emerging tool in detecting pathogens nucleic acids in infectious diseases.Clin Chim Acta. 2021 Jun;517:156-161. doi: 10.1016/j.cca.2021.02.008. Epub 2021 Mar 1. Clin Chim Acta. 2021. PMID: 33662358 Review.
-
Strategy and Application of Viral Potency Assays in Cell and Gene Therapy.Methods Mol Biol. 2025;2940:215-240. doi: 10.1007/978-1-0716-4615-1_20. Methods Mol Biol. 2025. PMID: 40515915 Review.
Cited by
-
Characterization of AAV vectors: A review of analytical techniques and critical quality attributes.Mol Ther Methods Clin Dev. 2024 Jul 30;32(3):101309. doi: 10.1016/j.omtm.2024.101309. eCollection 2024 Sep 12. Mol Ther Methods Clin Dev. 2024. PMID: 39234444 Free PMC article. Review.
-
Quantification of full and empty particles of adeno-associated virus vectors via a novel dual fluorescence-linked immunosorbent assay.Mol Ther Methods Clin Dev. 2024 Jun 24;32(3):101291. doi: 10.1016/j.omtm.2024.101291. eCollection 2024 Sep 12. Mol Ther Methods Clin Dev. 2024. PMID: 39070291 Free PMC article.
-
Self-silencing adenovirus enables precise infectious titration of recombinant adeno-associated viral vectors.Mol Ther Methods Clin Dev. 2025 May 14;33(2):101492. doi: 10.1016/j.omtm.2025.101492. eCollection 2025 Jun 12. Mol Ther Methods Clin Dev. 2025. PMID: 40519321 Free PMC article.
-
Three-dimensional linkage analysis with digital PCR for genome integrity and identity of recombinant adeno-associated virus.Sci Rep. 2025 Jan 16;15(1):2154. doi: 10.1038/s41598-024-77378-7. Sci Rep. 2025. PMID: 39820513 Free PMC article.
-
An amplification-free CRISPR-Cas12a assay for titer determination and composition analysis of the rAAV genome.Mol Ther Methods Clin Dev. 2024 Jul 22;32(3):101304. doi: 10.1016/j.omtm.2024.101304. eCollection 2024 Sep 12. Mol Ther Methods Clin Dev. 2024. PMID: 39193315 Free PMC article.
References
-
- BioPhorum Operations Group Ltd (2021). Cell and gene therapy validation challenges. Available from: https://www.biophorum.com/download/cell-and-gene-therapy-validation-chal... [Last accessed: June 27, 2023].
Publication types
MeSH terms
LinkOut - more resources
Full Text Sources
